Universal, plug-and-play graph database tooling
Graphs made clear
Discover gdotv's suite of tools for searching, visualizing and modeling connected data.
Any graph database. Any query language. For Property Graphs and RDF.
Trusted by industry leaders
Case studies










Why gdotv?
Plug-and-play
Connect gdotv to your graph database in under a minute.
All in one
Replace scattered clients, notebooks and homegrown viewers with one tool for all your graph databases.
Versatile
Query, search, model, explore, report, share. From development to production, from beginner to expert, gdotv has the right tool for you and your project.
Secure
On your desktop or in your own cloud infrastructure. Your data is always yours and remains securely in your network.
< 15 minutes
from deployment to your first graph visualization
30+ connectors
for RDF, property graphs and graph on relational engines
One workbench
for all graph data projects, from development to production
Features
Connect
Point gdotv at your graph database, and it will walk you through the steps to connect securely in less than a minute.
Discover
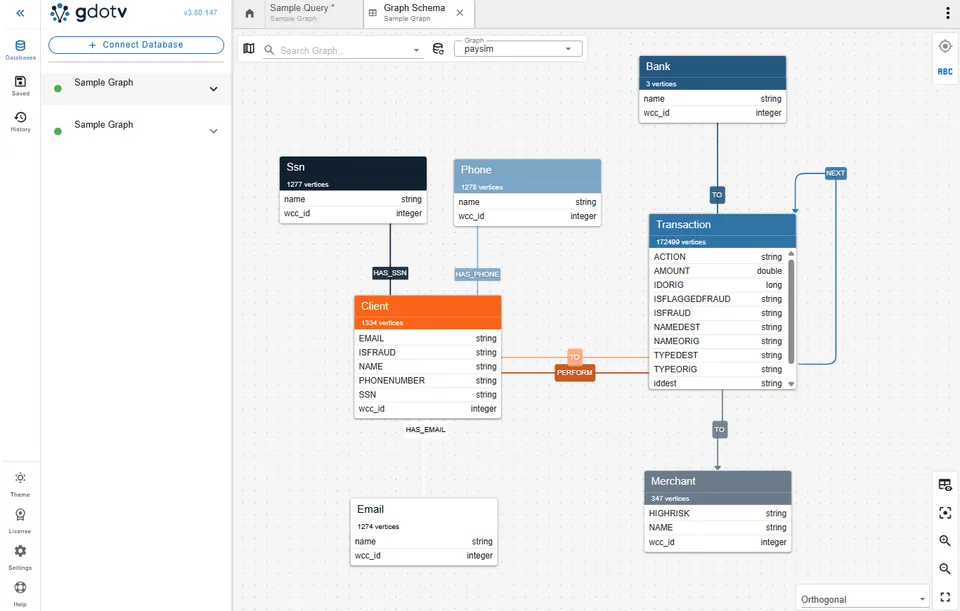
gdotv fetches your graph schema proactively via APIs and queries, or discovers it as you query data. This is a top-down overview of your data's structure that evolves with your graph.
Query & Debug
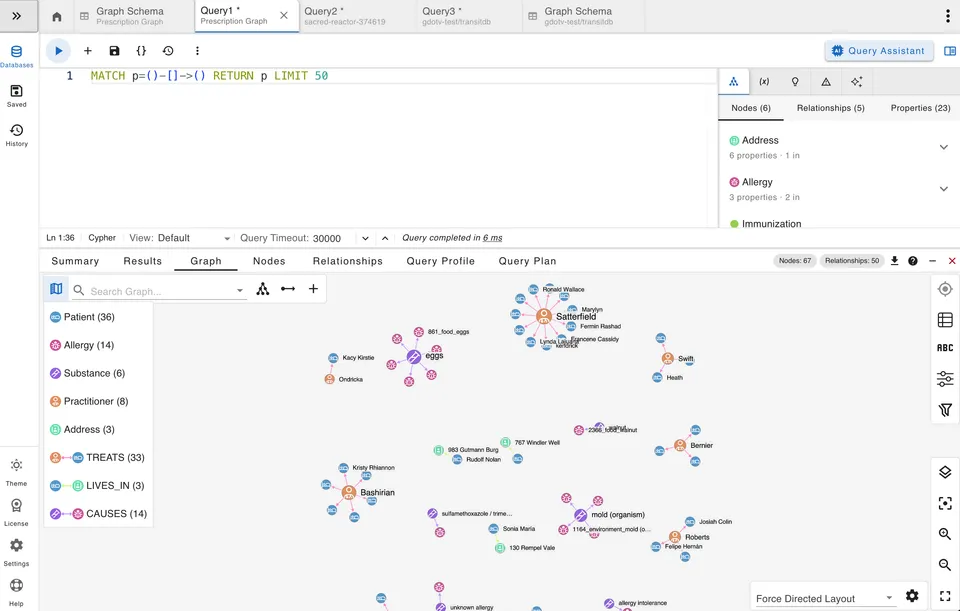
Write in your language of choice, with schema-aware autocomplete and validation available for Gremlin, Cypher, SPARQL, GQL and more.
Model & Edit
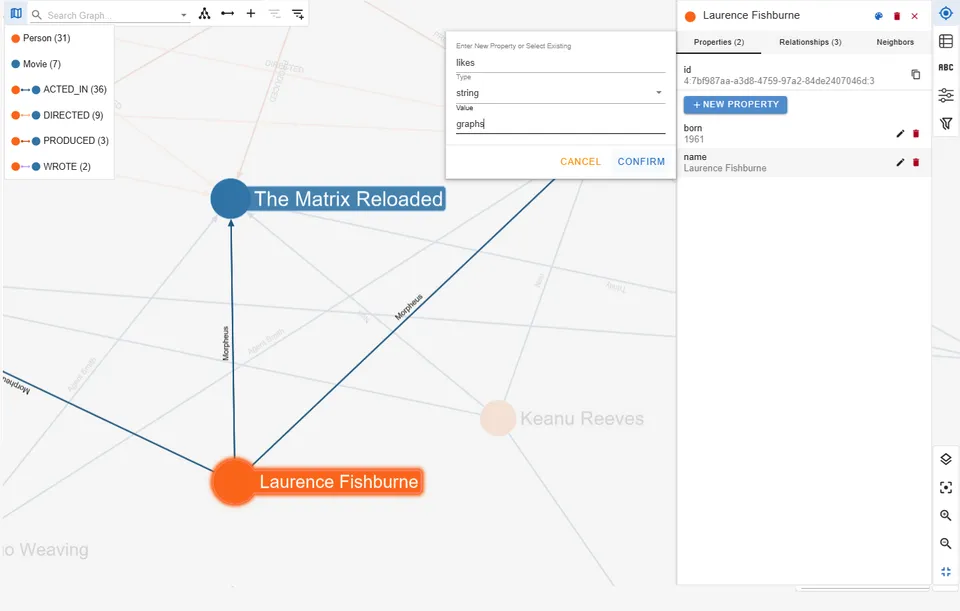
Create, update and delete nodes, relationships and properties directly against the live schema.
Visualize & Explore
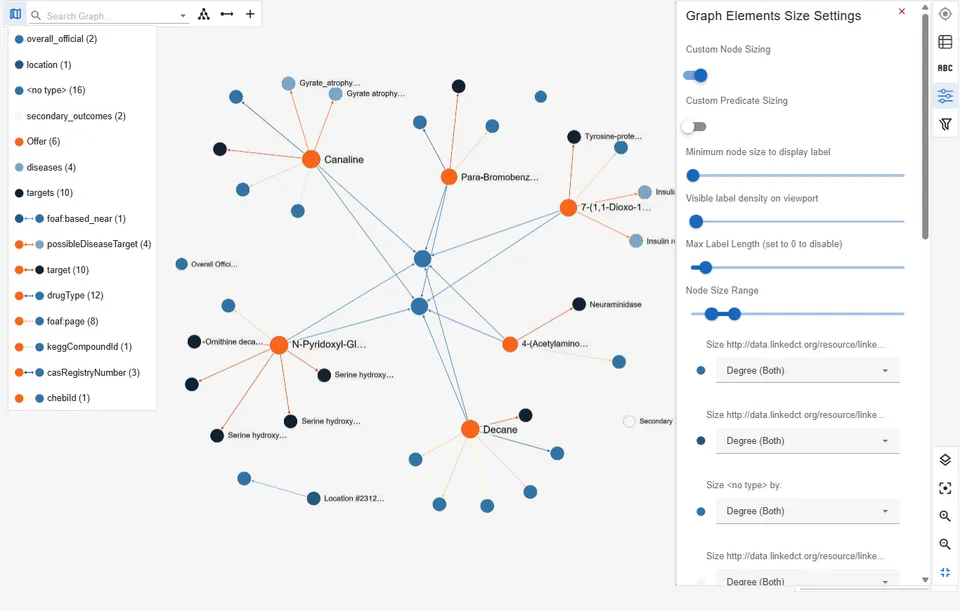
Display the graph how you think about it. Directly, using geospatial data, or navigating with the no-code explorer.
Share Dashboards & Reports
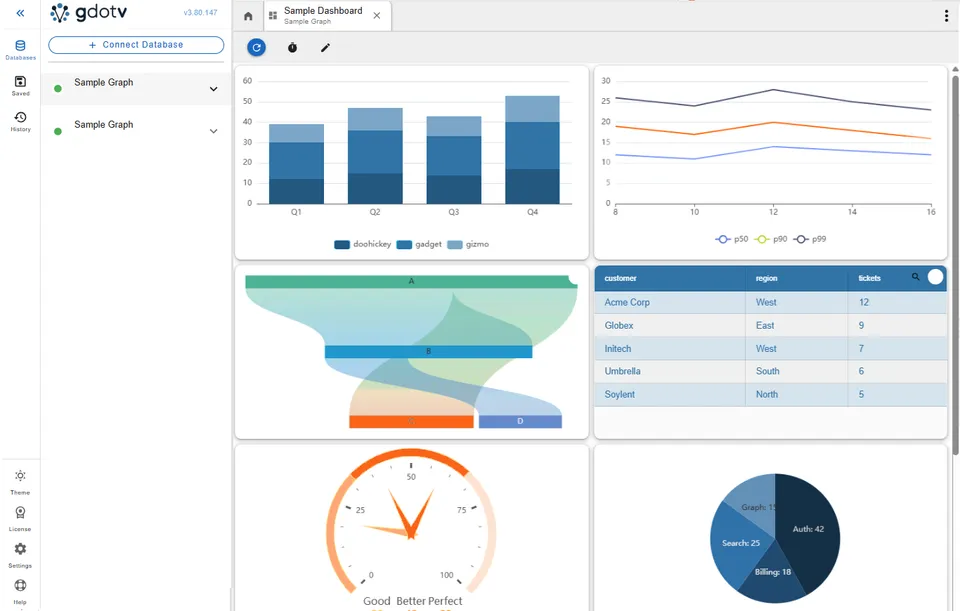
Securely publish parameterized dashboards or reports for analysts and stakeholders to derive insights from your graph data, without any querying.
Graph database coverage
We know graph databases inside out
gdotv has deep expertise in the graph database industry. Our products are meticulously integrated with your favorite graph database(s). From development to production, query to graph visualization, and insights, we've got you covered.
 Amazon Neptune
 Google Cloud Spanner Graph
 Azure Cosmos DB
 Neo4j AuraDB
 Amazon Neptune Analytics
 Google Cloud BigQuery Graph
- Amazon Neptune (RDF)
 GraphDB
 Stardog
 PuppyGraph
 FalkorDB
 Neo4j
Neo4j Apache Jena
 LadybugDB
 Apache AGE
 JanusGraph
 Apache HugeGraph
 pgGraph
 Memgraph
 RDF4J
RDF4J Aerospike Graph
 ArcadeDB
 Dgraph
 Tentris
 RDFox
RDFox QLever
 Gremlin Server
 Oracle
 Virtuoso
 AllegroGraph
 Kuzu
Kuzu Blazegraph
 Aliyun GDB
Deploy or install anywhere
For teams with cloud-hosted databases



Self-hosted
For individuals and local development
Windows
macOS
Linux
Our solutions
Whether you're an individual or part of a larger team, there's a version of gdotv that's right for you.
gdotv Desktop
The ultimate graph database IDE.
Install and connect your first graph database in 2 minutes.
gdotv Team
The unified workbench for graph data teams.
Deploy to your team in under 15 minutes. Marketplace or self-hosted.
gdotv Enterprise
The universal graph intelligence platform.
For organization-wide deployments. Bring graph data directly to your analysts.
Case study
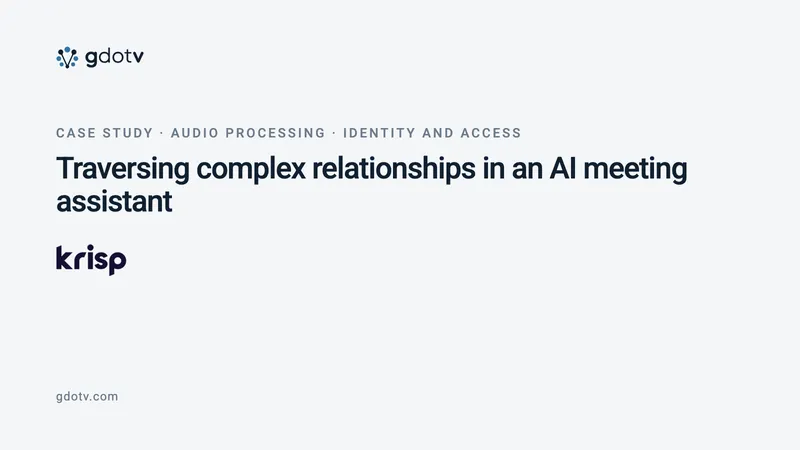
Krisp uses gdotv to traverse complex relationships in their AI meeting assistant
See how audio processing and communication platform Krisp uses gdotv in content management and identity & access management.
From the blog
All blog posts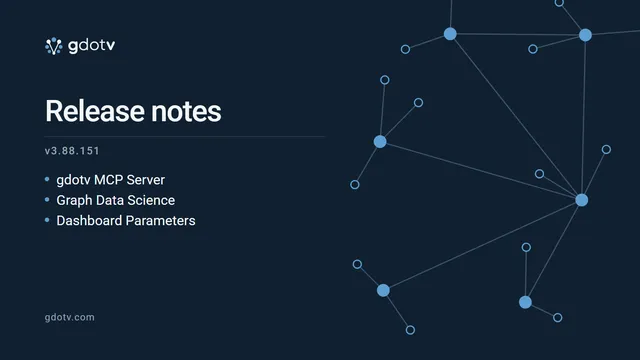
gdotv MCP server and graph data science [v3.88.151 Release Notes]
Query your graph in plain language through the new gdotv MCP server, run centrality and Louvain community detection on screen, and filter dashboards live.
EFFKG Review, Part 3: How to Score Knowledge Graph Referencing Quality
Score referencing quality in a public knowledge graph with RQSS, and see why 4 million EFFKG references resolving to 13 sources prove less than they look.
EFFKG Review, Part 2: 4 Queries That Expose the Fishing Fleet Graph
Explore the European Fishing Fleet Knowledge Graph with 4 SPARQL queries that return graphs instead of tables, and find where its structure runs out.
Why is GraphRAG so hard? Find out in this Neo4j Fujitsu knowledge base
Explore a Neo4j case study in GraphRAG systems, what insights we uncovered along the way and how to improve graph-based retrieval workflows using gdotv.