What do Neo4j, MySQL, Microsoft SQL, and many other databases have that Apache TinkerPop doesn’t?
You probably read the title – an Integrated Development Environment (IDE)!
SQL in particular has a lot of options available – MySQL Workbench, Microsoft SQL Server, DBeaver, the list goes on. Neo4j has an entire suite of tools to cover the various aspects of data management (Neo4j Bloom, Neo4j Desktop).
It’s an essential part of a database’s toolkit in helping developers, data designers and analysts work with their data day to day as well as presenting it to stakeholders.
So what does Apache TinkerPop have to offer users out of the box? Why of course, the Gremlin Console!
Gremlin Console is an interactive terminal that ships with all releases of Apache TinkerPop and allows users to quickly run queries against their database without the need for writing any code.
It’s a command line interface – that means it’s somewhat limited in what it can display but it has a number of customisable options called “Console Preferences” which can improve the quality of the display. For instance, they allow introducing intuitive color schemes to visually disseminate the different types of results output when running a query.
There’s been a lot of effort put behind the Gremlin Console and there’s no better way to learn about what it is and what it can do than to check out its main tutorial.
Now we’re not here to bad mouth the Gremlin Console by any means – it’s a great tool to get started with Gremlin. In fact the best and most popular Gremlin learning resource (in my humble opinion), Kelvin Lawrence’s Practical Gremlin – An Apache TinkerPop Tutorial, uses the Gremlin Console to demonstrate the many querying use cases of Gremlin.
But if you want to get serious with Apache TinkerPop Graph databases, you’ll need a Gremlin IDE. You need G.V().
Meet G.V(), your Gremlin IDE
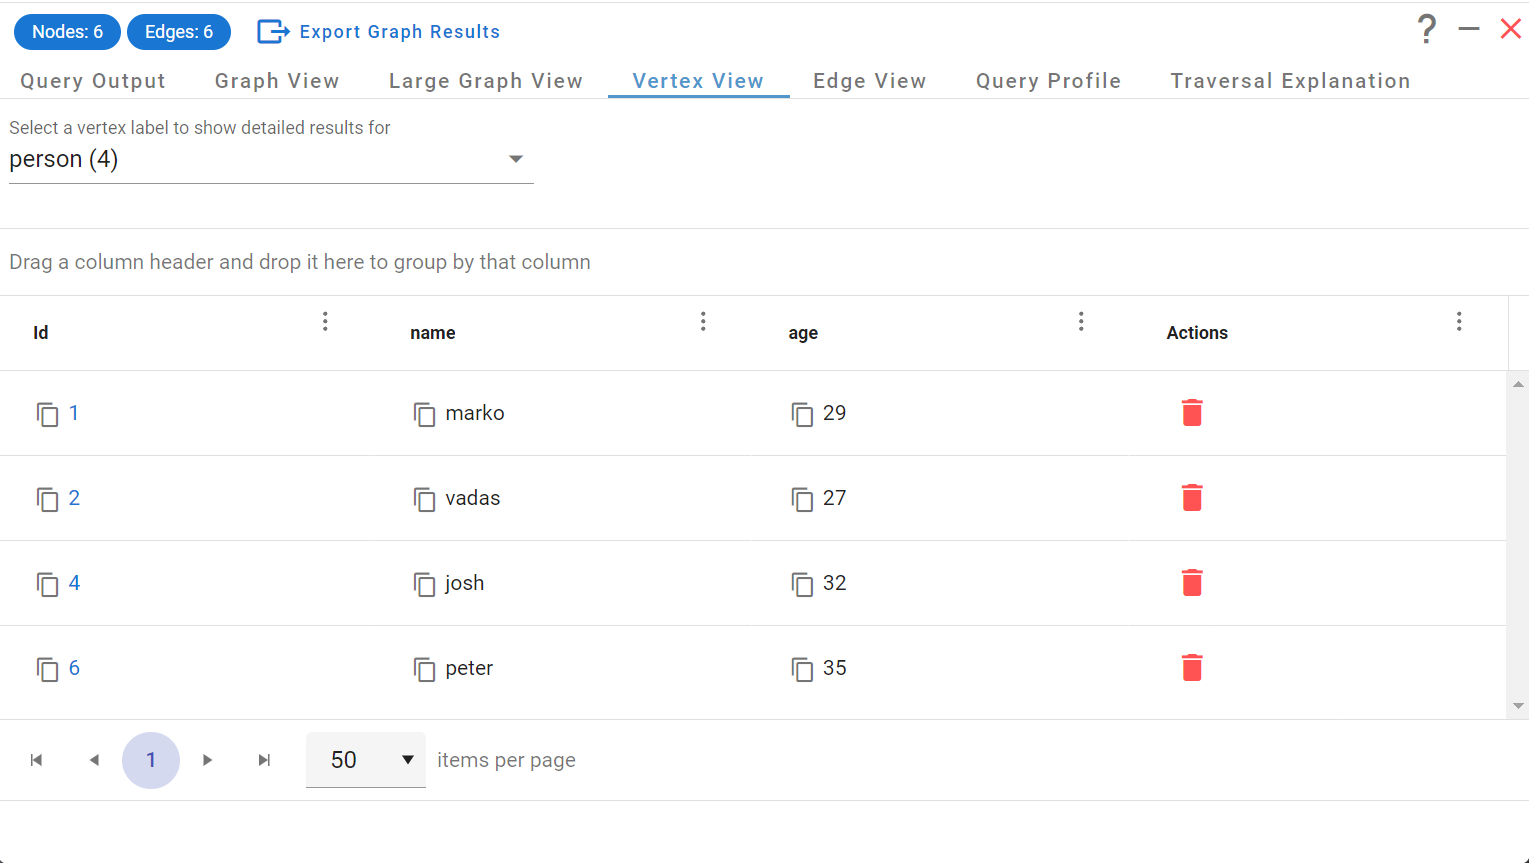
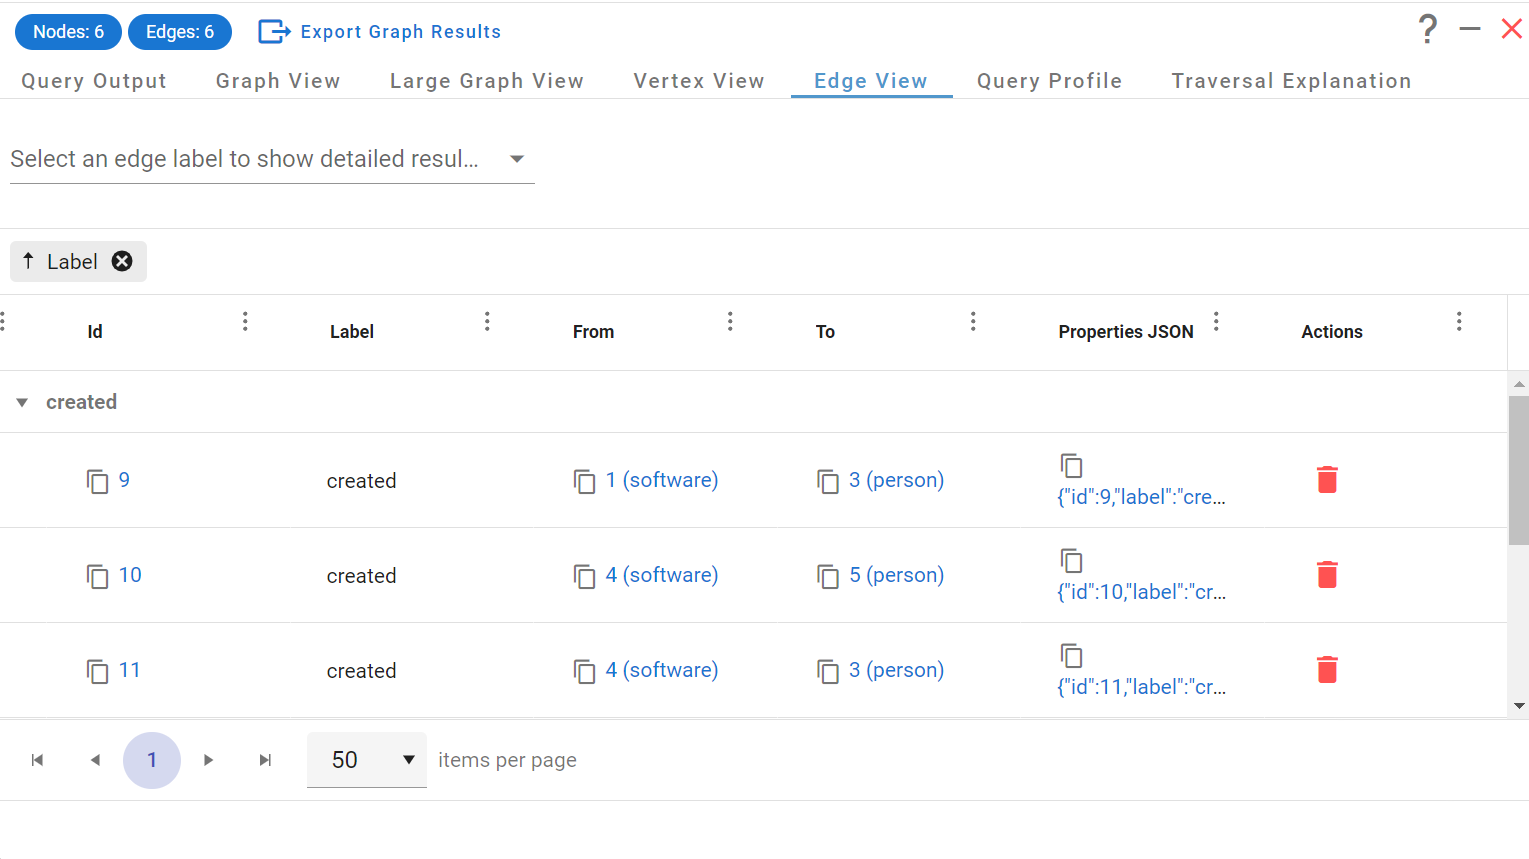
G.V() is an all-in-one Gremlin IDE to write, debug, test and analyze results for your Gremlin graph database. It offers a rich UI with smart autocomplete, graph visualization, editing and connection management.
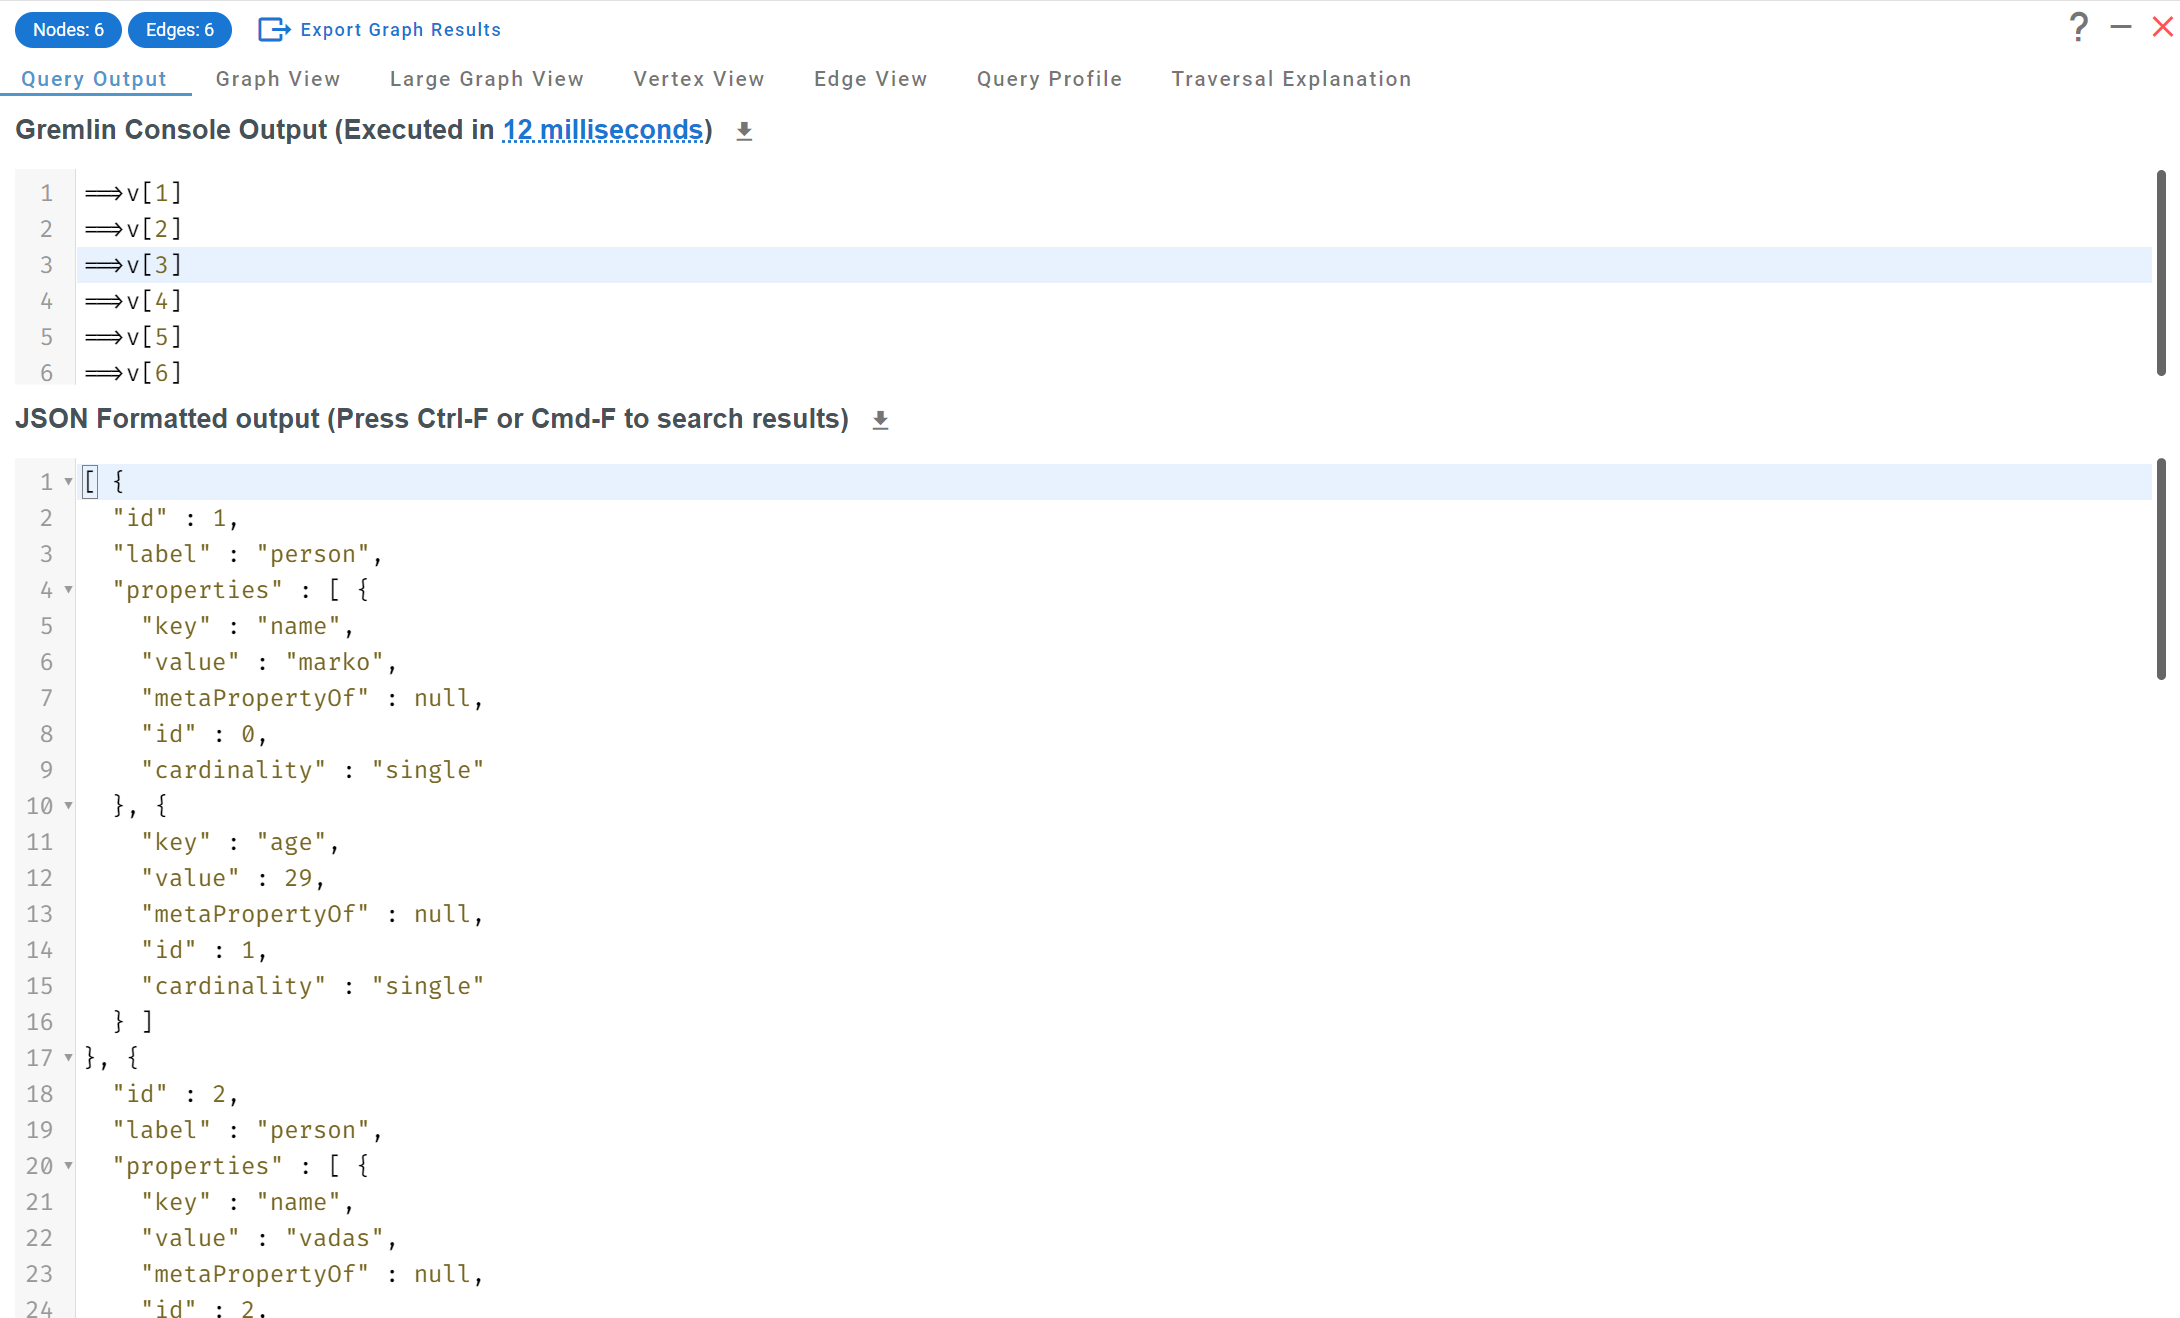
==>v[1]
==>v[2]
==>v[3]
==>v[4]
==>v[5]
==>v[6]
Now that we’ve done a quick comparison of G.V() and the Gremlin Console, let’s look at some of the common features other database IDEs offer, and how G.V() compares.
Gremlin IDE Wishlist
This is by no means exhaustive but here are some of the features commonly found in other database IDEs, such as Neo4J Bloom or Oracle’s MySQL Workbench:
- Ability to add, remove and update connection configurations to different database endpoints potentially using slightly different implementations and version of the Apache TinkerPop framework
- Ability to query the database and benefit from code completion during the writing of queries
- Ability to visualize, compare and modify data interactively on the database
- Data analysis and reporting
- Database schema management and visualisation
- Debugging, profiling, and other optimisation tooling to get the best performance out of our queries
- Easy and secure to install/deploy
These features are essential to the ecosystem of any database, and Apache TinkerPop should be no exception – and this is exactly why G.V() was created in the first place. So how does G.V() currently measure against these requirements? Quite well actually! Let’s have a closer look:
Connection Management
G.V() is officially compatible with a wide variety of Apache TinkerPop implementations. Generally speaking, any implementation of the framework that runs over a websocket channel has a fairly high chance of working out of the box with G.V(). Where official support from us is important however is that we can also implement additional functionality based on the “extras” that each of these implementation support – for instance, G.V() has official built-in support for Amazon Neptune’s IAM authentication mechanism, its Profile and Explain API endpoints, as well as many other Amazon Neptune specific features.
At time of writing, this is the exhaustive list of all the Apache TinkerPop-Enabled Graph Systems that we support, in alphabetical order:
- Aerospike Graph
- Alibaba Graph Database
- Amazon Neptune
- ArcadeDB
- Azure Cosmos DB
- DataStax Enterprise Graph
- JanusGraph
- and of course, last but not least, Gremlin Server!
Querying the database
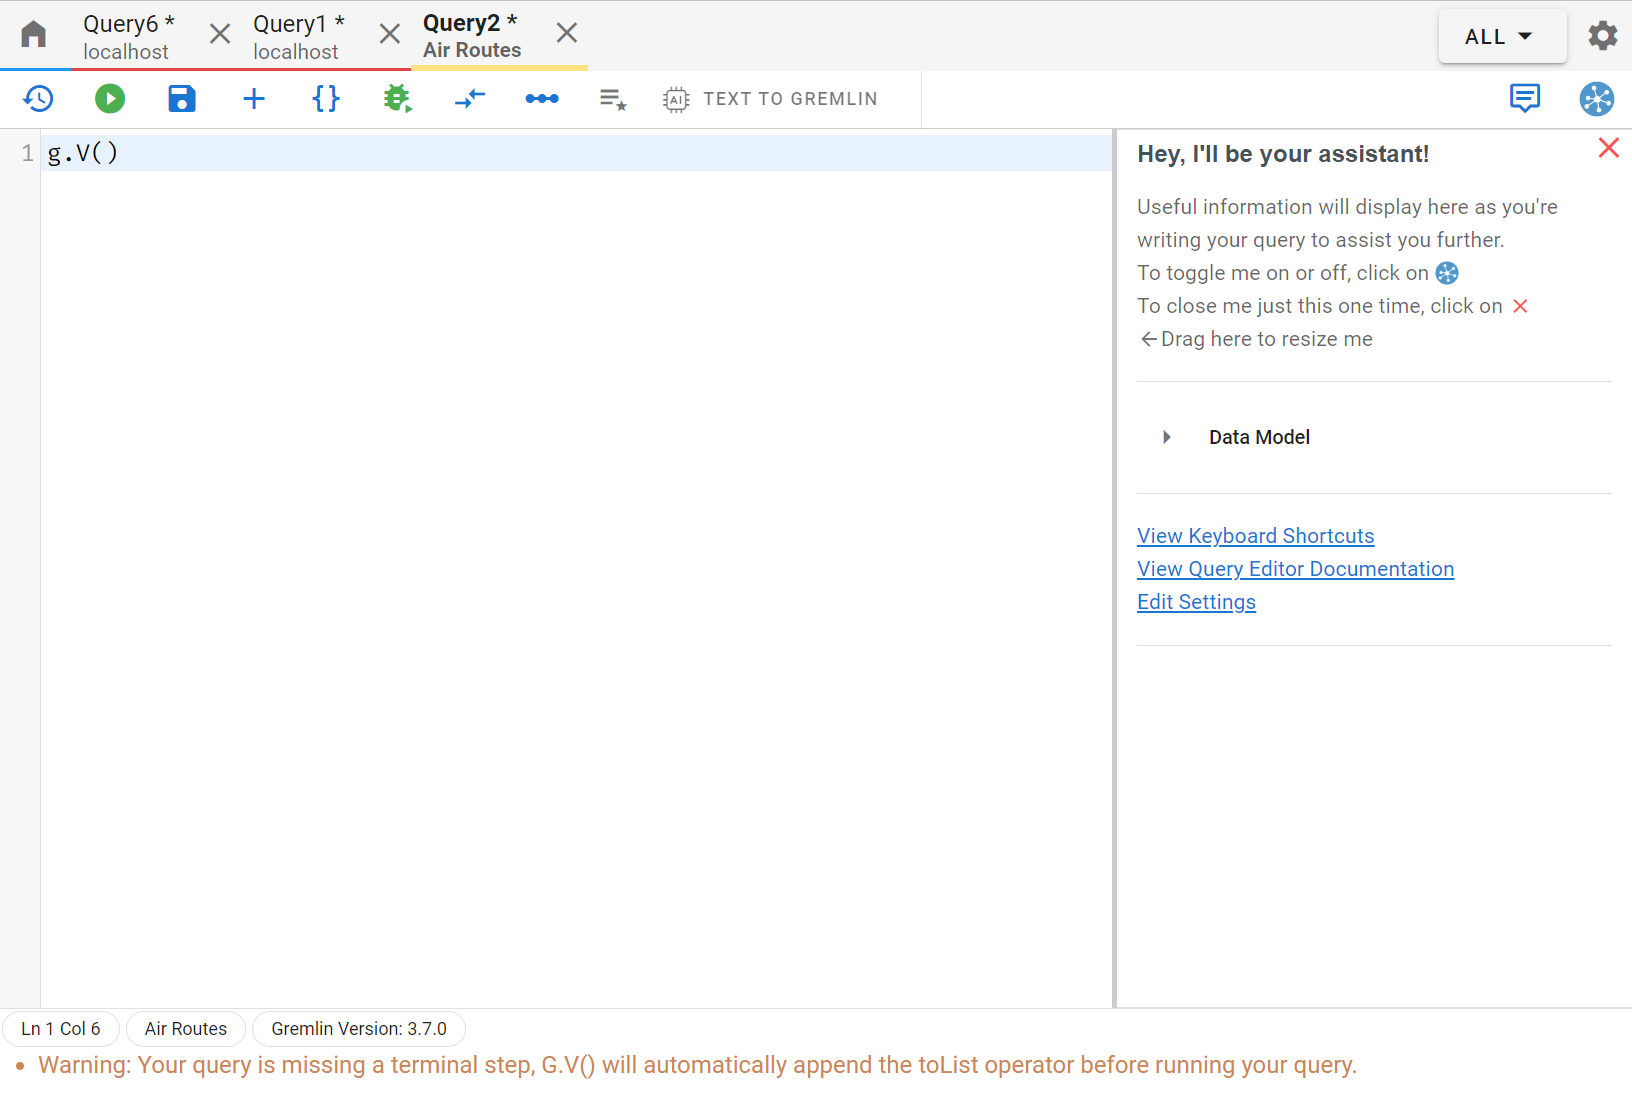
This is a lot of our users’ favourite feature of G.V() – our query editor. It is quite simply the most advanced and feature complete code editor for Gremlin you’ll find out there. It comes bundled with an advanced autocompletion engine that provides suggestions based not just on steps and predicates of the language but also vertex labels, edge labels and property keys of your database, as inferred from its data model.
It also offers syntax error reporting and highlighting, query formatting using Gremlint, Gremlin Language Variant translation (e.g. Java, Python, Go, Javascript) based on the official implementation of the framework, embedded Gremlin reference documentation, and much more! Just have a look for yourself:
Visualizing and Editing data interactively
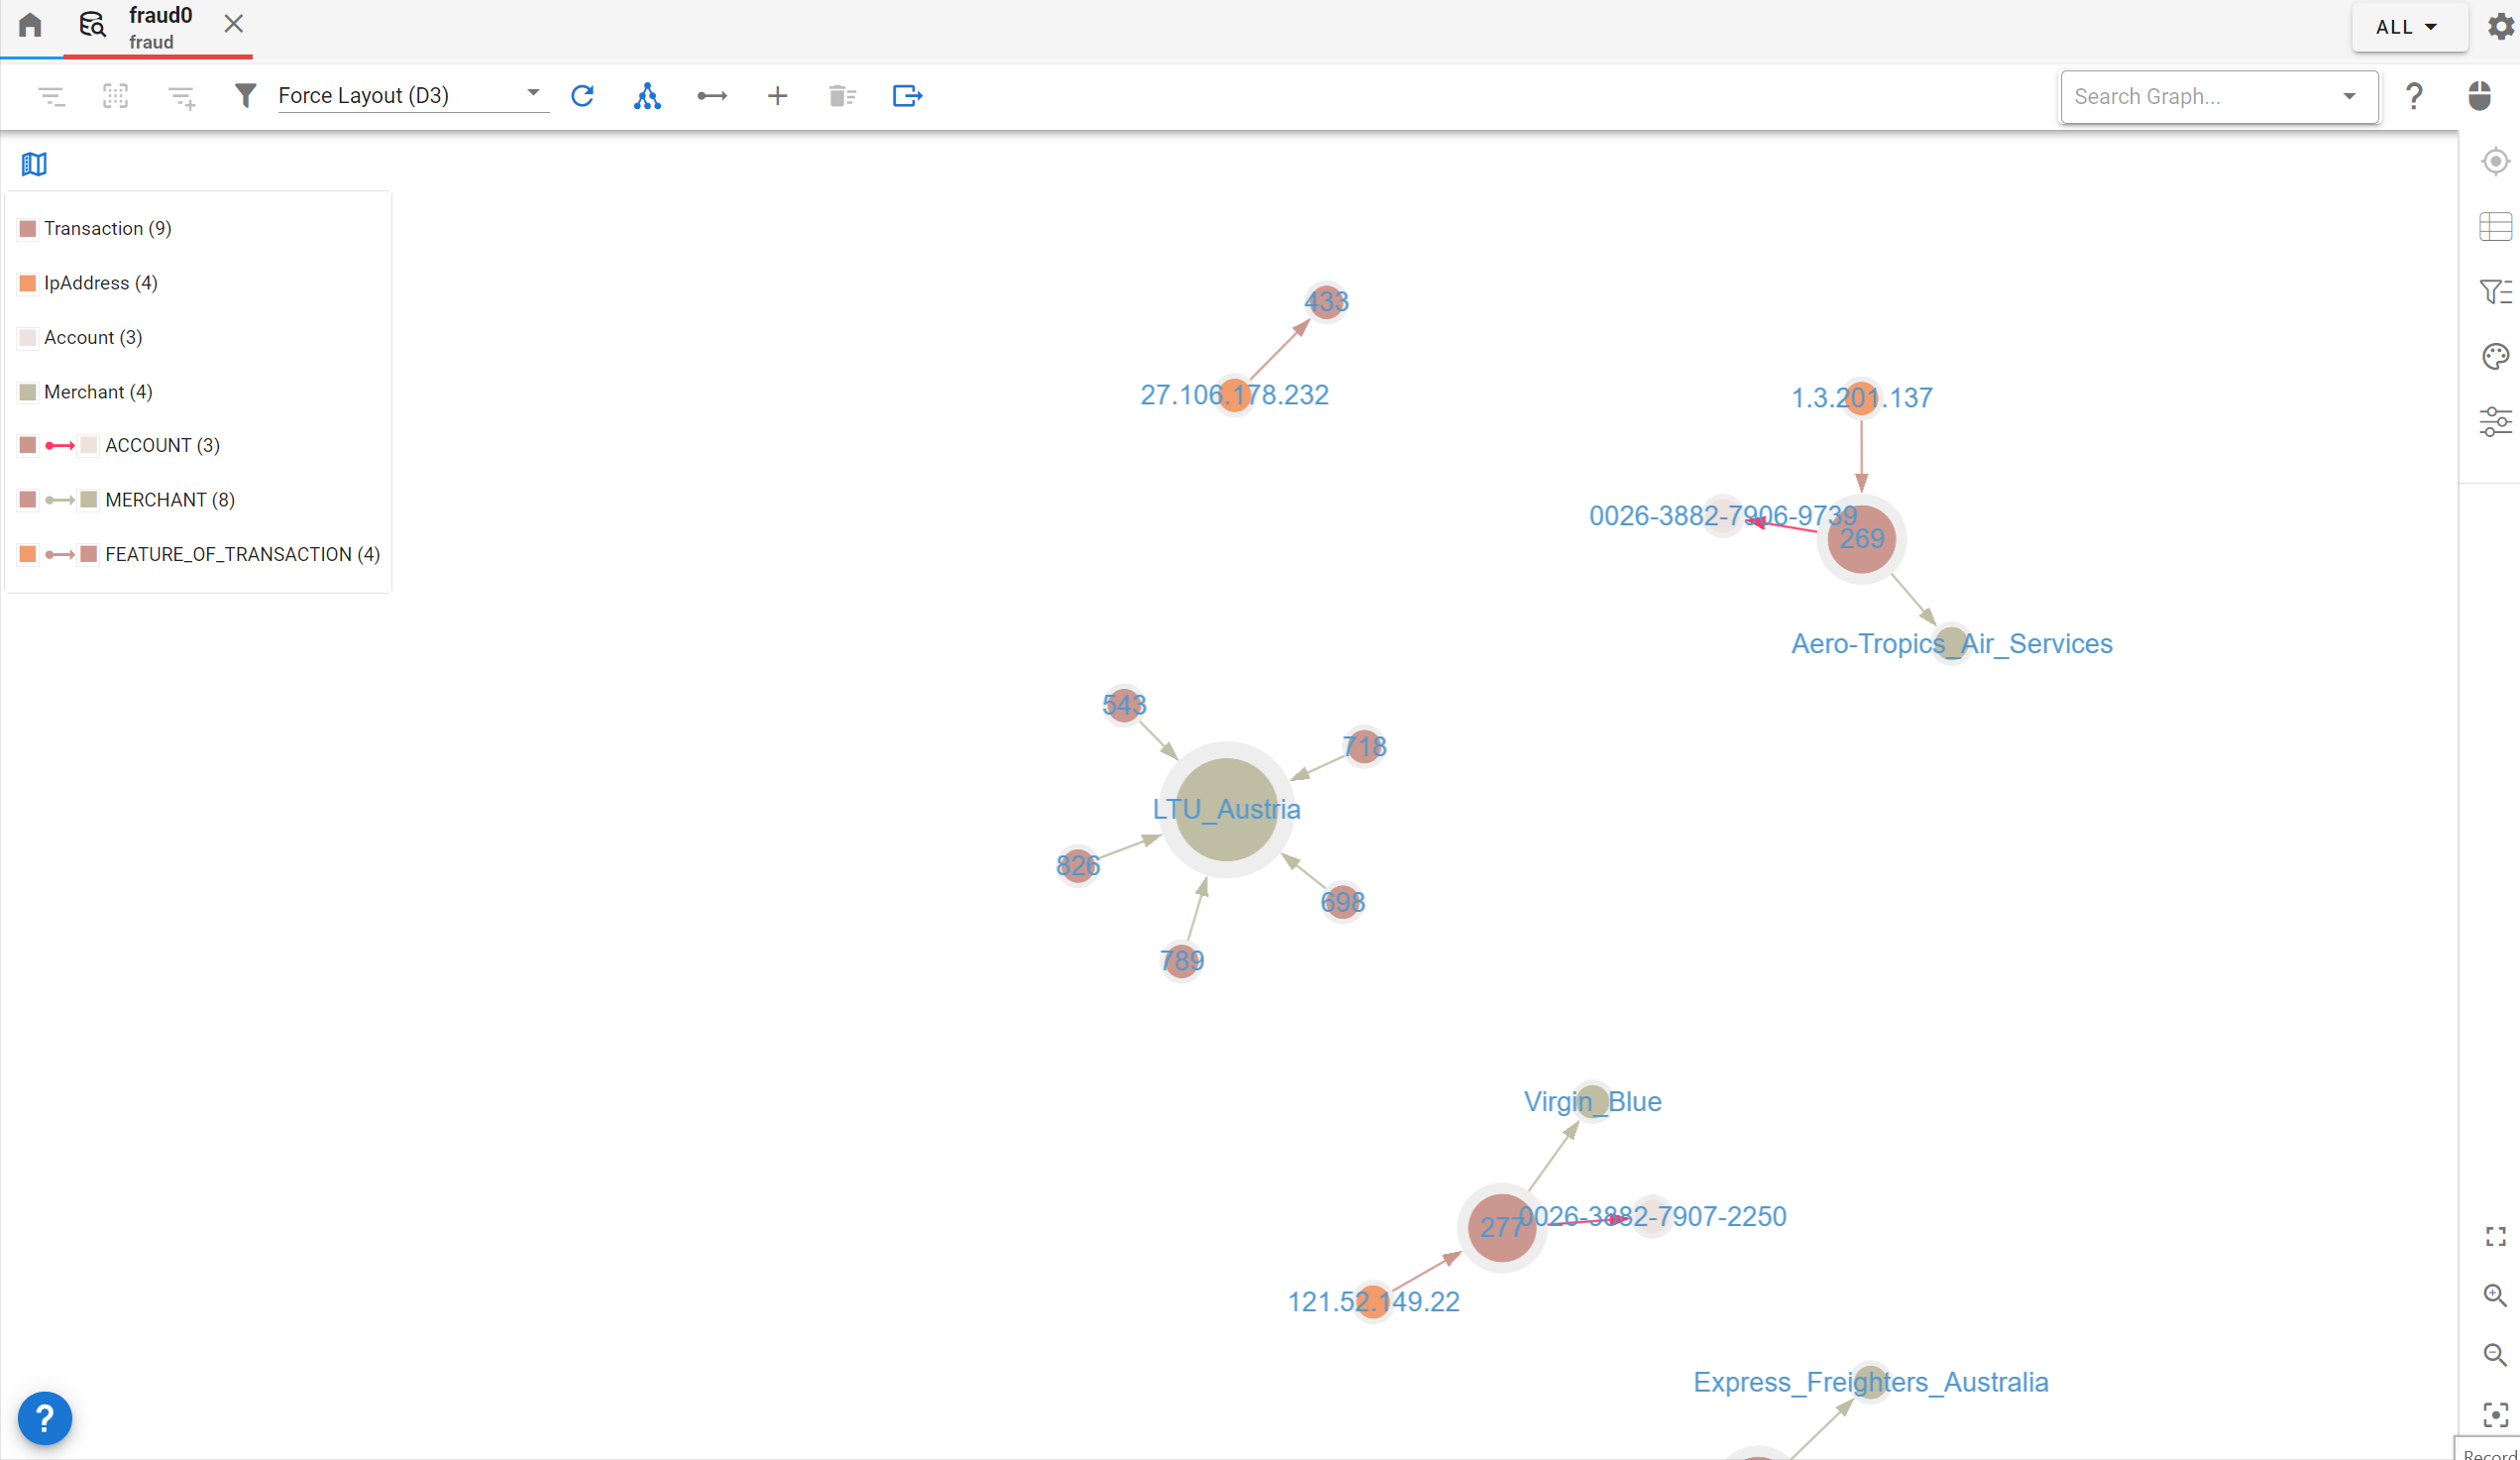
There’s a lot to cover here as far as G.V() is concerned and this deserves a separate article to really delve into the various options available and all the customization that can be configured directly. A couple small visualization examples were shown earlier that should give you a good idea of what to expect when starting to use our software.
One really important feature in G.V() that can sometimes be missing in other database IDEs is the ability to create, update and delete vertices and edges interactively. It’s a huge time saver to be able to maintain individual records without having to rely on writing entire queries. Despite most Apache TinkerPop Graph Systems having no data-schema constraints, G.V() will once again use its knowledge of your data to accelerate this operation. A picture (actually a GIF) speak a thousand words so once again, check out this quick demo:
Visually exploring graph data and modifying it interactively
Data Analysis and Reporting
G.V() bundles a number of features to help with Data Analysis, particularly leveraging our graph visualization engine. At time of writing we don’t have general reporting and graph analytics functionality to offer other than those you can run directly on your graph database. We do however have an upcoming graph analytics feature coming up before the end of the year providing access to various useful algorithms that can be run directly within the user interface – so keep an eye out on this space!
Graph Data Schema visualization and modelling
A core aspect of the G.V() software is how it builds an internal representation of your data schema that is then leveraged to power a number of UI features. Being able to quickly see the structure of your data is essential to understanding it and presenting it to others. That’s why we also offer a number of handy views to visualize your data model directly, such as our Data Model Editor, shown below:
An Entity Relationship visualization of one our graph database’s data schema
At time of writing most Apache TinkerPop Graph systems are schema-less, meaning that there is no form of data schema enforcement available (except for a rare few such as JanusGraph and DataStax Enterprise Graph). We’re keeping our eyes peeled for more and we’ll be keen to introduce more data model management functionalities in the future to support existing APIs such as JanusGraph’s as well as potential new ones!
Query Debugging and Profiling
Okay, now we’re getting to some truly unique functionality in G.V(). Typically when we think about debugging database queries, we mostly refer to profiling and query planning – not so much ACTUALLY debugging the query step by step and thread by thread.
So first of all and before anything else, G.V() does offer a lot of convenience features for Gremlin Query Profiling and Traversal Explanation generation, allowing you to get this information about your query in just one click. Additionally, we fully support provider specific functionality in that area such as Amazon Neptune’s Explain and Profile APIs.
But this is where things get really interesting – and you’ll not find this anywhere else – we provide real debugging tooling to simulate individual Gremlin traversals at any step of the query.
This feature deserves its own little deep dive post and we’ll not cover it here in too much detail but here’s a visual of it just to give you an idea of what it provides:
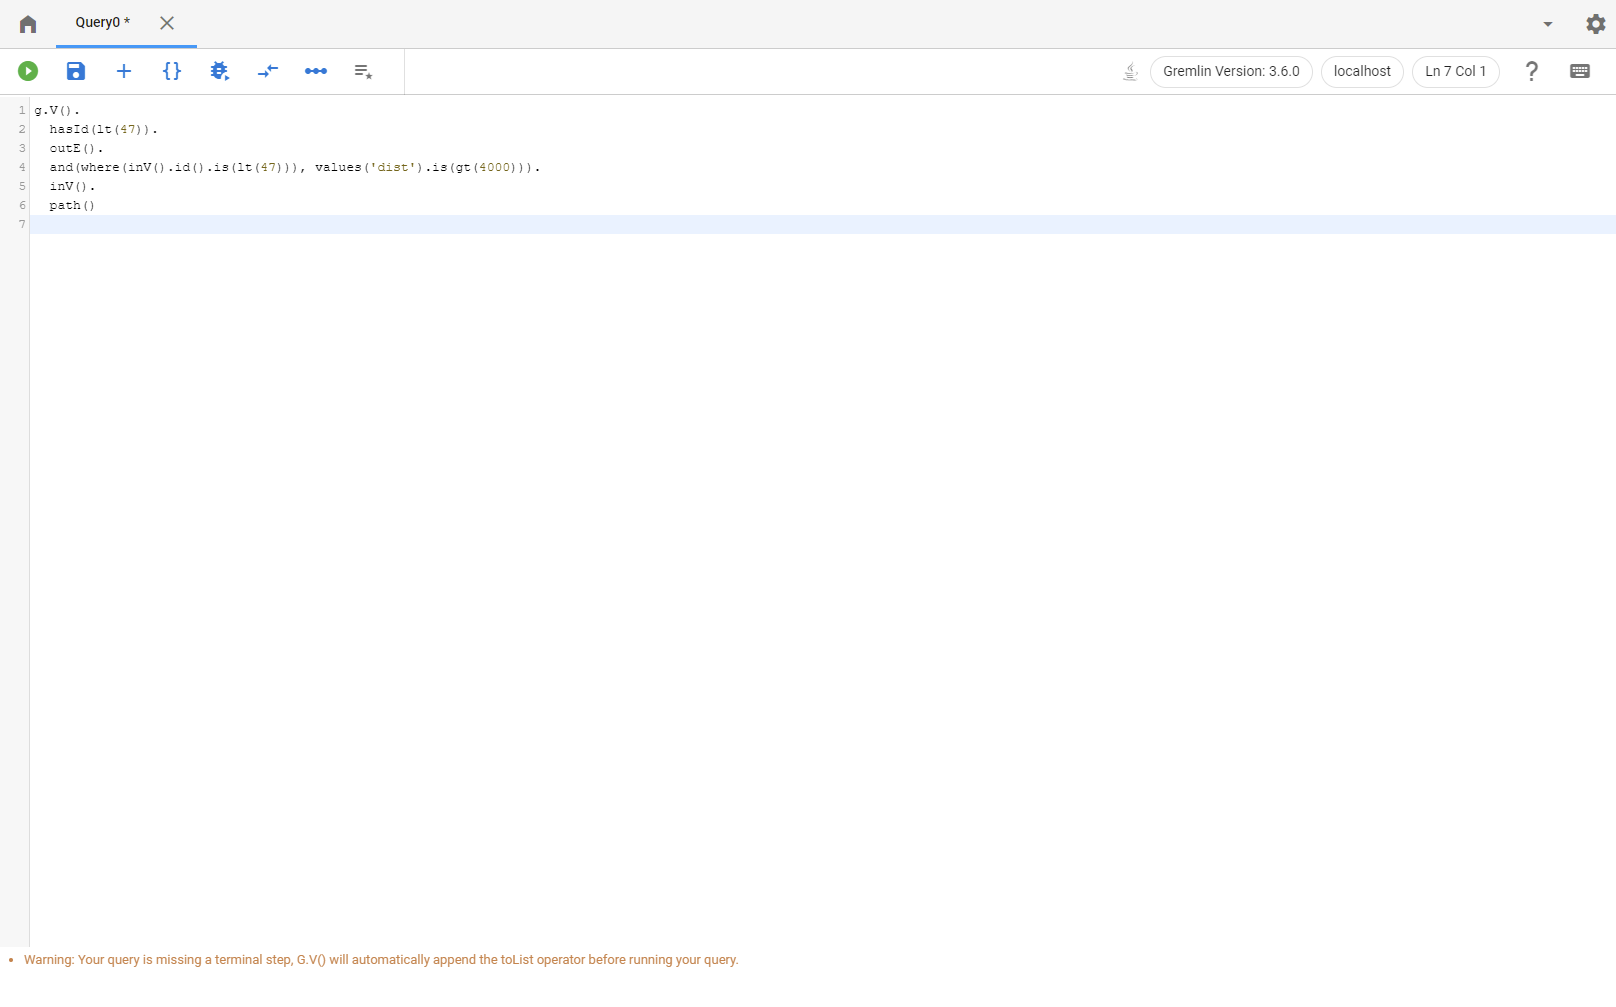
Stepping through a query with G.V()’s debugger and inspecting individual traversals step by step
We believe it is a feature unique to the Gremlin language itself and its ability to be broken down into clear steps, both within the query and for each traversal in the query. To put it short, you can’t break down a SQL statement such as:
SELECT * from person GROUP BY age
in SQL into multiple steps but looking at the Gremlin equivalent,
g.V().hasLabel(“person”).group().by(“age”)
you can clearly see the distinct steps of the query leading to its final result (person records grouped by age).
This allows to really dig deep into how Gremlin traversal works as well as troubleshoot queries that aren’t behaving as expected, say for instance due to a missing edge or property.
Secure and easy to install
G.V() is not a SaaS (Software as a Service) or PaaS (Platform as a Service) solution. That may sound like a step backwards in the evolution of software delivery. After all, we’re used to doing more and more directly on websites either deployed internally to our organizations or offered as an online service.
Here’s the thing – we’re connecting to databases, which will likely contain sensitive data that is owned by your organisation alone. We don’t want that going anywhere we don’t want to! Additionally, what’s more frustrating than wanting to get started with a solution but having to figure out how to deploy it, maintain it and monitor it before anything else?
G.V() is keeping things simple – it’s a software executable compatible with Windows, MacOS and Linux that you can simply install and get started with right away. The software runs locally on your device and network and is therefore not requiring your databases to be accessible outside of your network. Everything stays in your network and in your organisation without the need to navigate complex deployment scenarios or data privacy concerns.
Just download it for free, install it and you’re good to go!
In conclusion
G.V() is a continuously evolving software – we’ve put the Apache TinkerPop community’s feedback and interests at the centre of our solution’s design to help us shape it into a product that answers YOUR needs. Our aim is to deliver the best possible product to support and enhance the growing ecosystem of Apache TinkerPop Graph Systems. We believe we have the most comprehensive Gremlin IDE to date, and we’re going to keep adding more and more awesome features to help you make the best use of your time working with your graph database.
Whether you’re just getting started or already fully deployed with Amazon Neptune, Azure Cosmos DB, JanusGraph, and the many other graph databases we support, you must give G.V() a try!
We offer a free tier for our product and a no obligation trial for our more advanced features allowing you to get started right away with no overhead or complication. So what are you waiting for? Install G.V() now!
Did you find our article interesting? Have you got any thoughts? Give us a comment below!
If you wanna chat you can come find us over on Twitter, by email or on the Apache TinkerPop Discord Server (seriously, check it out, it’s great).
