EdTech Startup eLumen Uses G.V() to Increase Productivity & Improve Developer Experience
While working with Amazon Neptune, the eLumen team found Apache TinkerPop™ and the Gremlin query language had a high barrier to entry for developers unfamiliar with graph computing. Using G.V() helped new team members get up to speed quickly with existing traversals, visualize the problem domain, and drastically reduce ramp up time.


Joel Hernandez
“G.V() helps reduce the complexity of an increasingly complex technology stack. This decreases the time my team has to focus on learning peripheral technologies and gives them more time to focus on learning the things that matter most. The ROI was so transparently simple that it was such a quick decision.”
The Company
eLumen is an EdTech company focused on integrating curriculum and student learning outcomes in higher education. Founded in 2003 by academics at the University of Minnesota and the Minnesota State Colleges and Universities system (MnSCU), eLumen has since expanded to colleges and universities across the United States, empowering student success by helping students, educators, and administrators alike to track their progress and achievements toward a degree.
Graph Use Case(s): Knowledge Graph, Recommender System, Graph Analytics
Graph Technology: Amazon Neptune graph database
G.V() customer since June 2023
The Challenge
After 13 years of using a relational database (RDBMS), the eLumen legacy application kept running into hard performance limitations.
With nearly 50 GB of data per institutional customer and a sprawling set of table relations, it was difficult to model the fluid yet highly connected data structures ubiquitous in higher education. Making it more challenging was the fact that in the higher education space, curriculum mapping and assessment modeling datasets are both unstructured and highly connected.
CTO Joel Hernandez knew the eLumen team needed a new solution. After talking with other CTOs and innovators in the industry, it was clear to Hernandez that graph database technology was the future.
“It’s what graphs are good at: how things are connected one to another,” said Hernandez. “We wanted to build for the long term, not just today.”
As an AWS Public Sector Partner, the eLumen team decided to use the Amazon Neptune graph database as part of their new software architecture. Across their 64+ rapidly growing customer base, each institution is partitioned as a tenant on the graph typically at a scale of tens of millions of elements per tenant. The eLumen team inspects every customer’s graph on a weekly basis to check the state of the graph and to compare it against the product roadmap.
The problem: Most employees who’d been working with Amazon Neptune had been there since the beginning of the project. While they knew how to work with the graph database, it was difficult to train new employees or to demonstrate it to non-technical stakeholders.
The eLumen team tried visualizing the data via Jupyter notebooks, but the capabilities were limited and quickly hit performance challenges. Given that there is no default user interface for Apache TinkerPop™ or the Gremlin query language, they needed another tool to help them visualize and explore their graph data.
That’s when they found G.V().

The Solution
“The decision to use G.V() was easy,” said Hernandez. “It all came down to developer experience.”
As CTO, Hernandez said he’s always encouraging his team to find and use tools that make them more effective, and G.V() fit the bill.
For both new and experienced developers, Apache TinkerPop™ had an especially sharp learning curve and presented a high barrier to entry, but using G.V() was the opposite: quick to learn, intuitive to use, and with a low barrier to entry.
Finally, G.V() was affordable for anyone on the eLumen team who needed a license, so cost was never a concern.
“The ROI was so transparently simple that it was such a quick decision,” said Hernandez.
The Results
Using G.V() reduced the time needed to run daily graph inspections in multiple ways. First, G.V() outperformed the speed and data scale of using a Jupyter notebook. Second, it was easier to use. New eLumen employees didn’t need extensive experience with graph technology or the Gremlin query language.
“They could usually complete any query or solve any problem with just a few clicks,” said Hernandez.
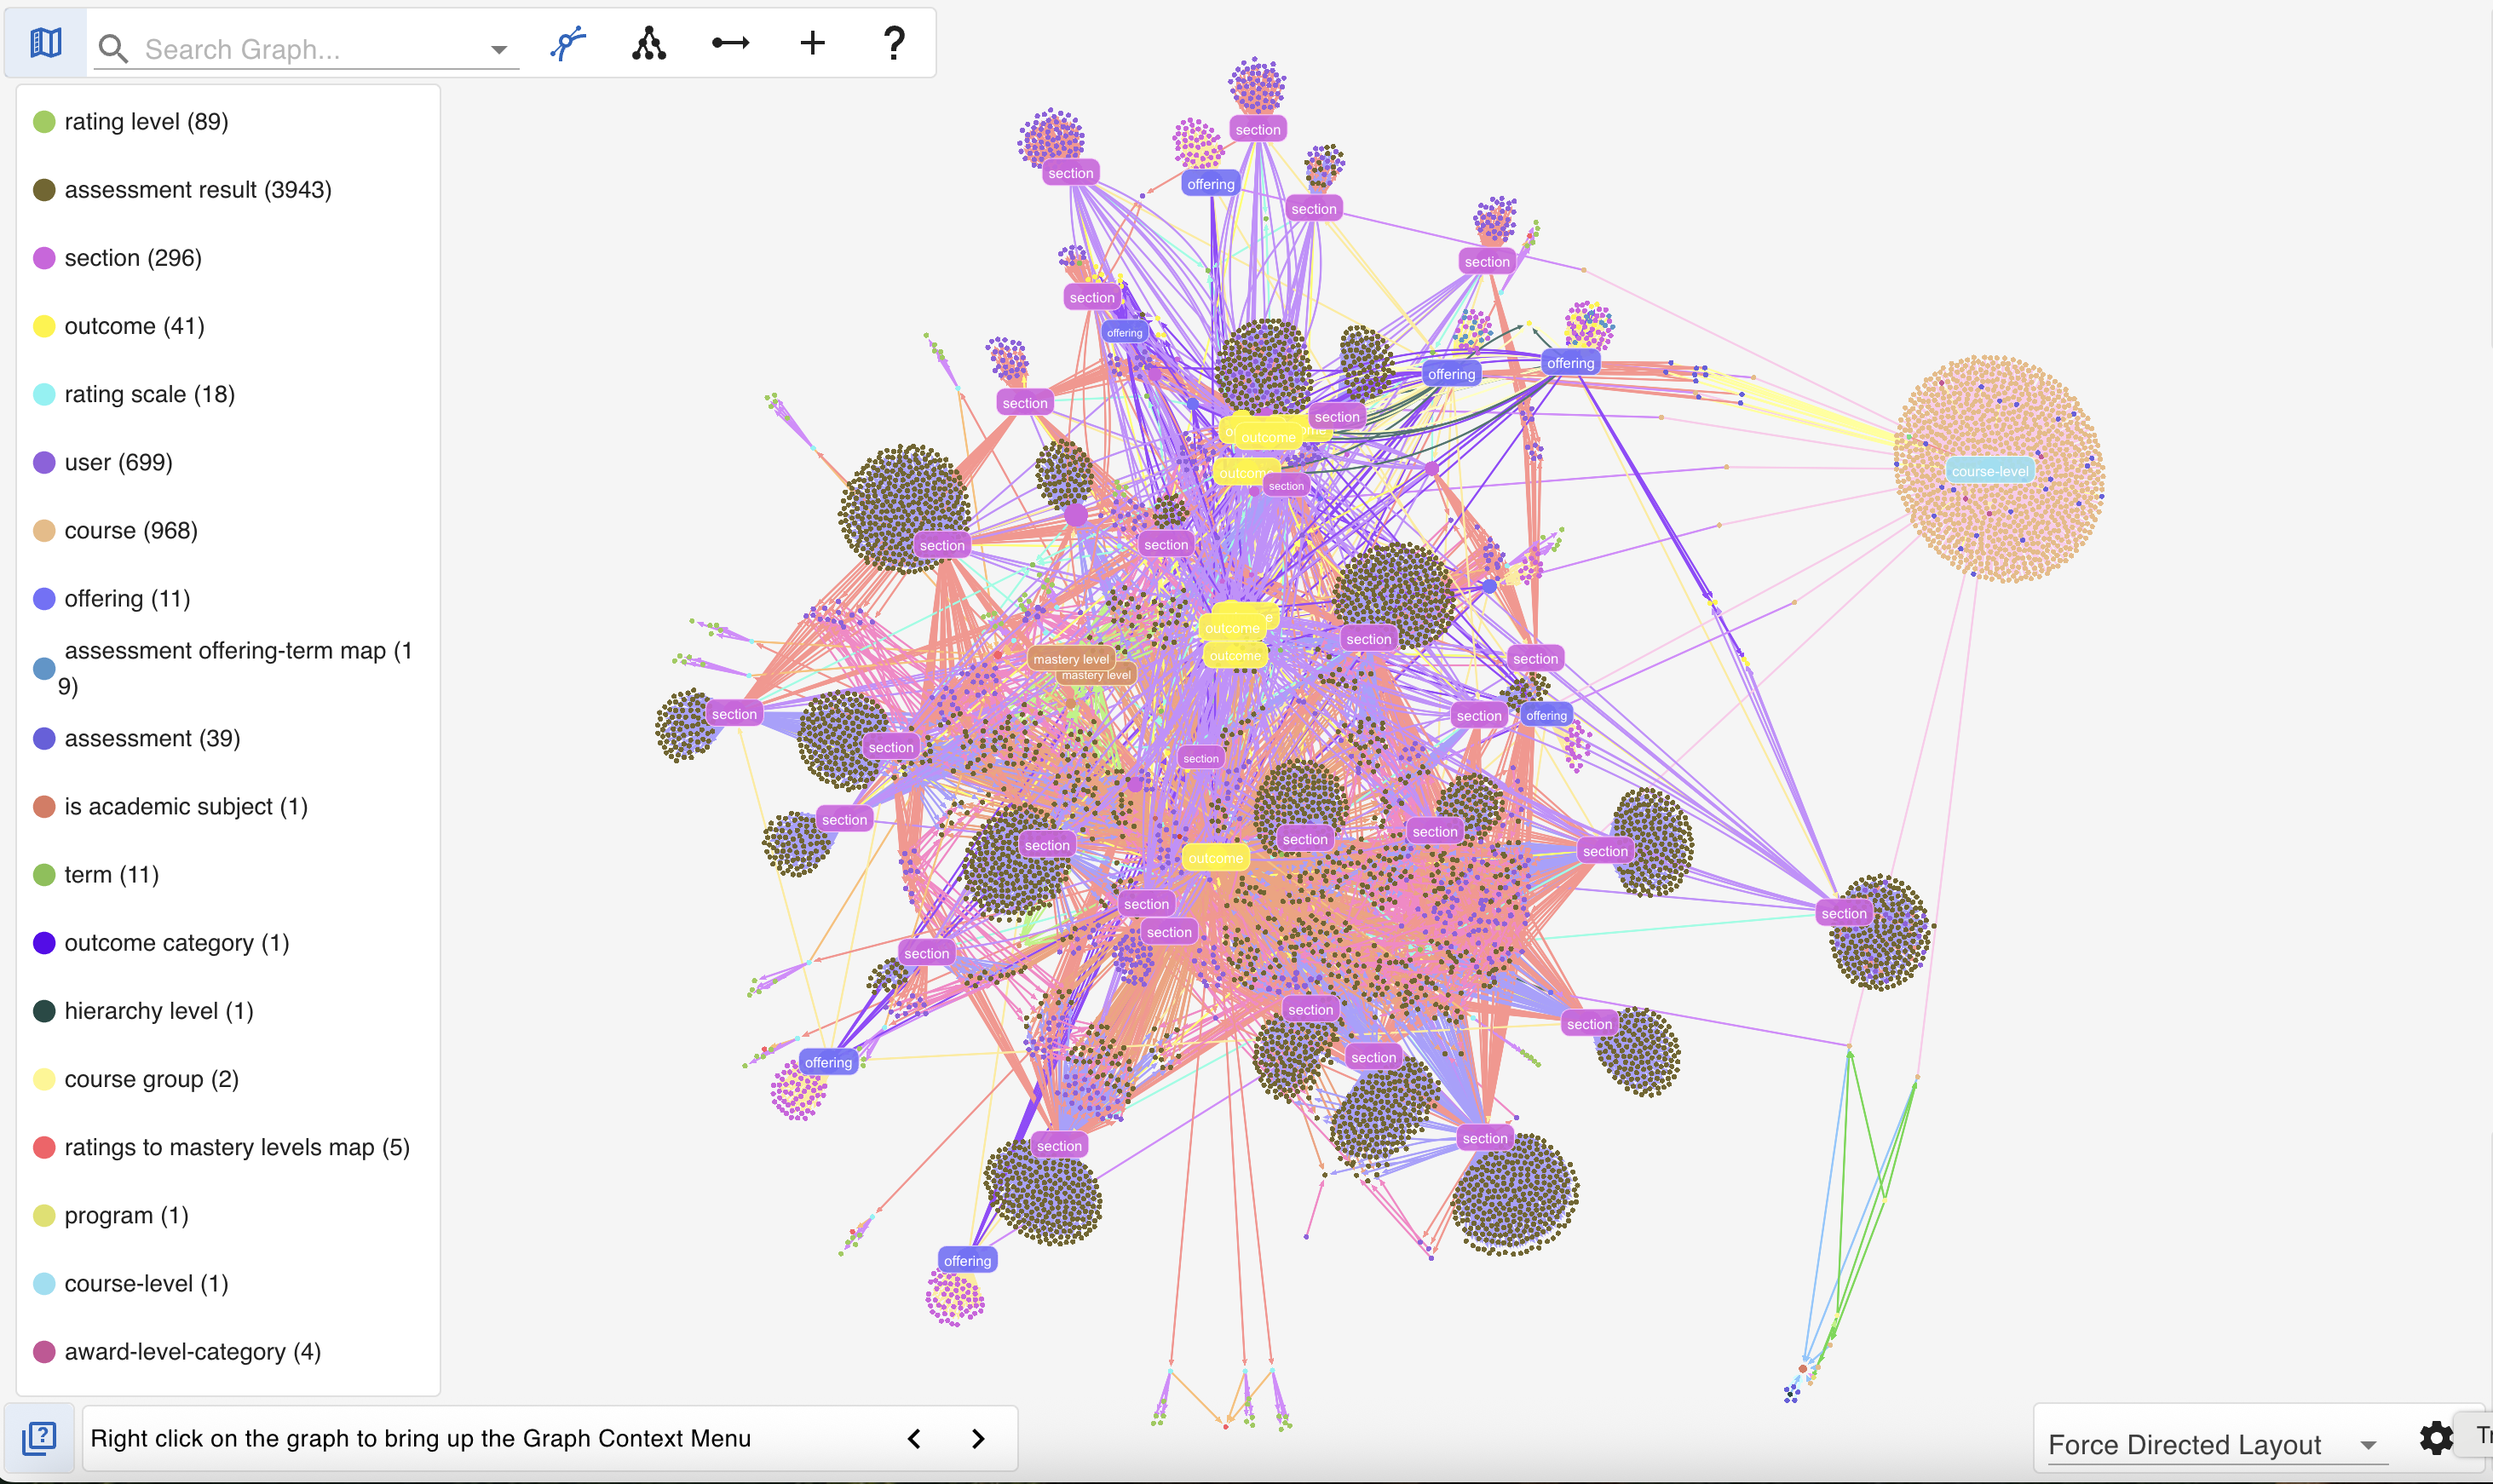
The eLumen team quickly found multiple more uses for G.V(), including troubleshooting Gremlin queries, reporting on database metrics, and tweaking data interactively. Furthermore, G.V()’s high-performance graph visualization was helpful for daily inspections and larger investigations. And the data schema loading and visualization in G.V() made it easier for the eLumen team to enforce the schema of their graph database.
“G.V() helps reduce the complexity of an increasingly complex technology stack,” said Hernandez. “This decreases the time my team has to focus on learning peripheral technologies and gives them more time to focus on learning the things that matter most.”
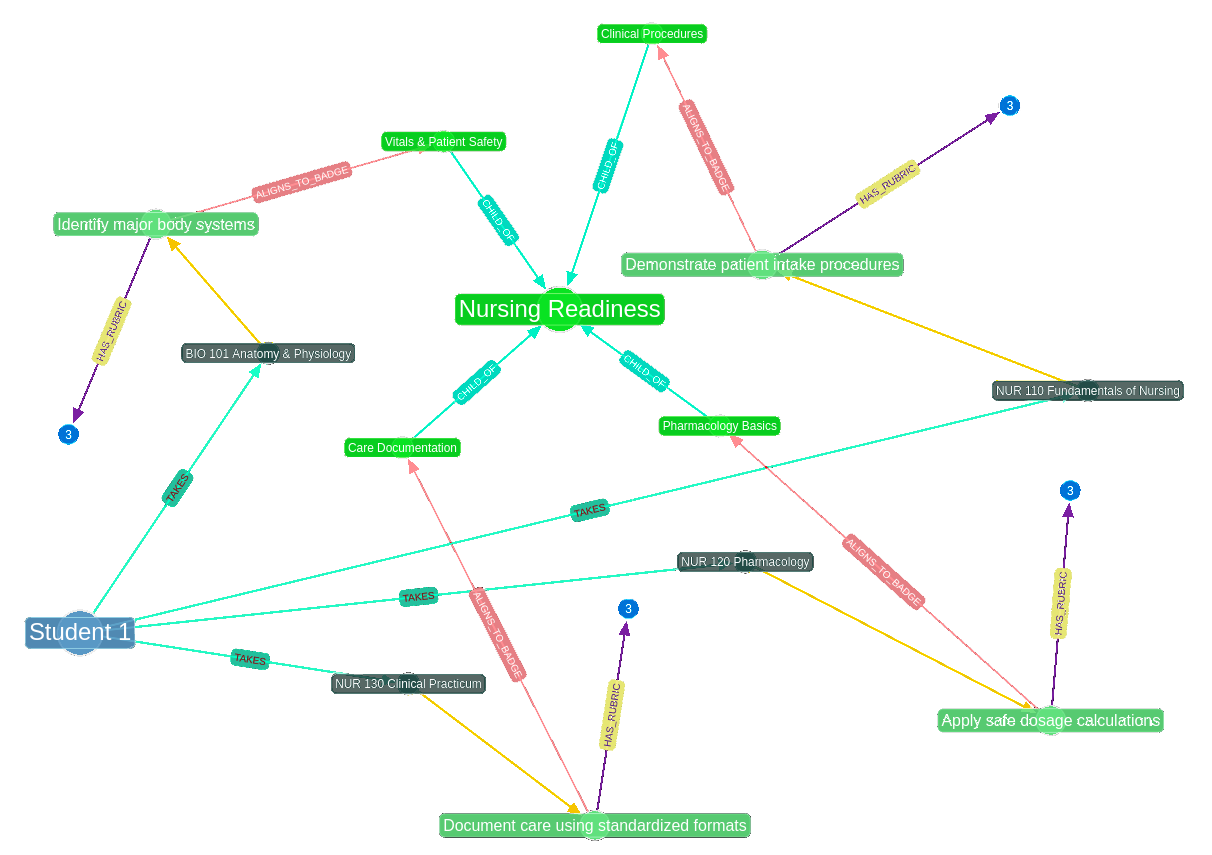
Today, the eLumen team hosts an internal company demo at the end of every sprint to illustrate new product features to their sales, support, and product teams. G.V()’s graph visualizations help illustrate these new features to less technical team members who struggled to understand the JSON documents presented in the past. As a result, internal product knowledge and team communication have improved.
In the future, the eLumen team has plenty more uses for G.V() planned in tandem with their product roadmap. First, they plan to use graph visualization externally with customers to help students and educators visualize a learning path through a given degree or program. Second, as eLumen signs on more customers, they plan to implement more graph machine learning via Neptune Analytics, with G.V() providing the visualizations for graph algorithms such as pathfinding and community clusters.
Most importantly, Hernandez noted that G.V() contributed to his long-term goal of employee happiness and retention – of which developer experience is a critical component.
“At eLumen, we’ve had extremely low voluntary turnover in the history of the team,” said Hernandez. “G.V() has just made the developer experience a million times better.”
Built to Help Your Graph Developers Succeed
G.V() is a cost-effective solution to make database development and management on Amazon Neptune easily accessible.
Our small, dedicated team strives to create the best graph database client through user collaboration and feedback — so if you have any valuable input, or want to let us know more about your use case, please reach out at support@gdotv.com.
If you’re interested in testing this graph database client and IDE for Amazon Neptune, give G.V() a try. You’ll be up and running in just a few minutes.
Transform the way you work with graph databases: Download and trial G.V() for up to a month – for free – today.

