Google Cloud Spanner Graph IDE
& Graph Visualization Tool
Explore, query and visualize your graph data in Google Cloud Spanner Graph with gdotv.
A Purpose-Built IDE for Google Cloud Spanner Graph Developers
Spanner Graph brings the native graph database experience to Google Spanner’s well-known scalability and consistency. Powered by GQL, Spanner Graph offers intuitive database pattern matching, relationship traversals, and filtering capabilities to graph-based applications, like social networking, fraud detection, and product recommendation engines.
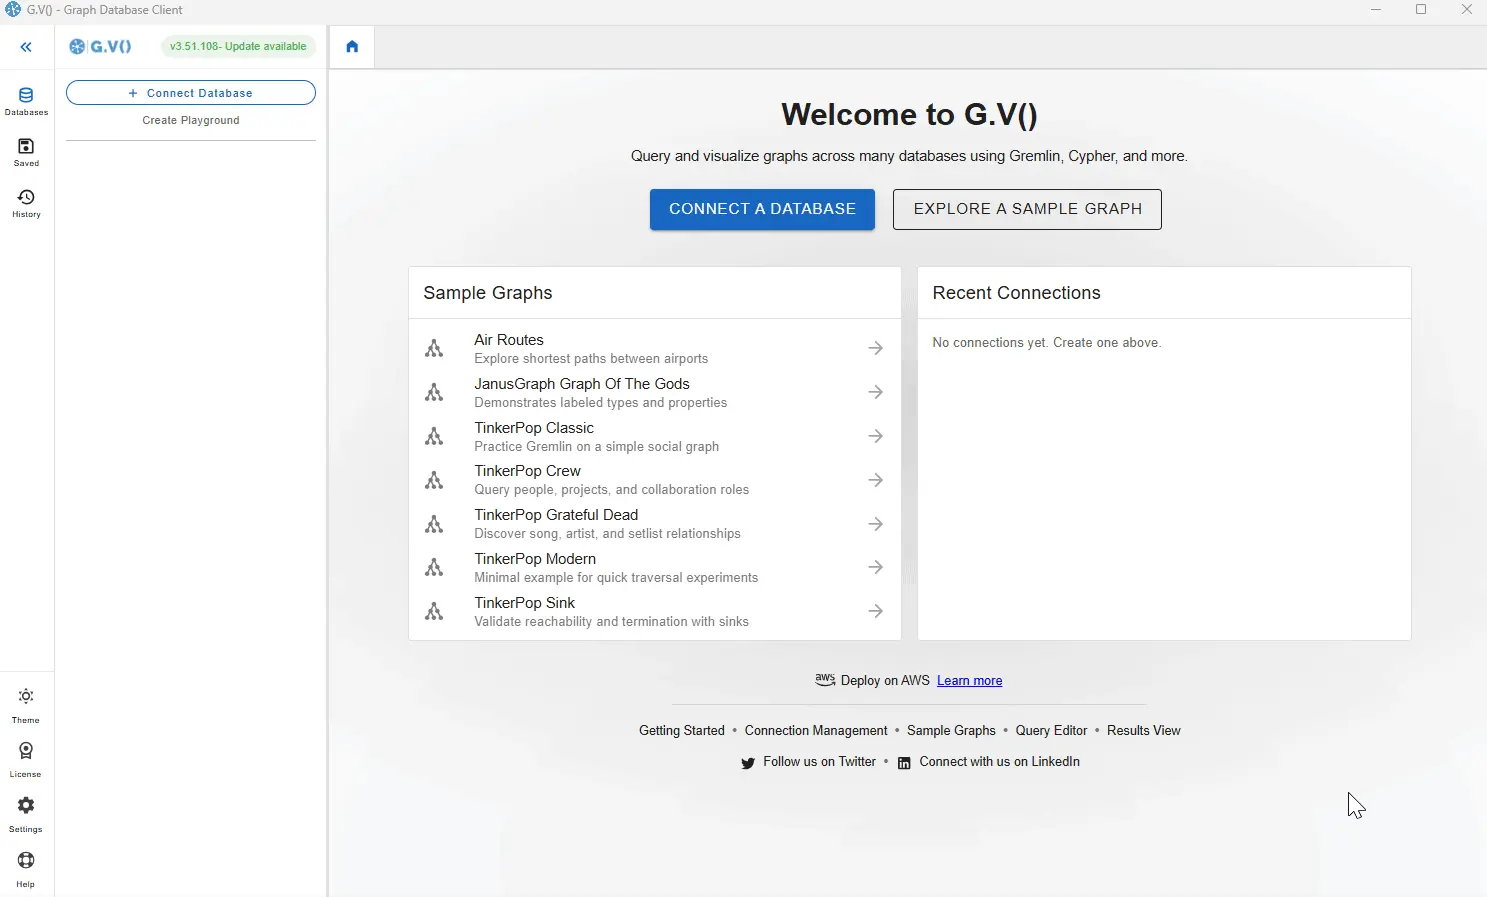
gdotv is a graph database client specially built with a comprehensive suite of tools to query and investigate connected data in Google Spanner Graph. It’s quick to set up and easy to use, turning database queries into interactive graph visualizations instantly. Whether you’re a developer, a data scientist or a business analyst, you’ll derive insights from your data effortlessly with gdotv.
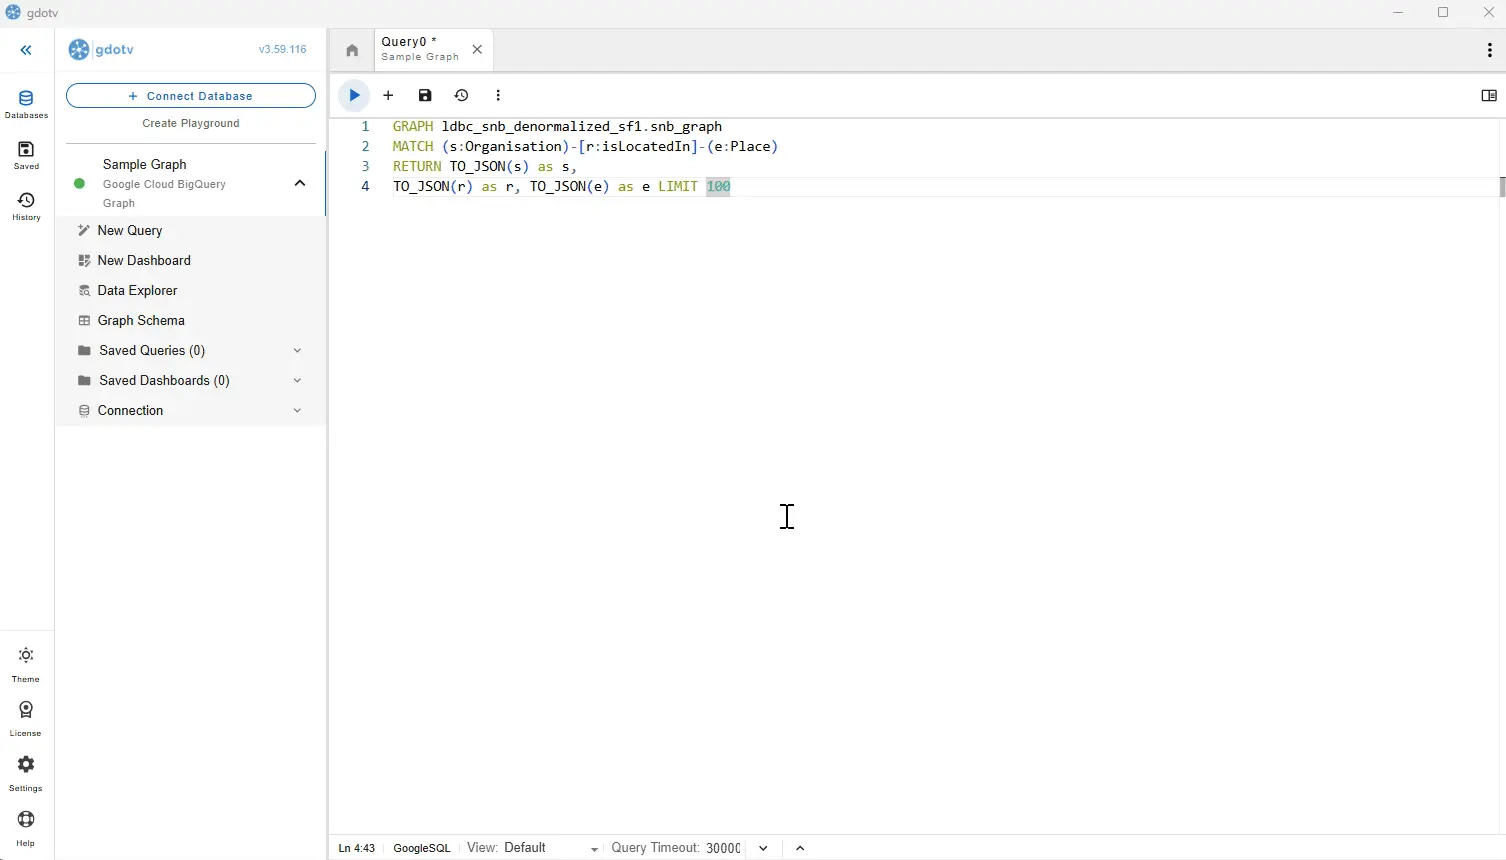
In Spanner Graph, you can write and execute GoogleSQL queries, then visualize their results across a variety of formats, suited both to graph and relational data outputs. gdotv streamlines day-to-day graph data tasks, with a wealth of Integrated Development Environment (IDE) features. Using the gdotv graph database client ensures you get the most out of your data and your time.
![]() Google Cloud Spanner Graph
Google Cloud Spanner Graph
Google LLC, Alphabet Inc.
Query languages supported by gdotv: GoogleSQL
Learn more about Google Cloud Spanner Graph

An Overview of Google Cloud Spanner Graph
Spanner Graph delivers predictable single-digit millisecond latencies, near-unlimited scalability, and a five 9s availability SLA. It also provides strong consistency and ACID transactions. Spanner’s multi-model capabilities encompass most major database use cases with support for the following storage models:
- Relational
- Key-value
- Graph
- Vector

All these features enable you to optimize database operations, derive deeper insights from your data, and create more resilient, scalable applications.
Spanner Graph is compatible with the GoogleSQL language which encompasses relational and graph querying use cases, by combining the syntax of the standard SQL, GQL (Graph Query Language), and SQL/PGQ languages. With the strengths of SQL and GQL put together, you can query relational and connected data in a single operation.
What’s Possible with Google Cloud Spanner Graph + gdotv
Easy Installation & Setup
Effortlessly integrate gdotv with your Google Cloud Spanner Graph graph database with a simplified plug-and-play database connector. The gdotv database client provides straightforward database connection and configuration instructions to get you started in less than a minute.
This Spanner Graph IDE is available to download for Windows, macOS, and Linux with a one-click installer to get you started instantly.
Centralized Connection Management
gdotv can be used to query and compare data from a huge range of graph database vendors – simultaneously! We don’t just work with Spanner Graph: gdotv data visualization tools fully integrate with various other graph technologies, including all Apache TinkerPop™ compatible graph databases and most LPG and RDF providers.
gdotv is fully compatible with query languages like Gremlin, Cypher, Google SQL, SQL:2023, SPARQL and more. Using an intuitive UI, you can switch between your connections and queries seamlessly.
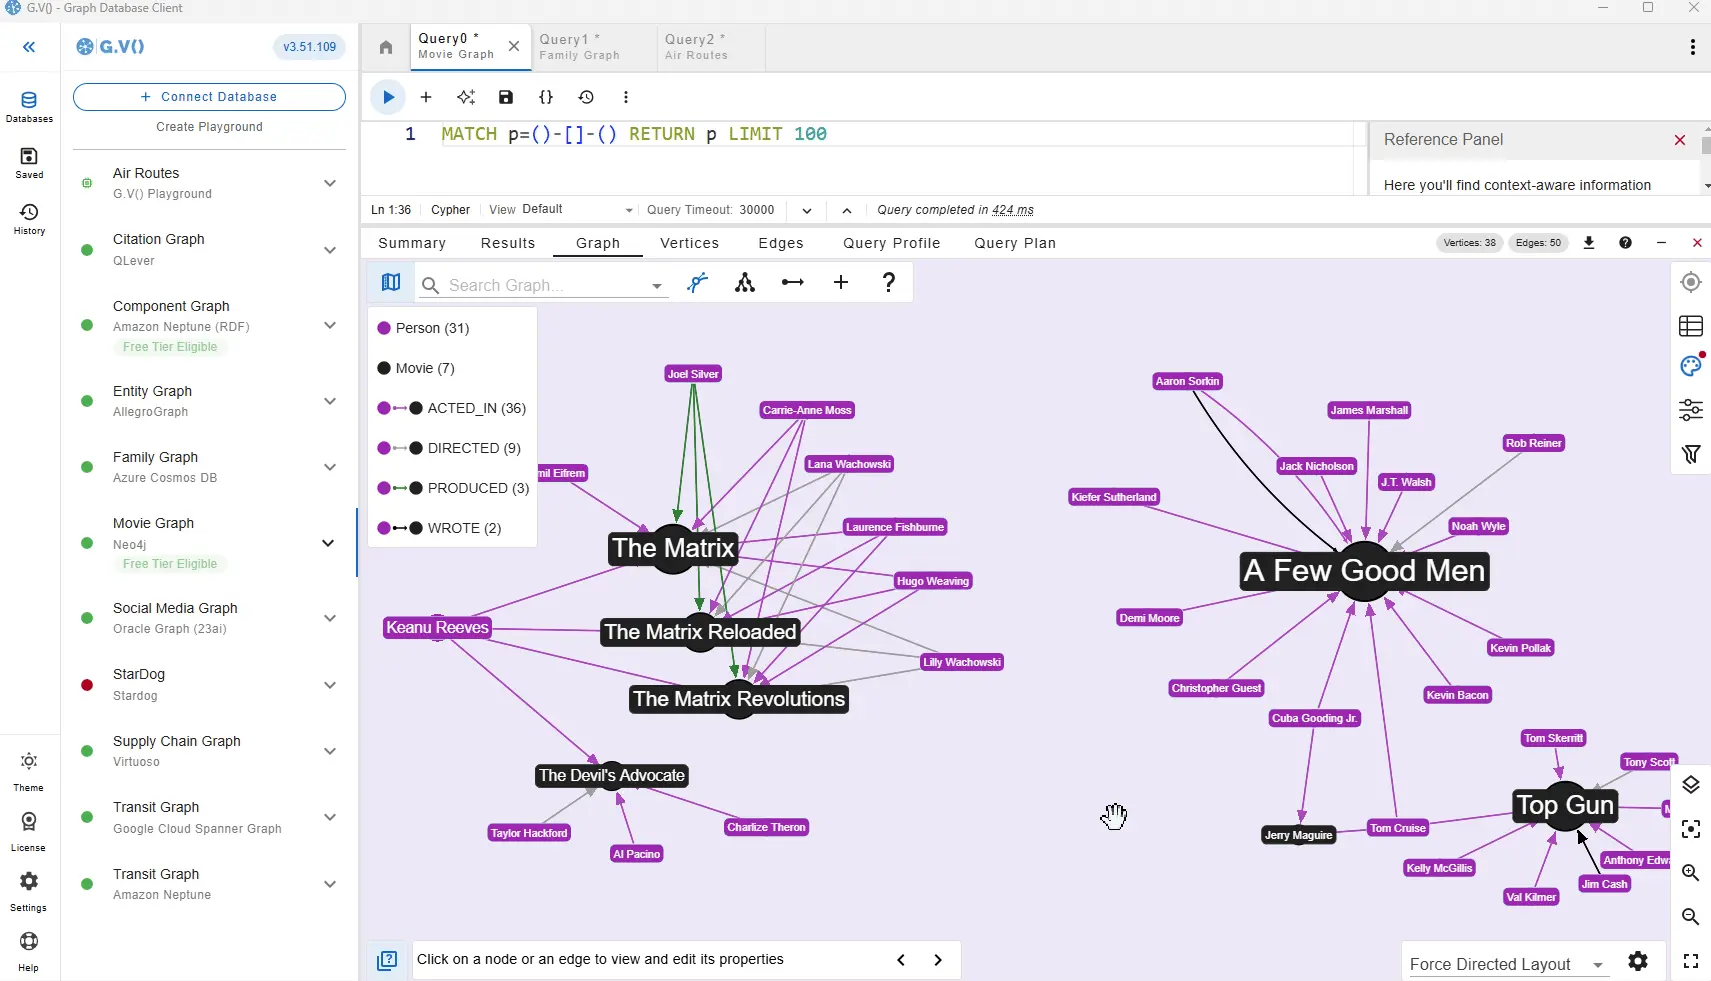
Customizable Data Visualization
You can create custom visualization rules for your Spanner graph database with gdotv to determine the look and feel of your data.
The gdotv database client boasts easy-to-configure style options that you can use to customize vertices and edges based on their labels and property values.
You can choose any color, size, or background image and adjust other elements to match your preference.
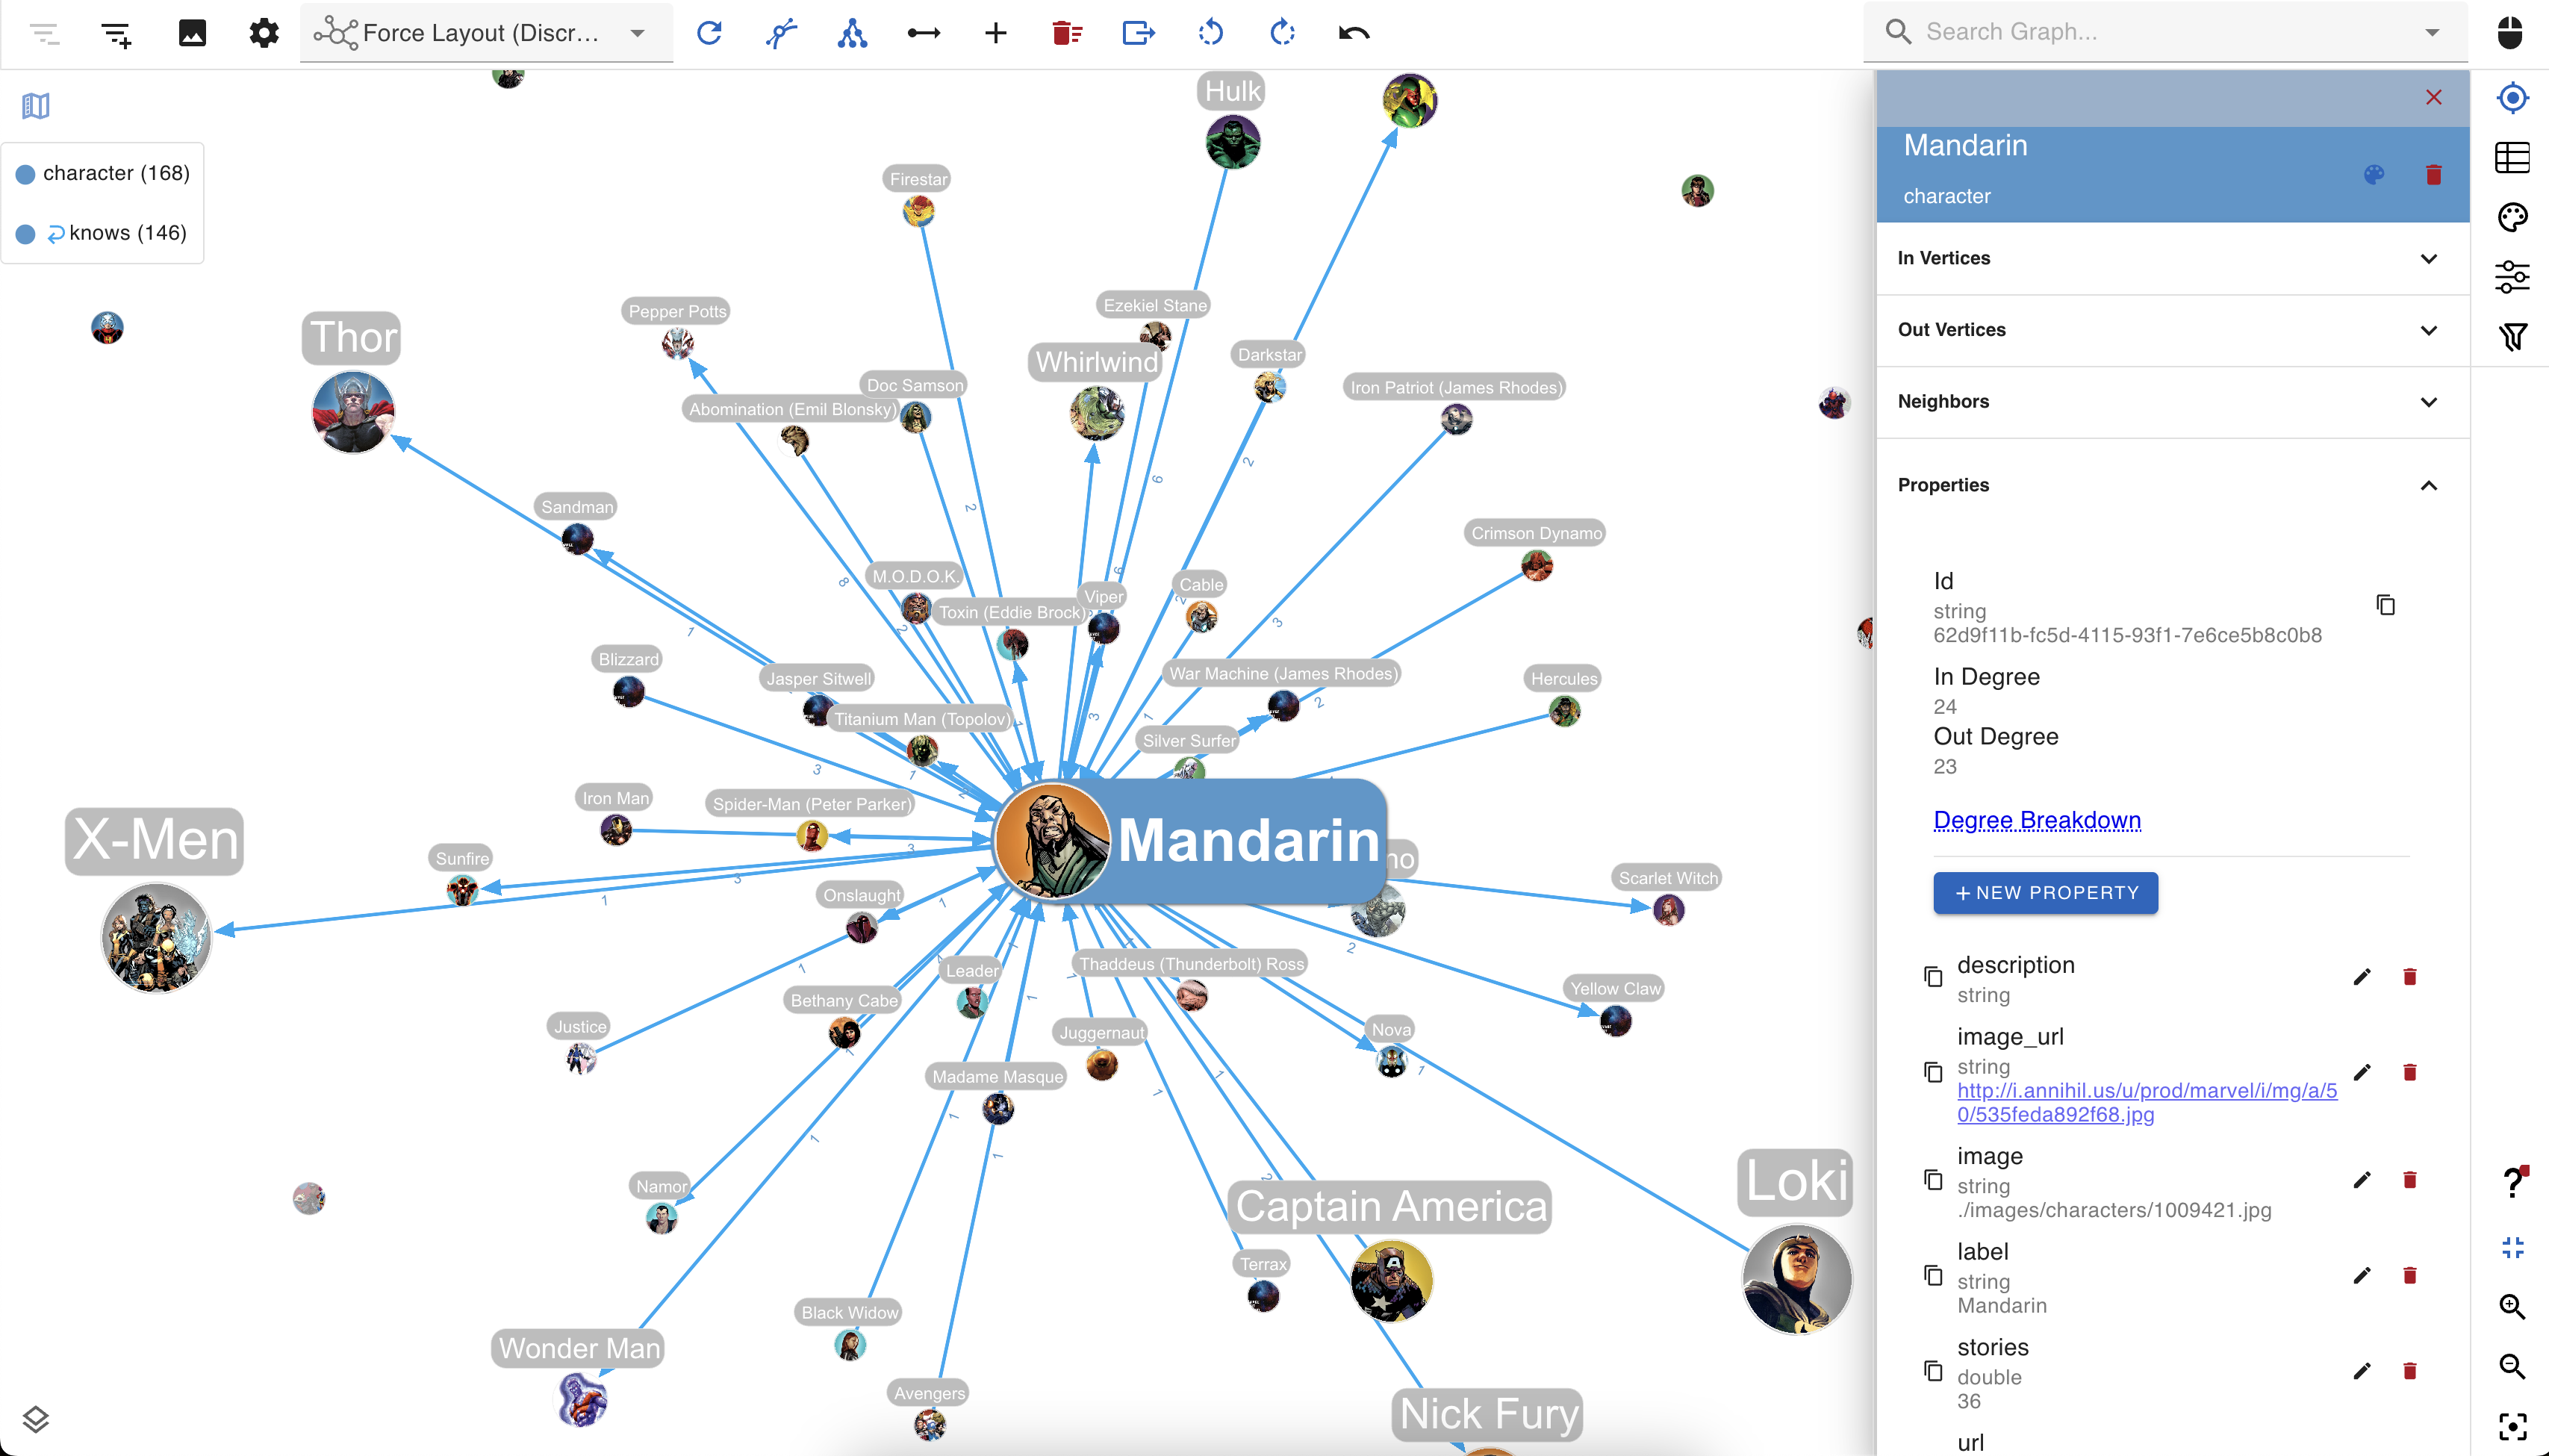
No-Code Data Exploration with the gdotv Graph Data Explorer
Use the built-in gdotv Graph Data Explorer to navigate your Google Cloud Spanner Graph data without using queries.
The Graph Data Explorer allows you to define path patterns to query from your data, using filters on both your vertices and edges. Elements in the declared path can be filtering according to their label, direction, and property values, allowing you to perform complex path pattern searches with no code.
Instantly Load & View Your Data Model
It’s always important to understand and verify your data schema.
This is why gdotv provides an overview of your data structure with the data model view. For Google Cloud Spanner Graph, there are two methods to construct the data model. The first is that gdotv is able to directly retrieve the model, if available, using the Google Cloud Spanner Graph Schema API.
Otherwise, gdotv can construct the data model directly from your data itself. This is always just a click away, meaning that you always have a bird’s-eye view of your vertices, edges, and properties right at your fingertips.

Take Advantage of Syntax Validation
Using gdotv language highlighting and syntax checking for GoogleSQL makes your code easier to understand and visually parse, warning you of any error that would prevent it from executing against your Google Cloud Spanner Graph instance.
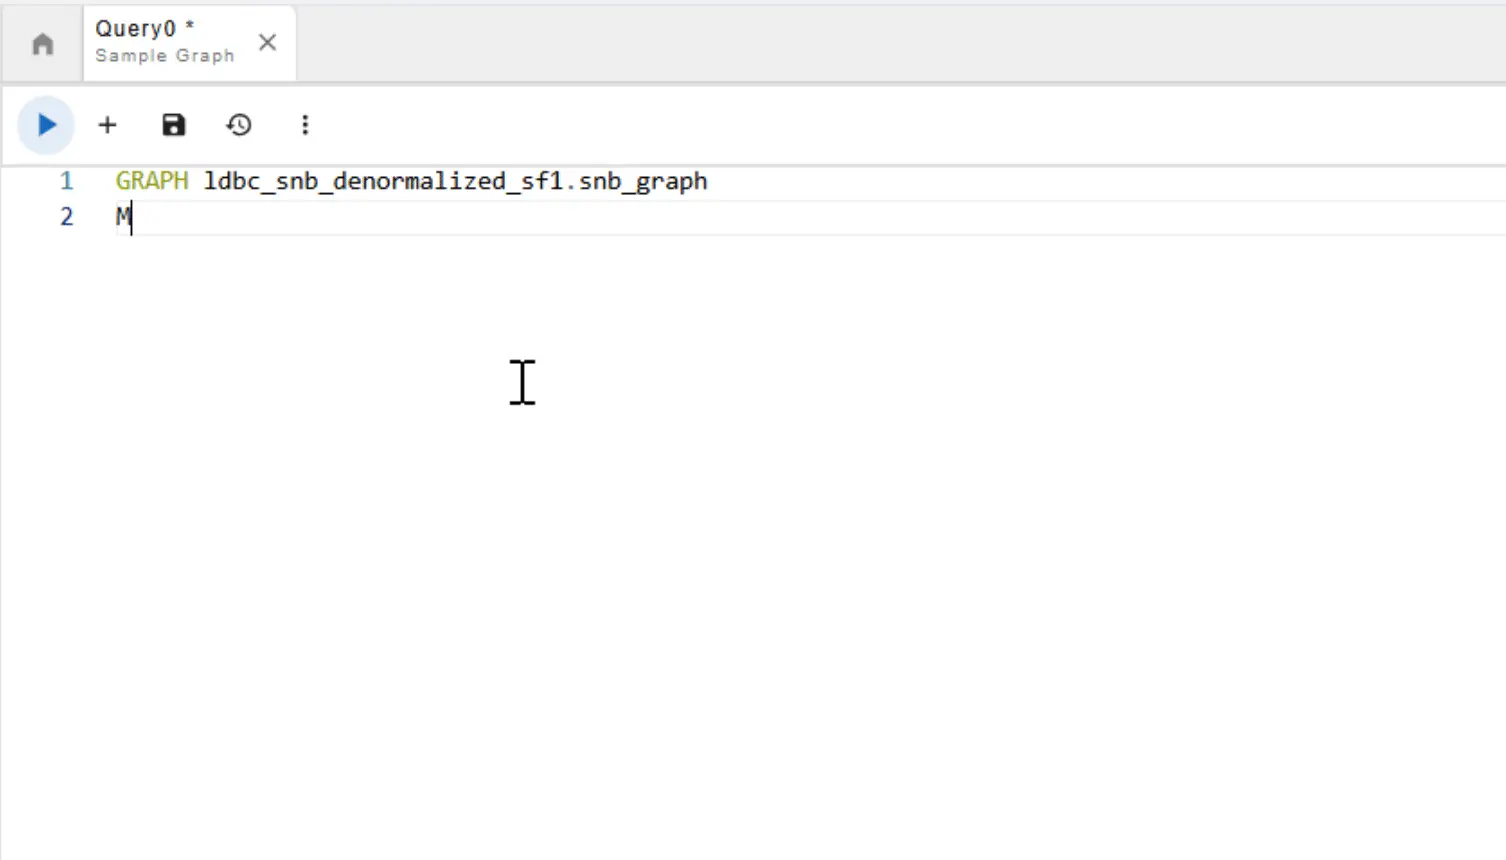
State-of-the-Art GoogleSQL Editor
The gdotv GoogleSQL code editor is the most powerful available – it offers data schema-accurate auto completion and embedded official documentation for GoogleSQL to give you all the information and suggestions you need to write your Google Cloud Spanner Graph queries faster and more effectively.

Google Cloud Spanner Graph + gdotv Blog Posts
![Introducing Support for Apache HugeGraph, GoogleSQL, SHACL Constraints, & More [gdotv v3.59.116 Release Notes]](https://gdotv.com/wp-content/uploads/2026/04/shacl-constraints-ontology-apache-hugegraph-google-sql-gdotv-release-1024x535.jpg "Introducing Support for Apache HugeGraph, GoogleSQL, SHACL Constraints, & More [gdotv v3.59.116 Release Notes]")
 Brings Interactive Graph Visualization To Google Cloud’s Spanner Graph")
Frequently Asked Questions (FAQs)
gdotv: The Google Cloud Spanner Graph IDE
Turn your graph data into connected insights when you use gdotv to query, explore, and visualize your Google Cloud Spanner Graph graph database.
Sign up for a free trial today and discover how gdotv amps up your productivity as the perfect Google Cloud Spanner Graph IDE and graph visualization tool.
Or, prefer to talk with the gdotv team directly? Use the form below to get in touch.