Aerospike Graph Visualization Tool
Query, visualize and edit your graph data with G.V() — the recommended partner solution for Aerospike Graph.
Overview
Aerospike is a multi-model, NoSQL database with a unique architecture that can store petabytes of data and serve millions of transactions per second. It also boasts the following benefits:
- Highly scalable
- Low cost of ownership
- Developer-ready
- Easy to program
- Real-time data access
Aerospike Graph is part of this multi-model offering and delivers milliseconds response for multihop queries, even for graphs scaling in the billions of elements. It launched with G.V() as its recommended graph visualization software. To make the best of Aerospike Graph and G.V(), we offer a combined 60 days free trial of both solutions.
Using G.V(), easily connect to your Aerospike Graph database, then perform essential day-to-day graph database development and management tasks such as:
- Write and run Gremlin queries with our smart editor, then analyse the results using various visualization formats
- Discover and visualize your graph data schema
- Import and modify data interactively
- Debug, profile and optimize queries
Purpose-built for Aerospike Graph Database
G.V() is a powerful data visualization tool designed to enhance how you interact with and visualize your Aerospike Graph data. It is simply the best way to get started with graph databases, and to perform data analysis and visualization on a production deployment of your graph data.
Our interactive graph visualization tool brings you the following features:
Market leading code editor
Our code editor makes writing Gremlin queries a breeze, offering you real-time autocomplete suggestions, syntax checking and official Gremlin documentation displays, so you can access all the information you need in one place.
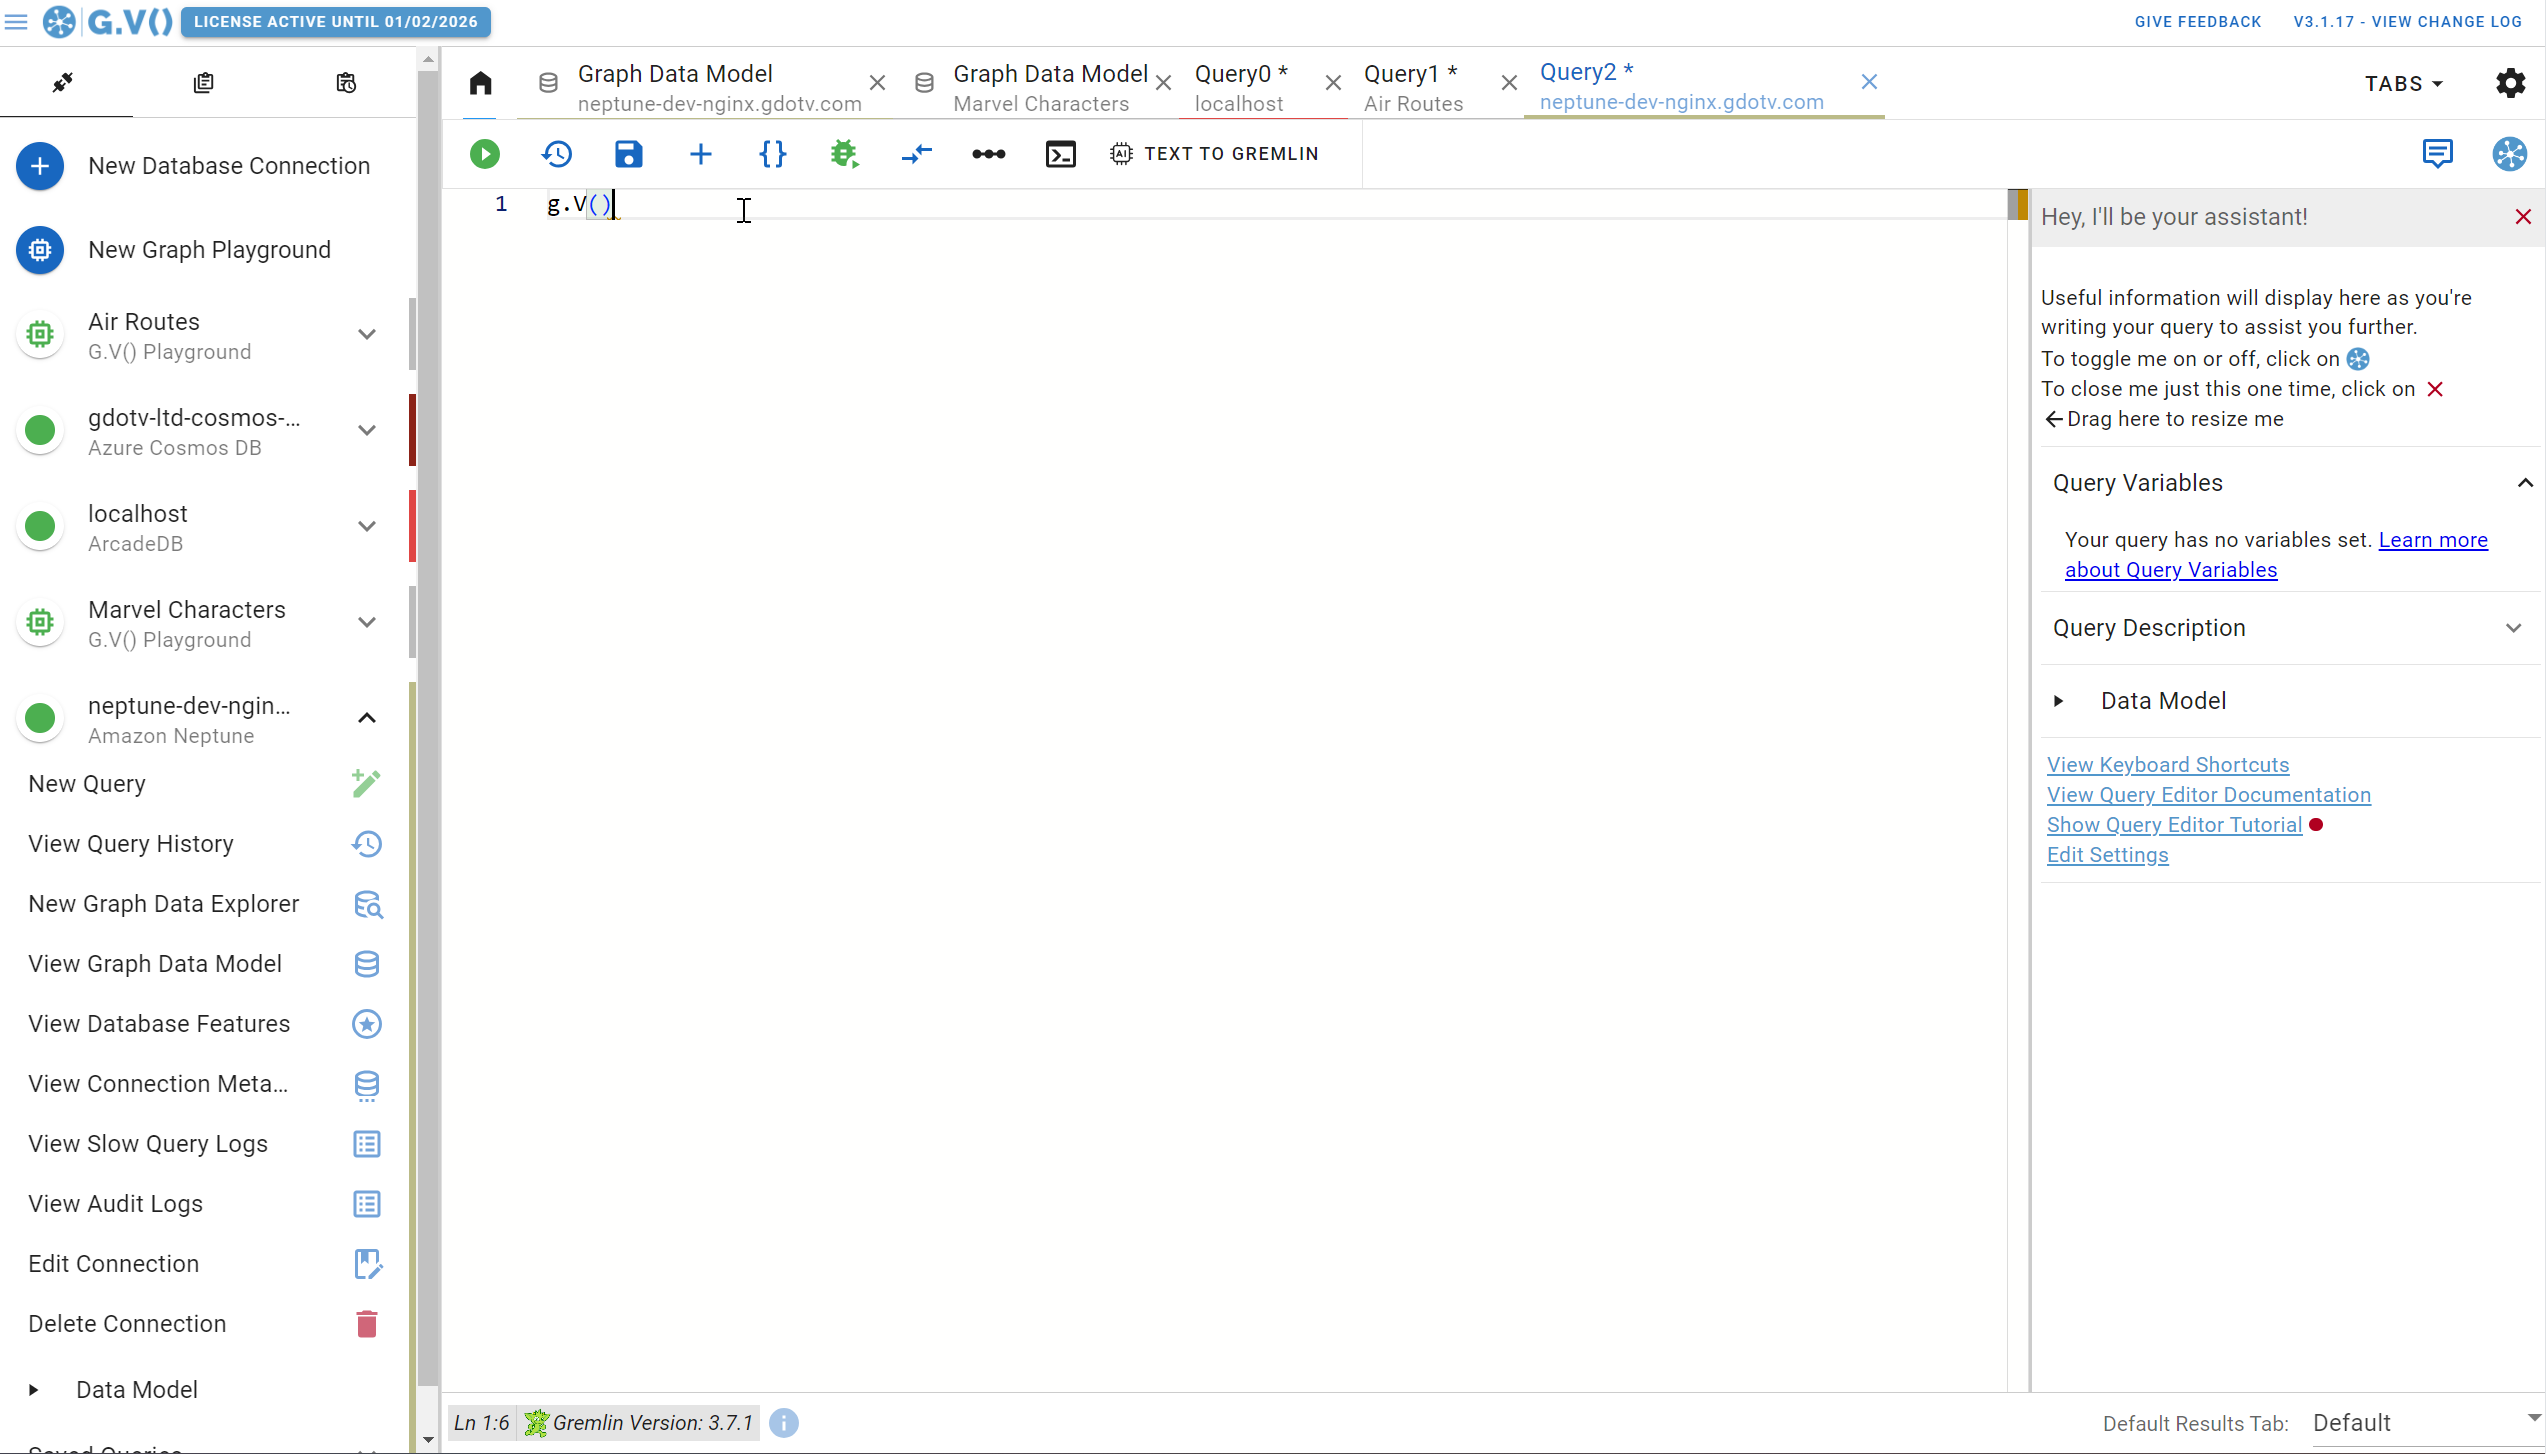
G.V() offers the most advanced Gremlin query editor so you can write and run queries with ease
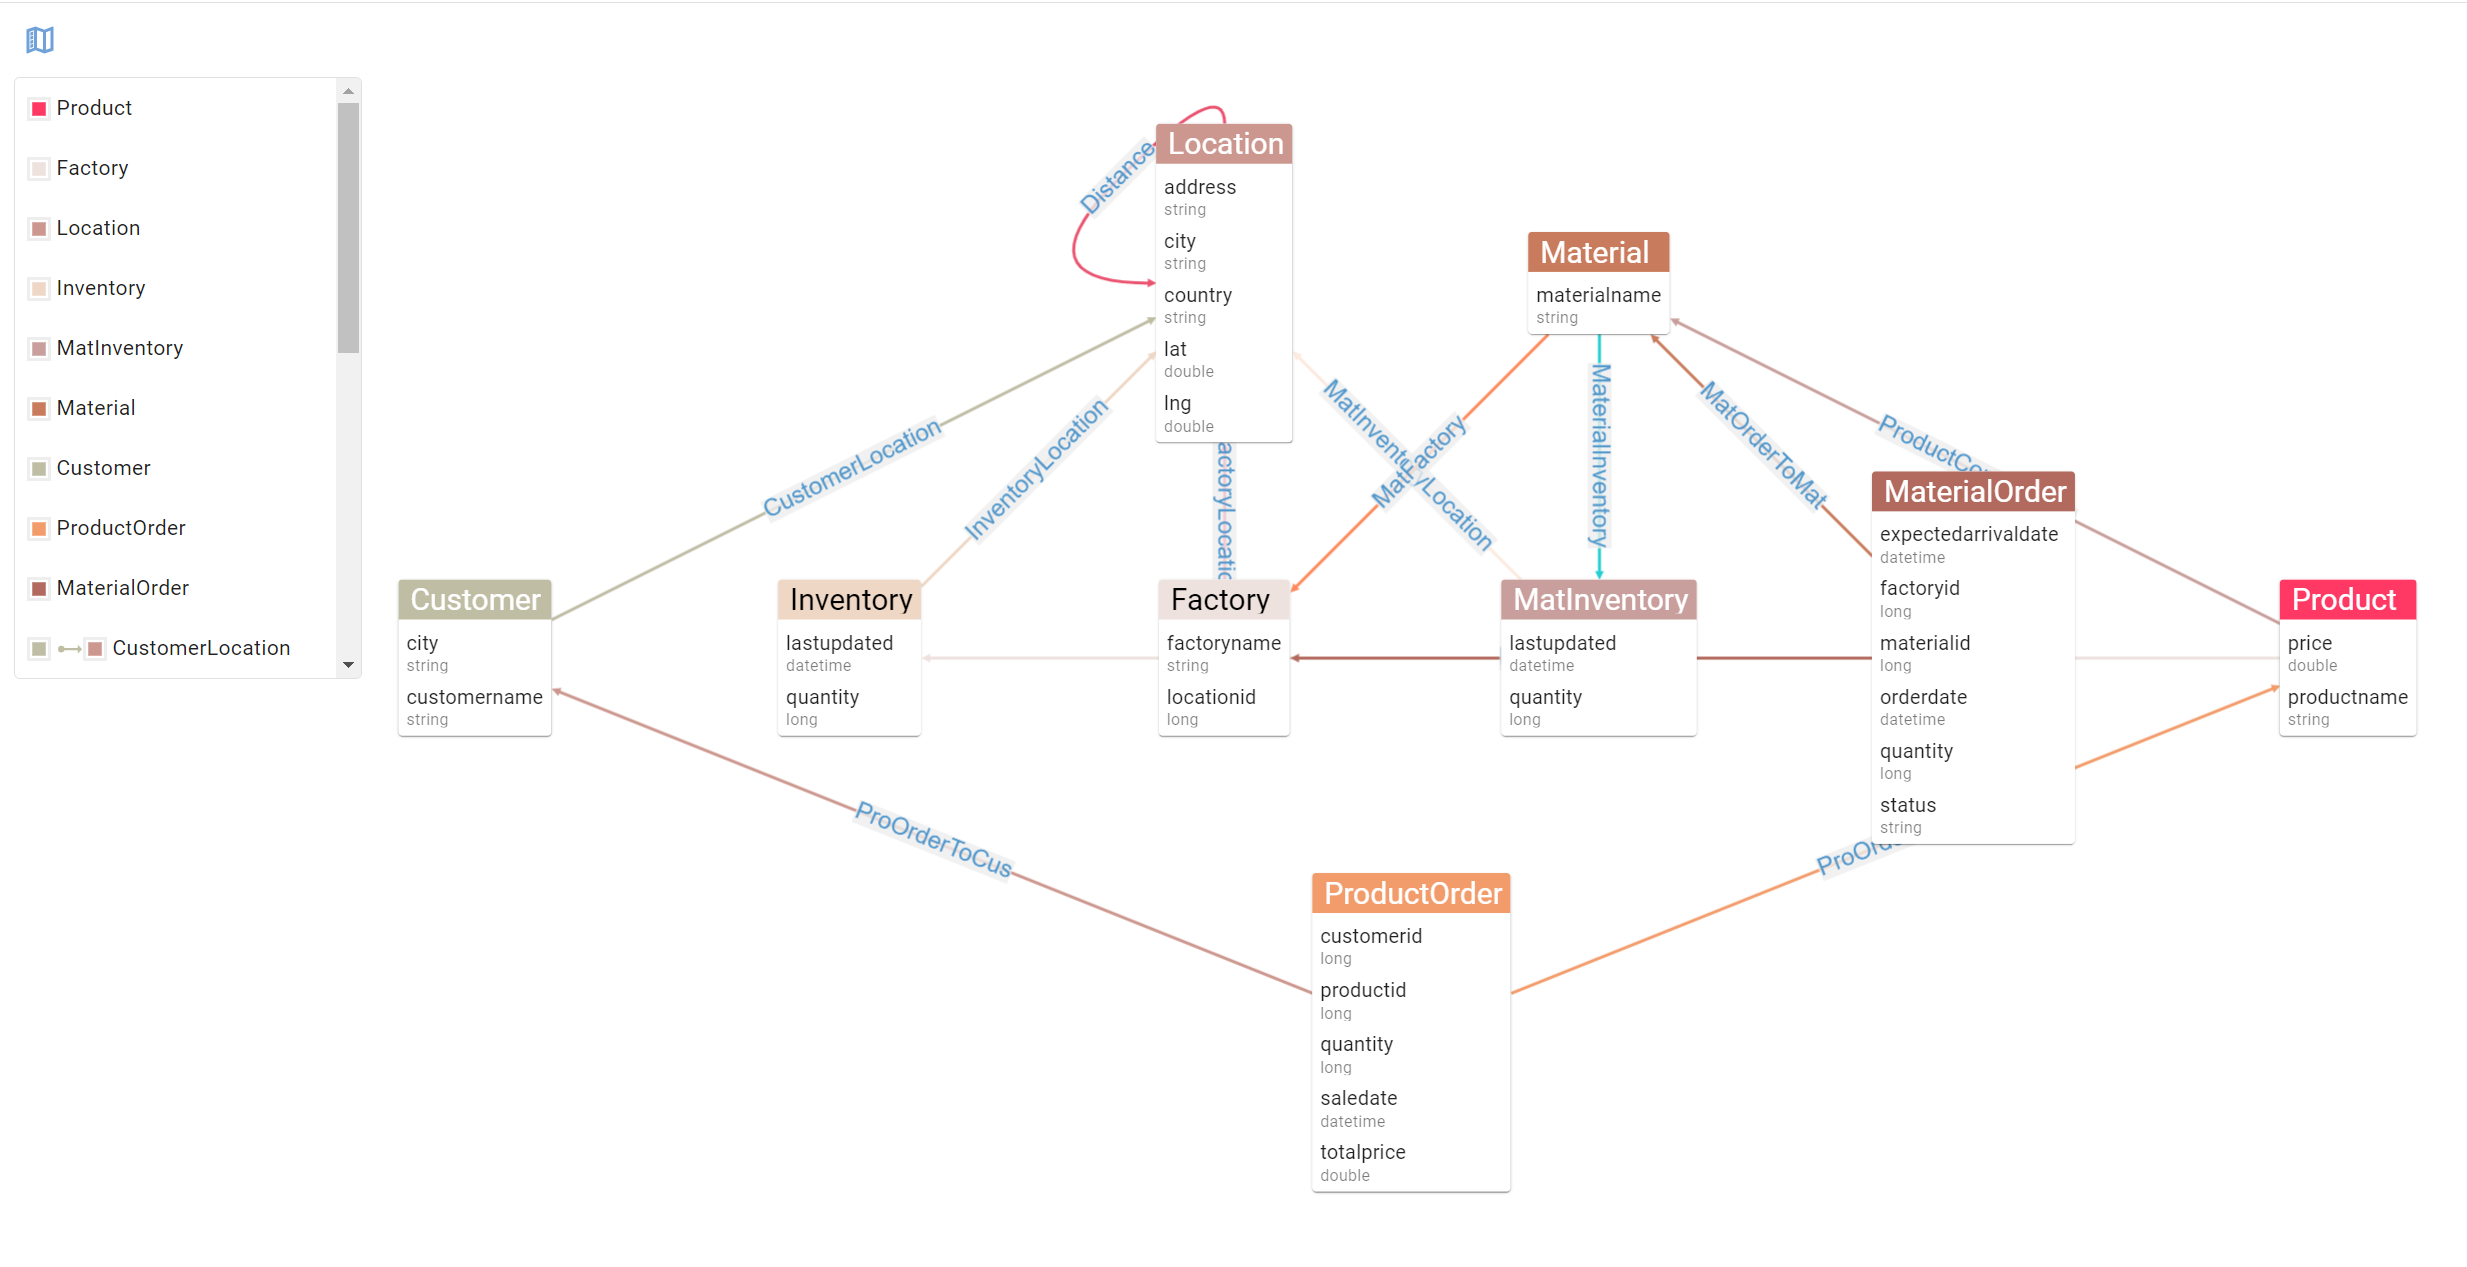
An entity-relationship diagram in G.V() showing the structure of a sample supply chain schema
By automatically loading your graph data schema, it offers code completion that is tuned to the structure of your database. This simplifies collaboration between developers by bringing a unified view of your data model, ensuring your query is always accurate.
Powerful Gremlin Query Debugging
Our interactive data visualization toolkit allows you to debug and troubleshoot your Gremlin queries with a one-of-a-kind Gremlin debugging tool. G.V()’s detailed debugger breaks down your query step-by-step, allowing you to identify and troubleshoot bottlenecks or unexpected behaviour.
Combined with our one-click query profile and traversal explanation feature, you can quickly evaluate how well your query performed, as well as gain access to insights from Aerospike on how to optimize it.
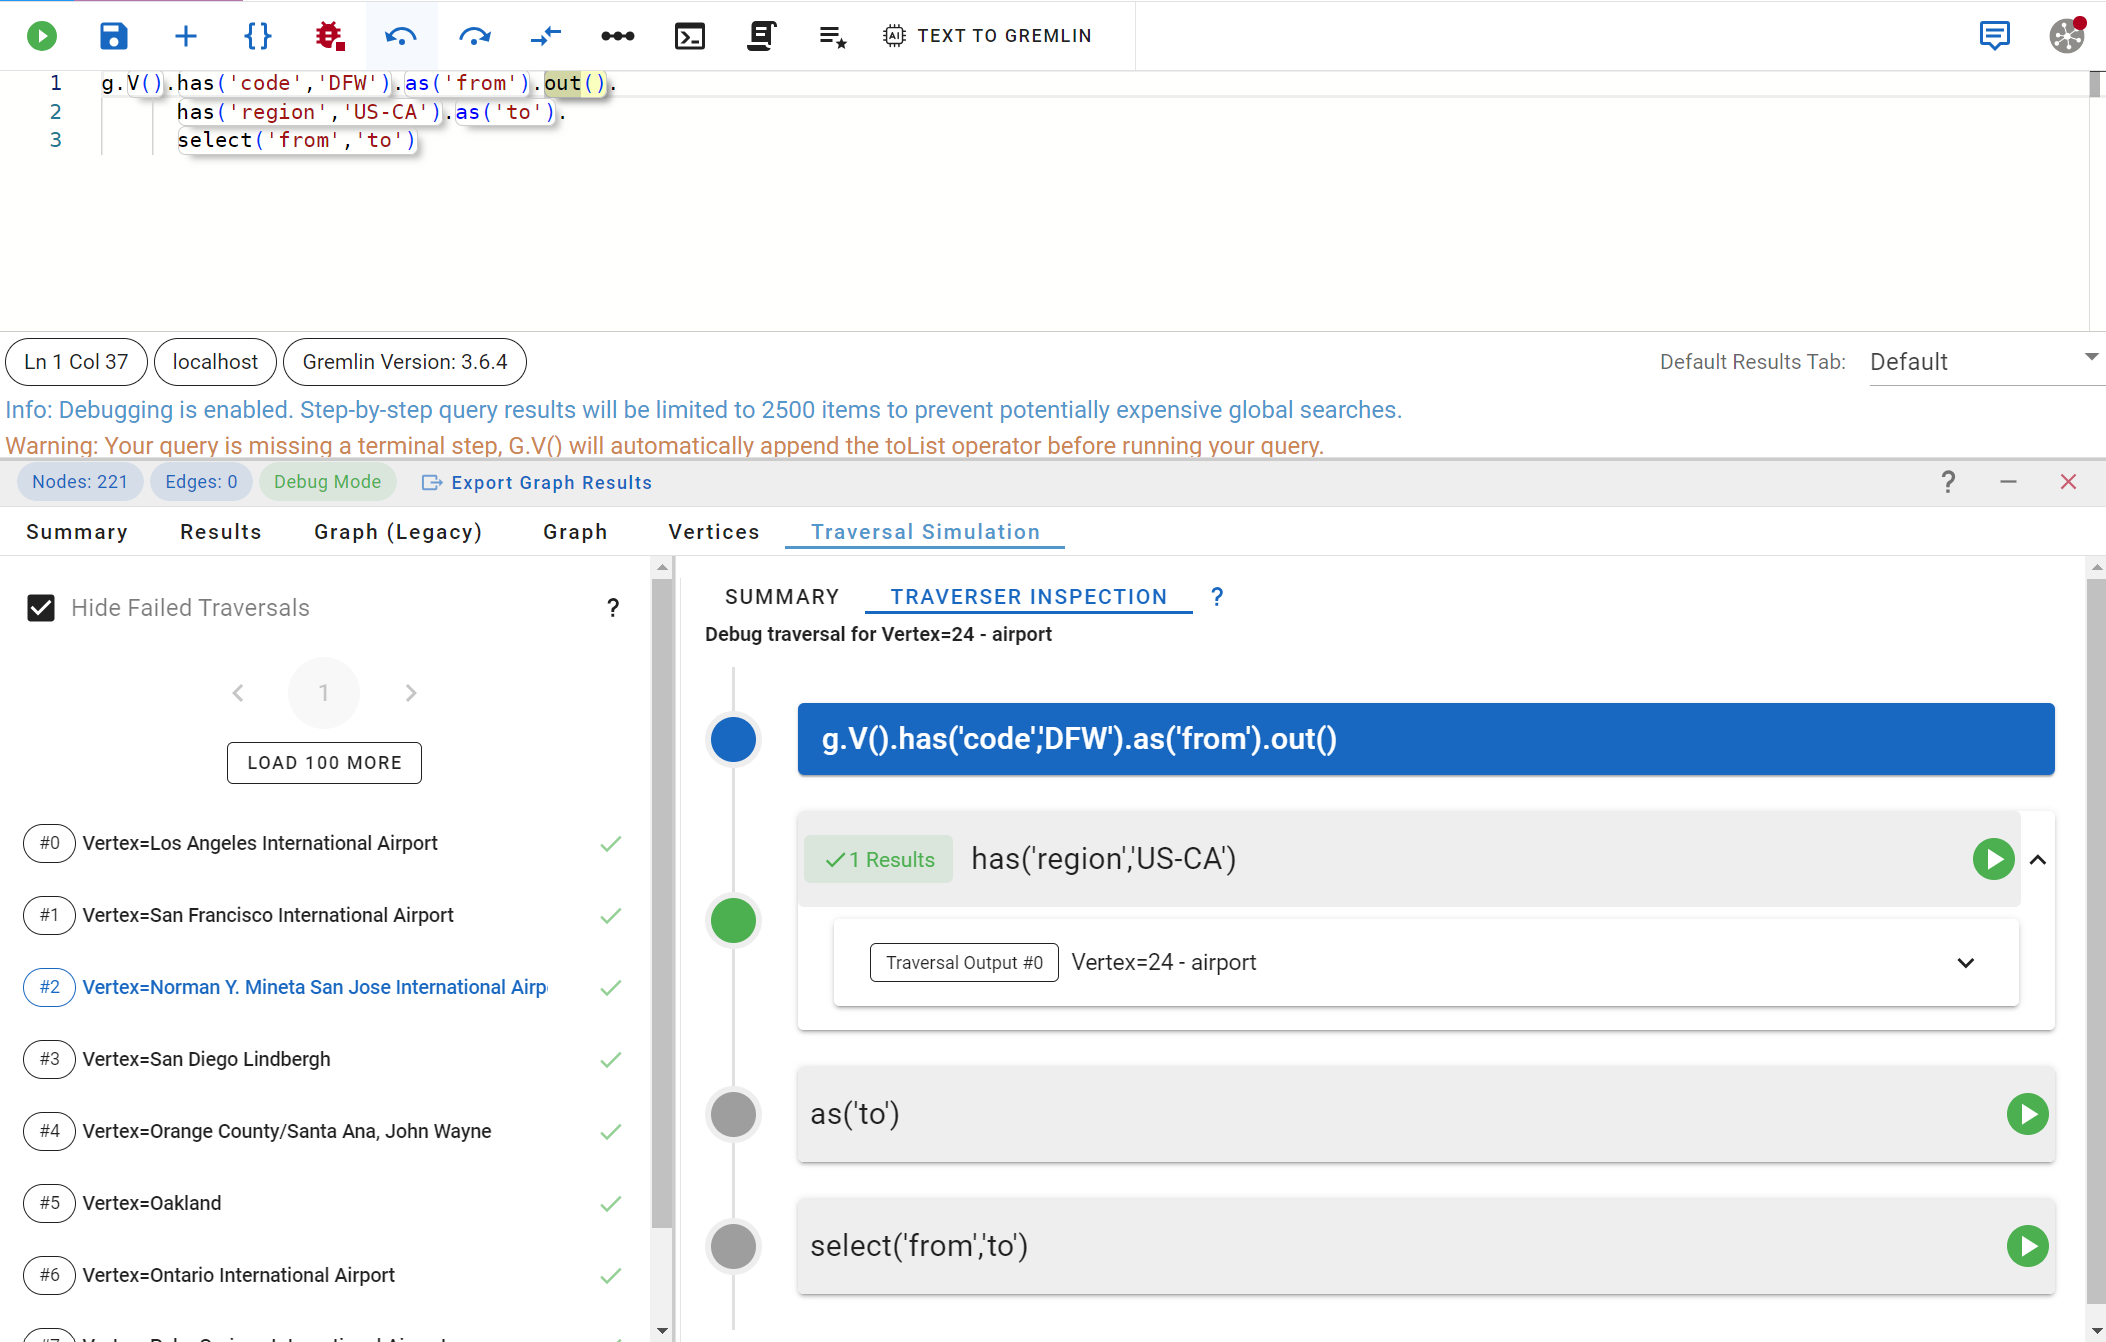
Run a traversal step by step and inspect traversers individually on G.V()
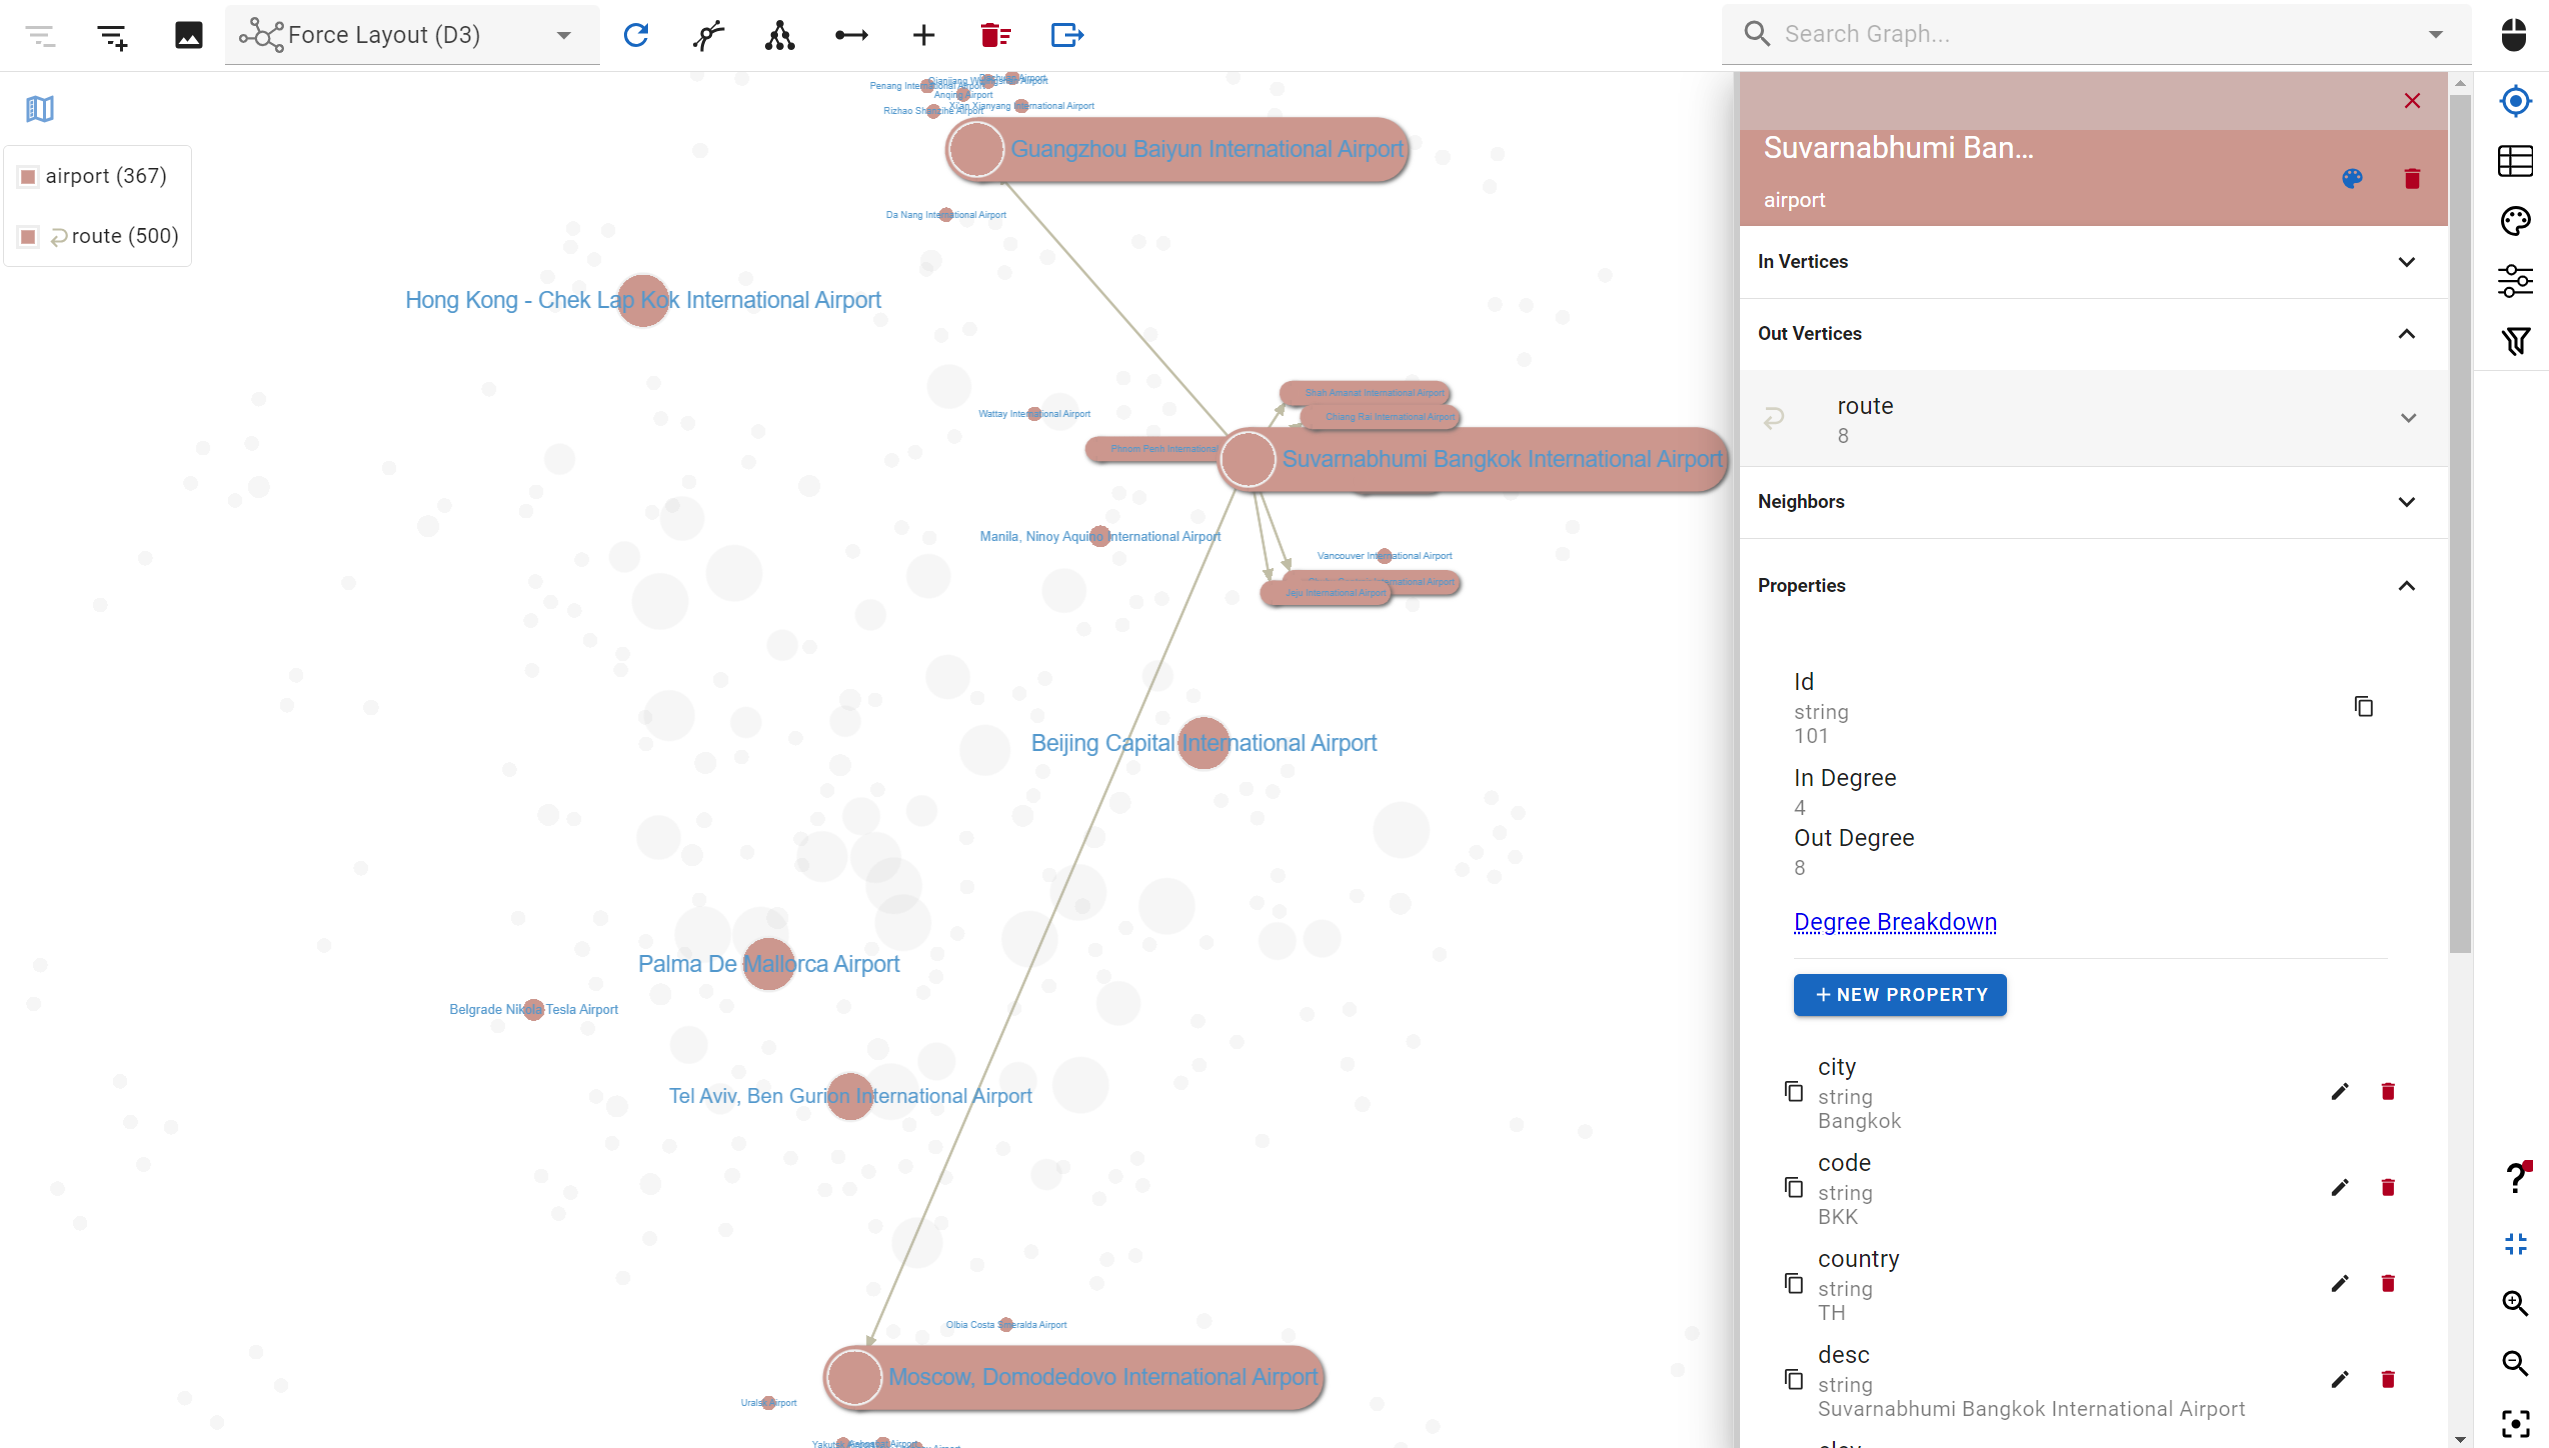
View, edit, filter and explore your graph data interactively with G.V()'s no-code explorer
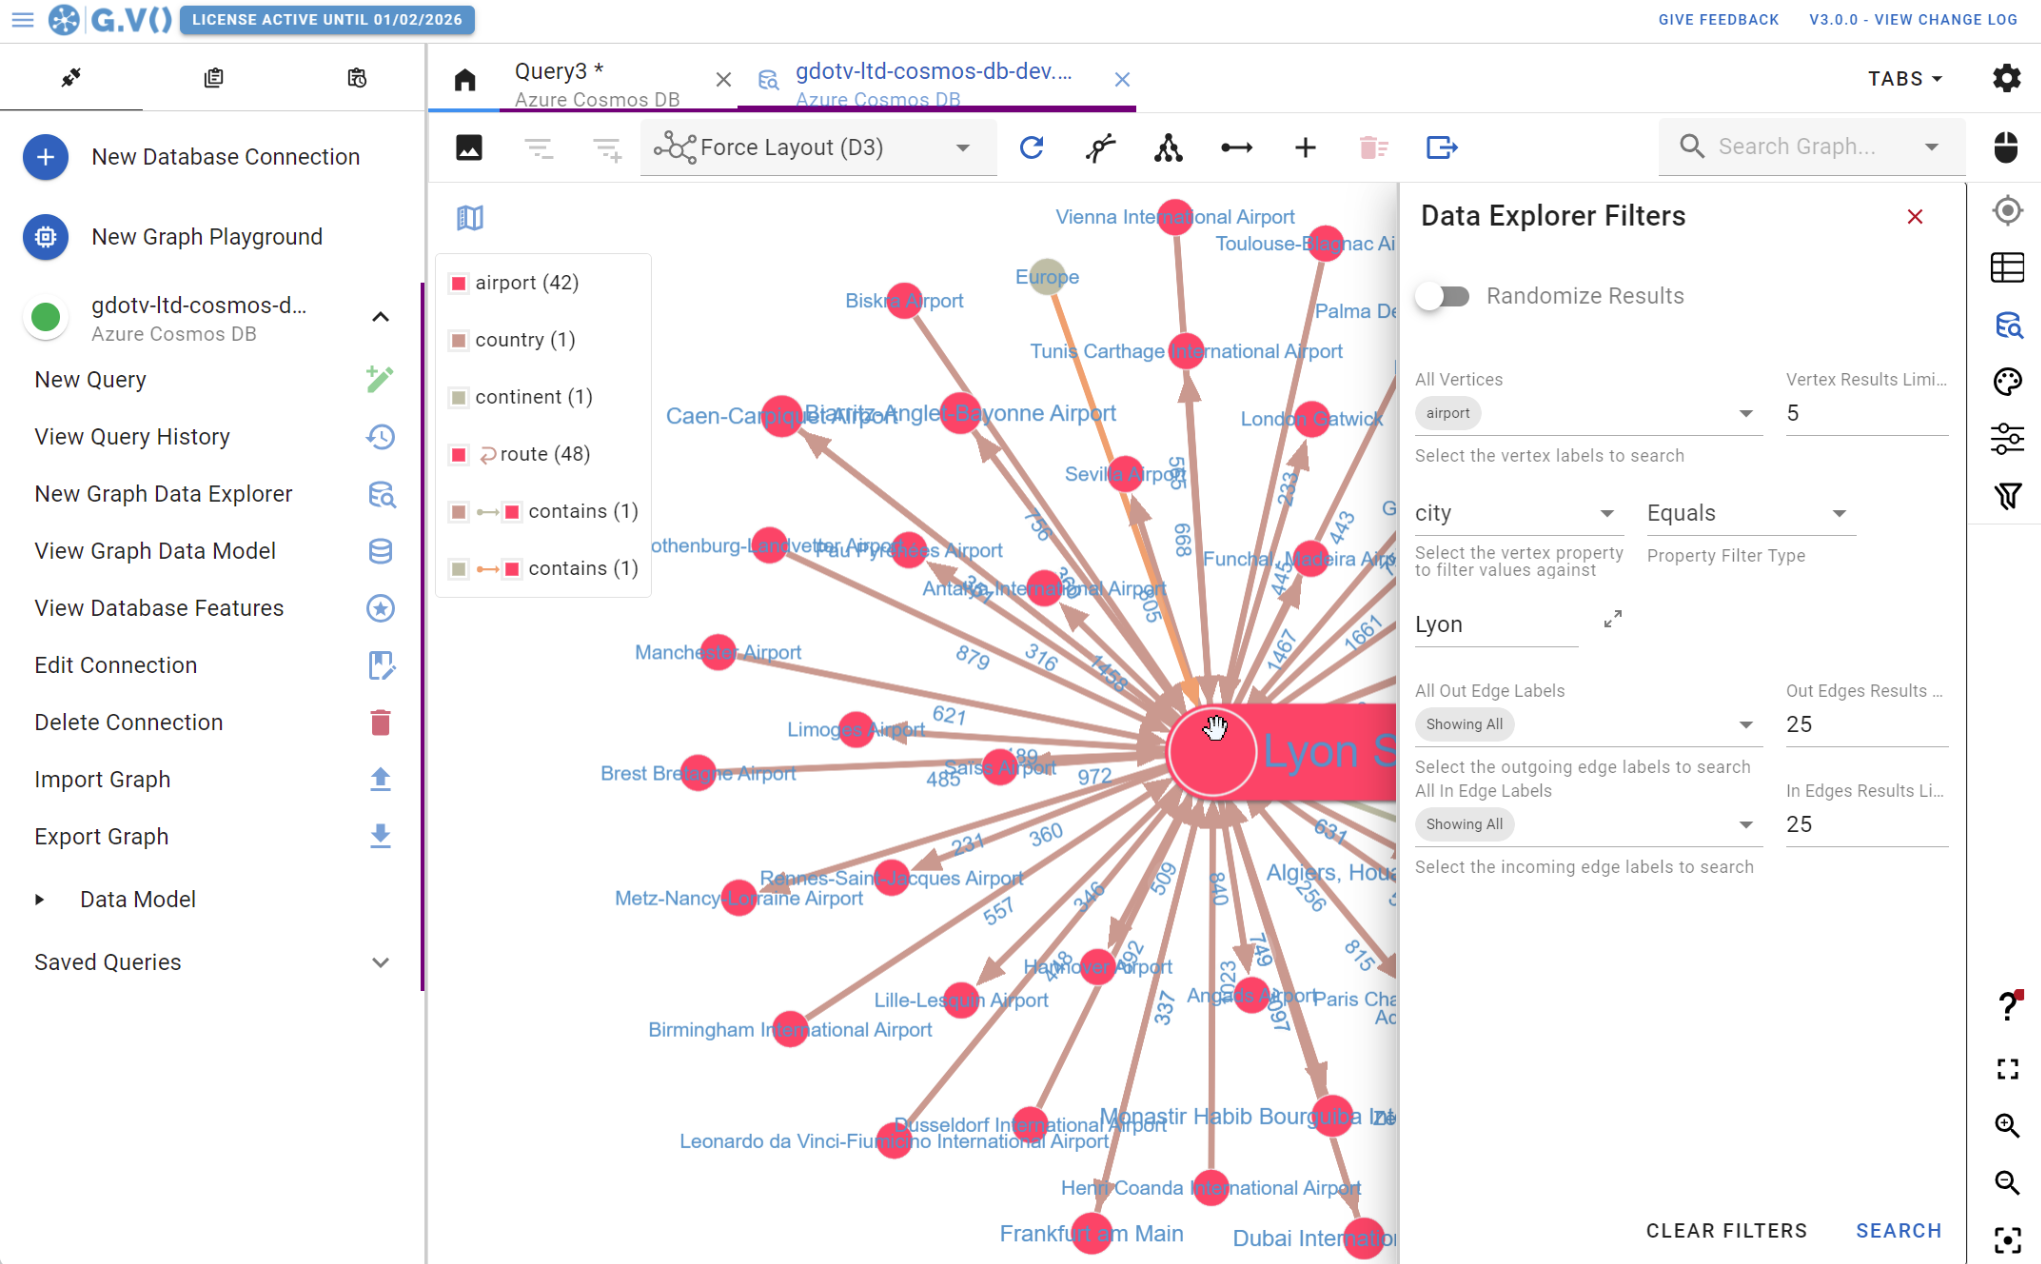
Retrieve records with no-code using our data model aware search tool
Real-time Graph Explorer
Our data exploration tool no-code user interface enabling you to load data and explore it interactively. It lets you navigate data freely in just a few clicks, as well as create, update or delete vertices, edges and their properties directly against your database.
It’s built for high performance and ease of use, and enables data teams to bring their graph to life with highly customizable styling features, graph layouts and filtering controls.
Customizable Graph Data Visualization
G.V() offers various formatting and customization options to browse and analyze your query results. It presents visualization options based on the structure of your query results, and supports the following formats:
-
JSON: displays your results in a plain, exportable JSON output
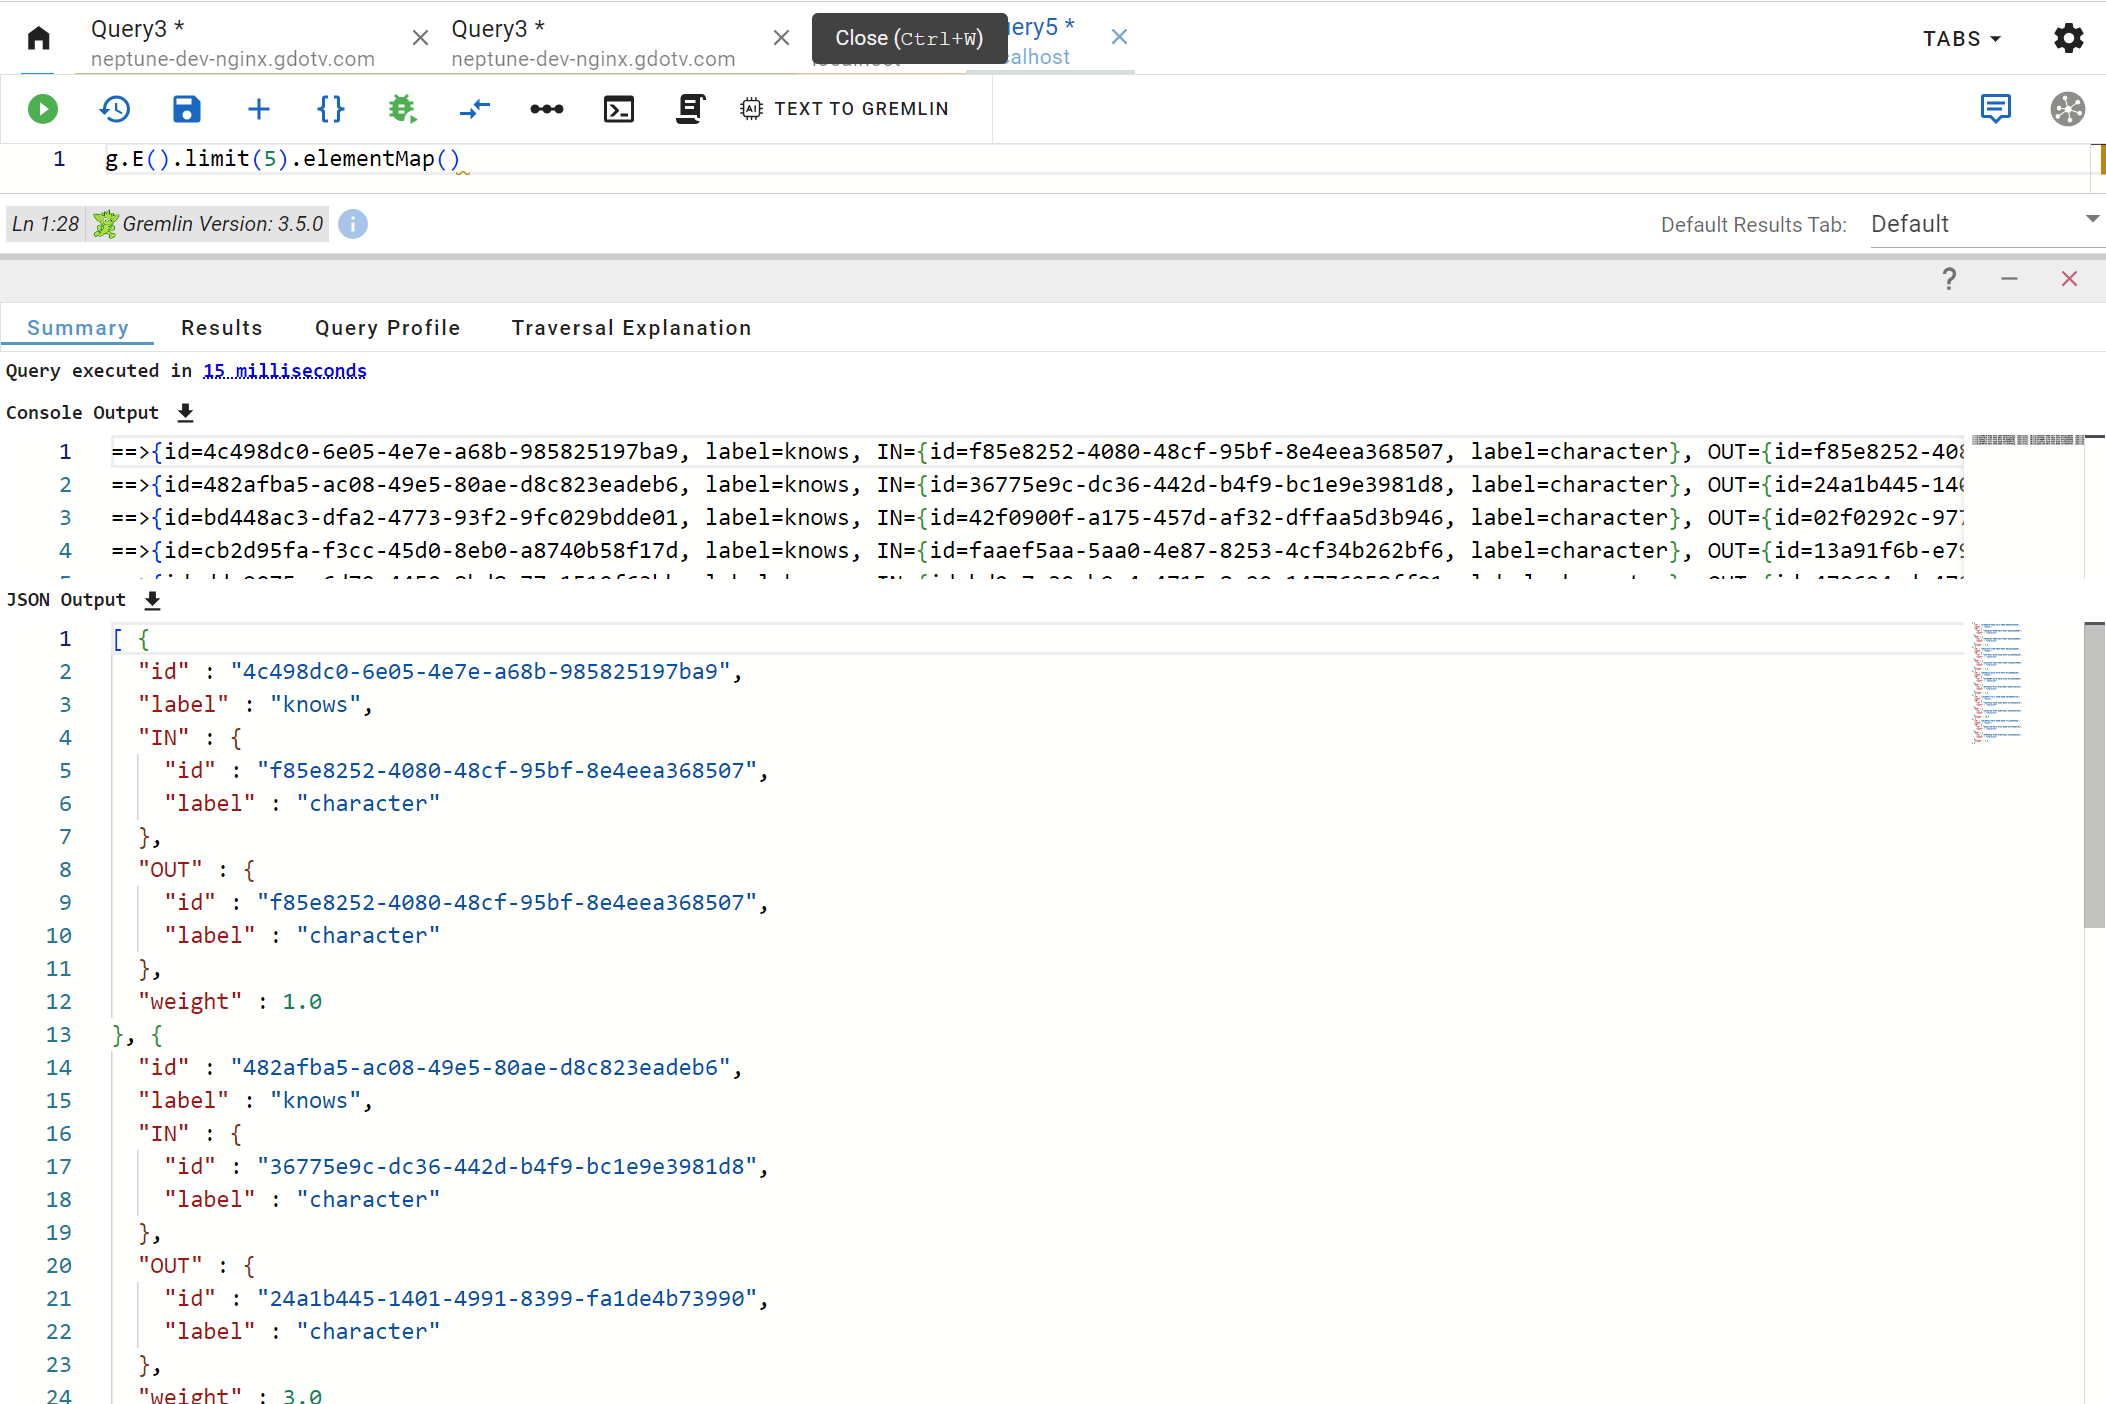
Our developer-friendly JSON view make it easy to navigate, filter and export your query output
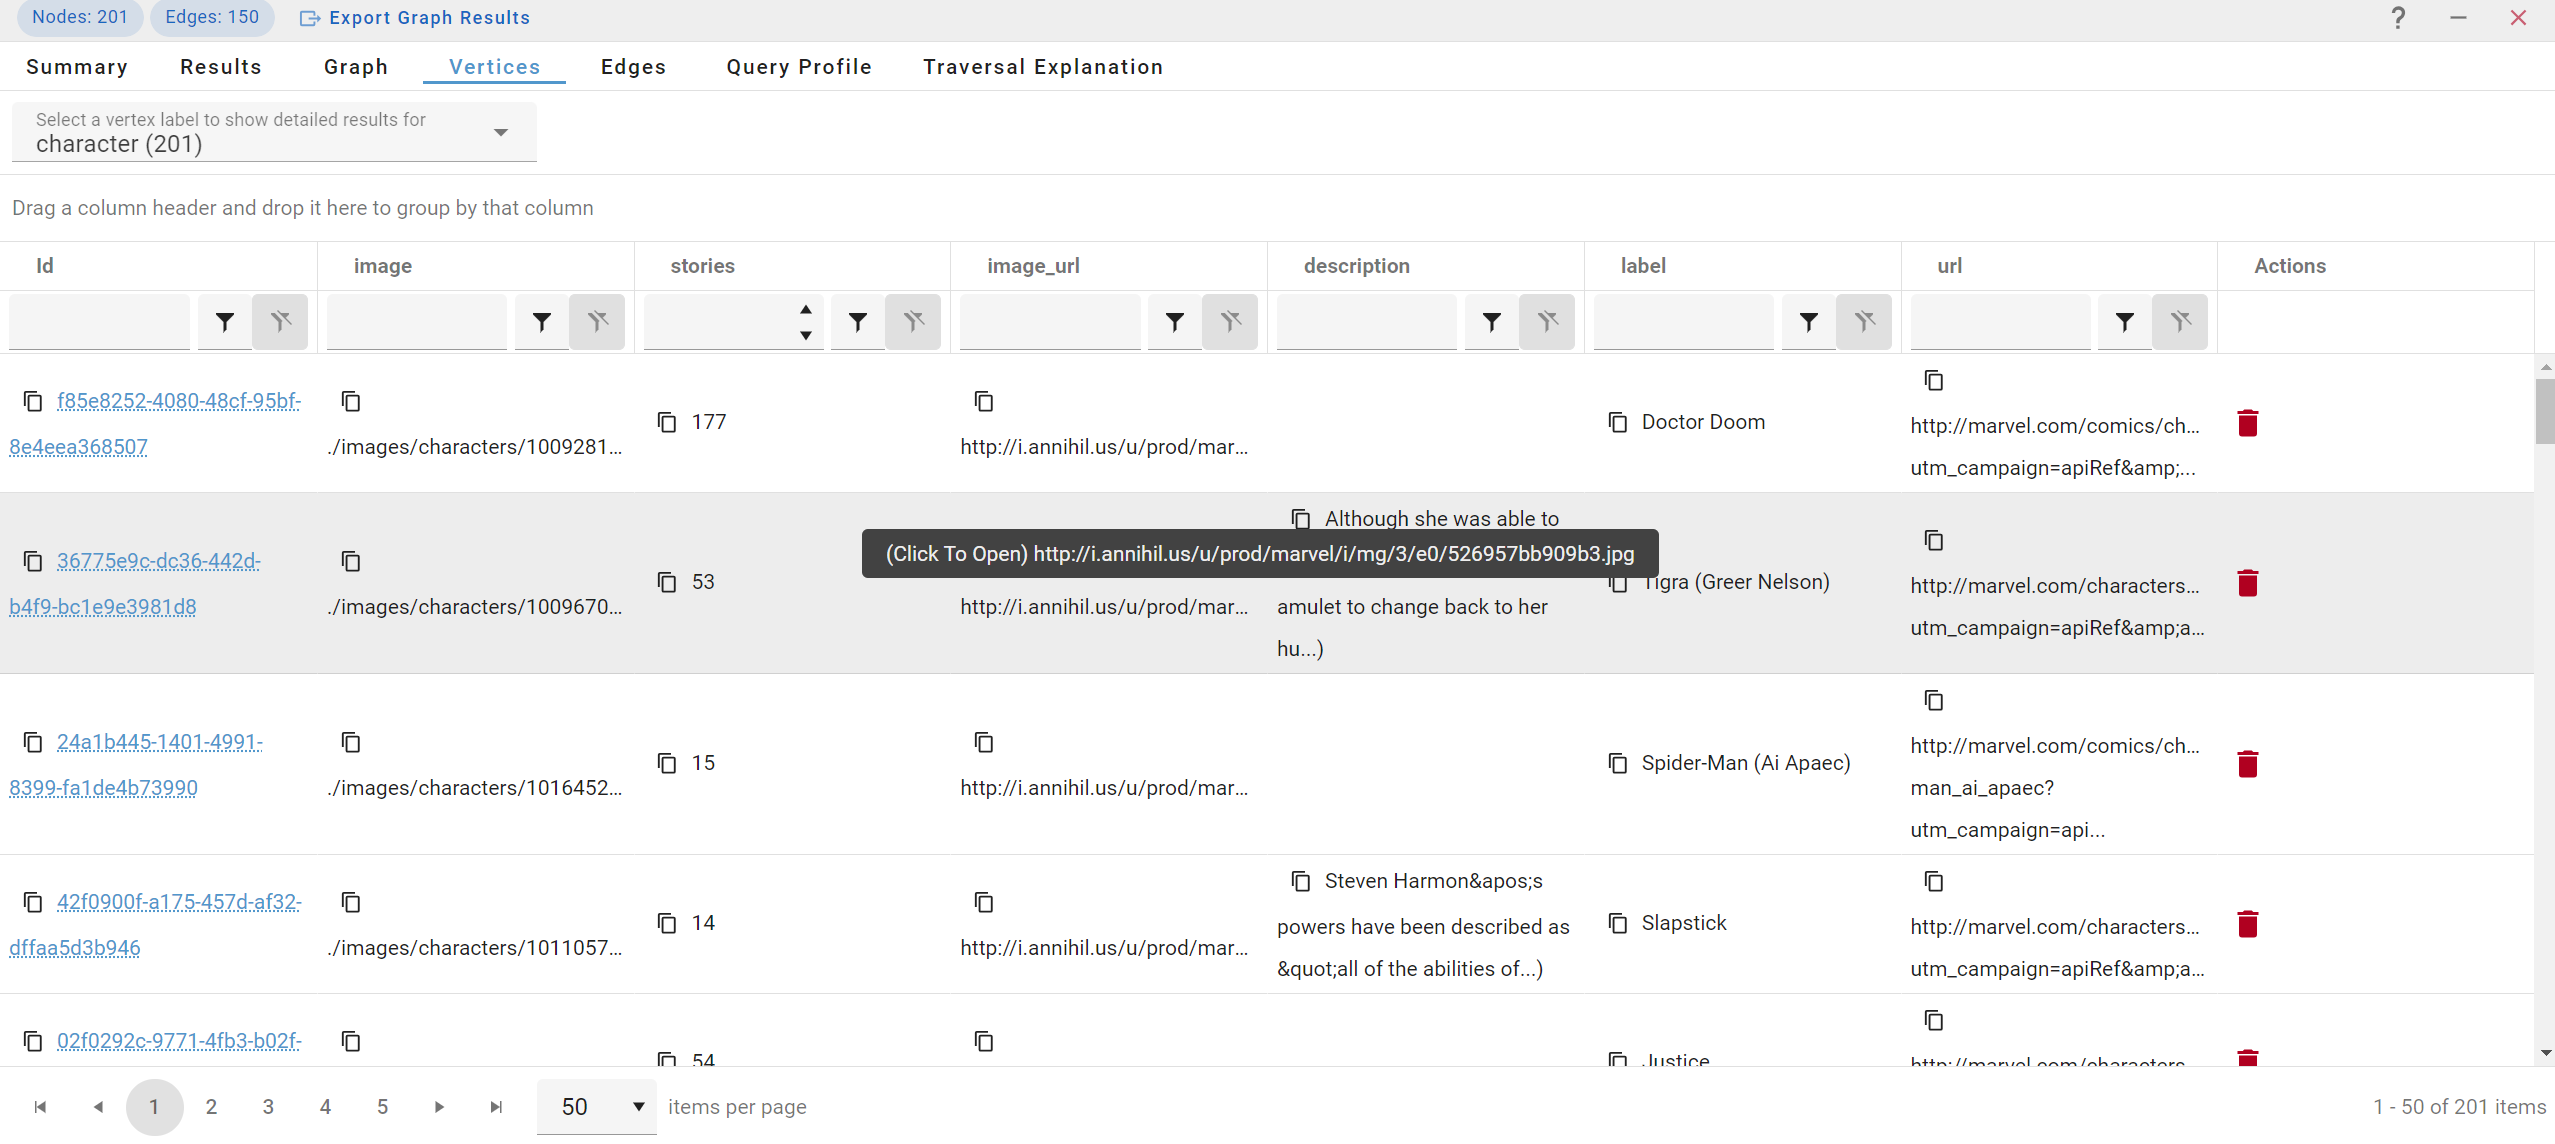
With our table display you can quickly compare, sort and filters Aerospike DB records
- Table: organizes your edges and nodes into tables grouped by label, with properties as columns.
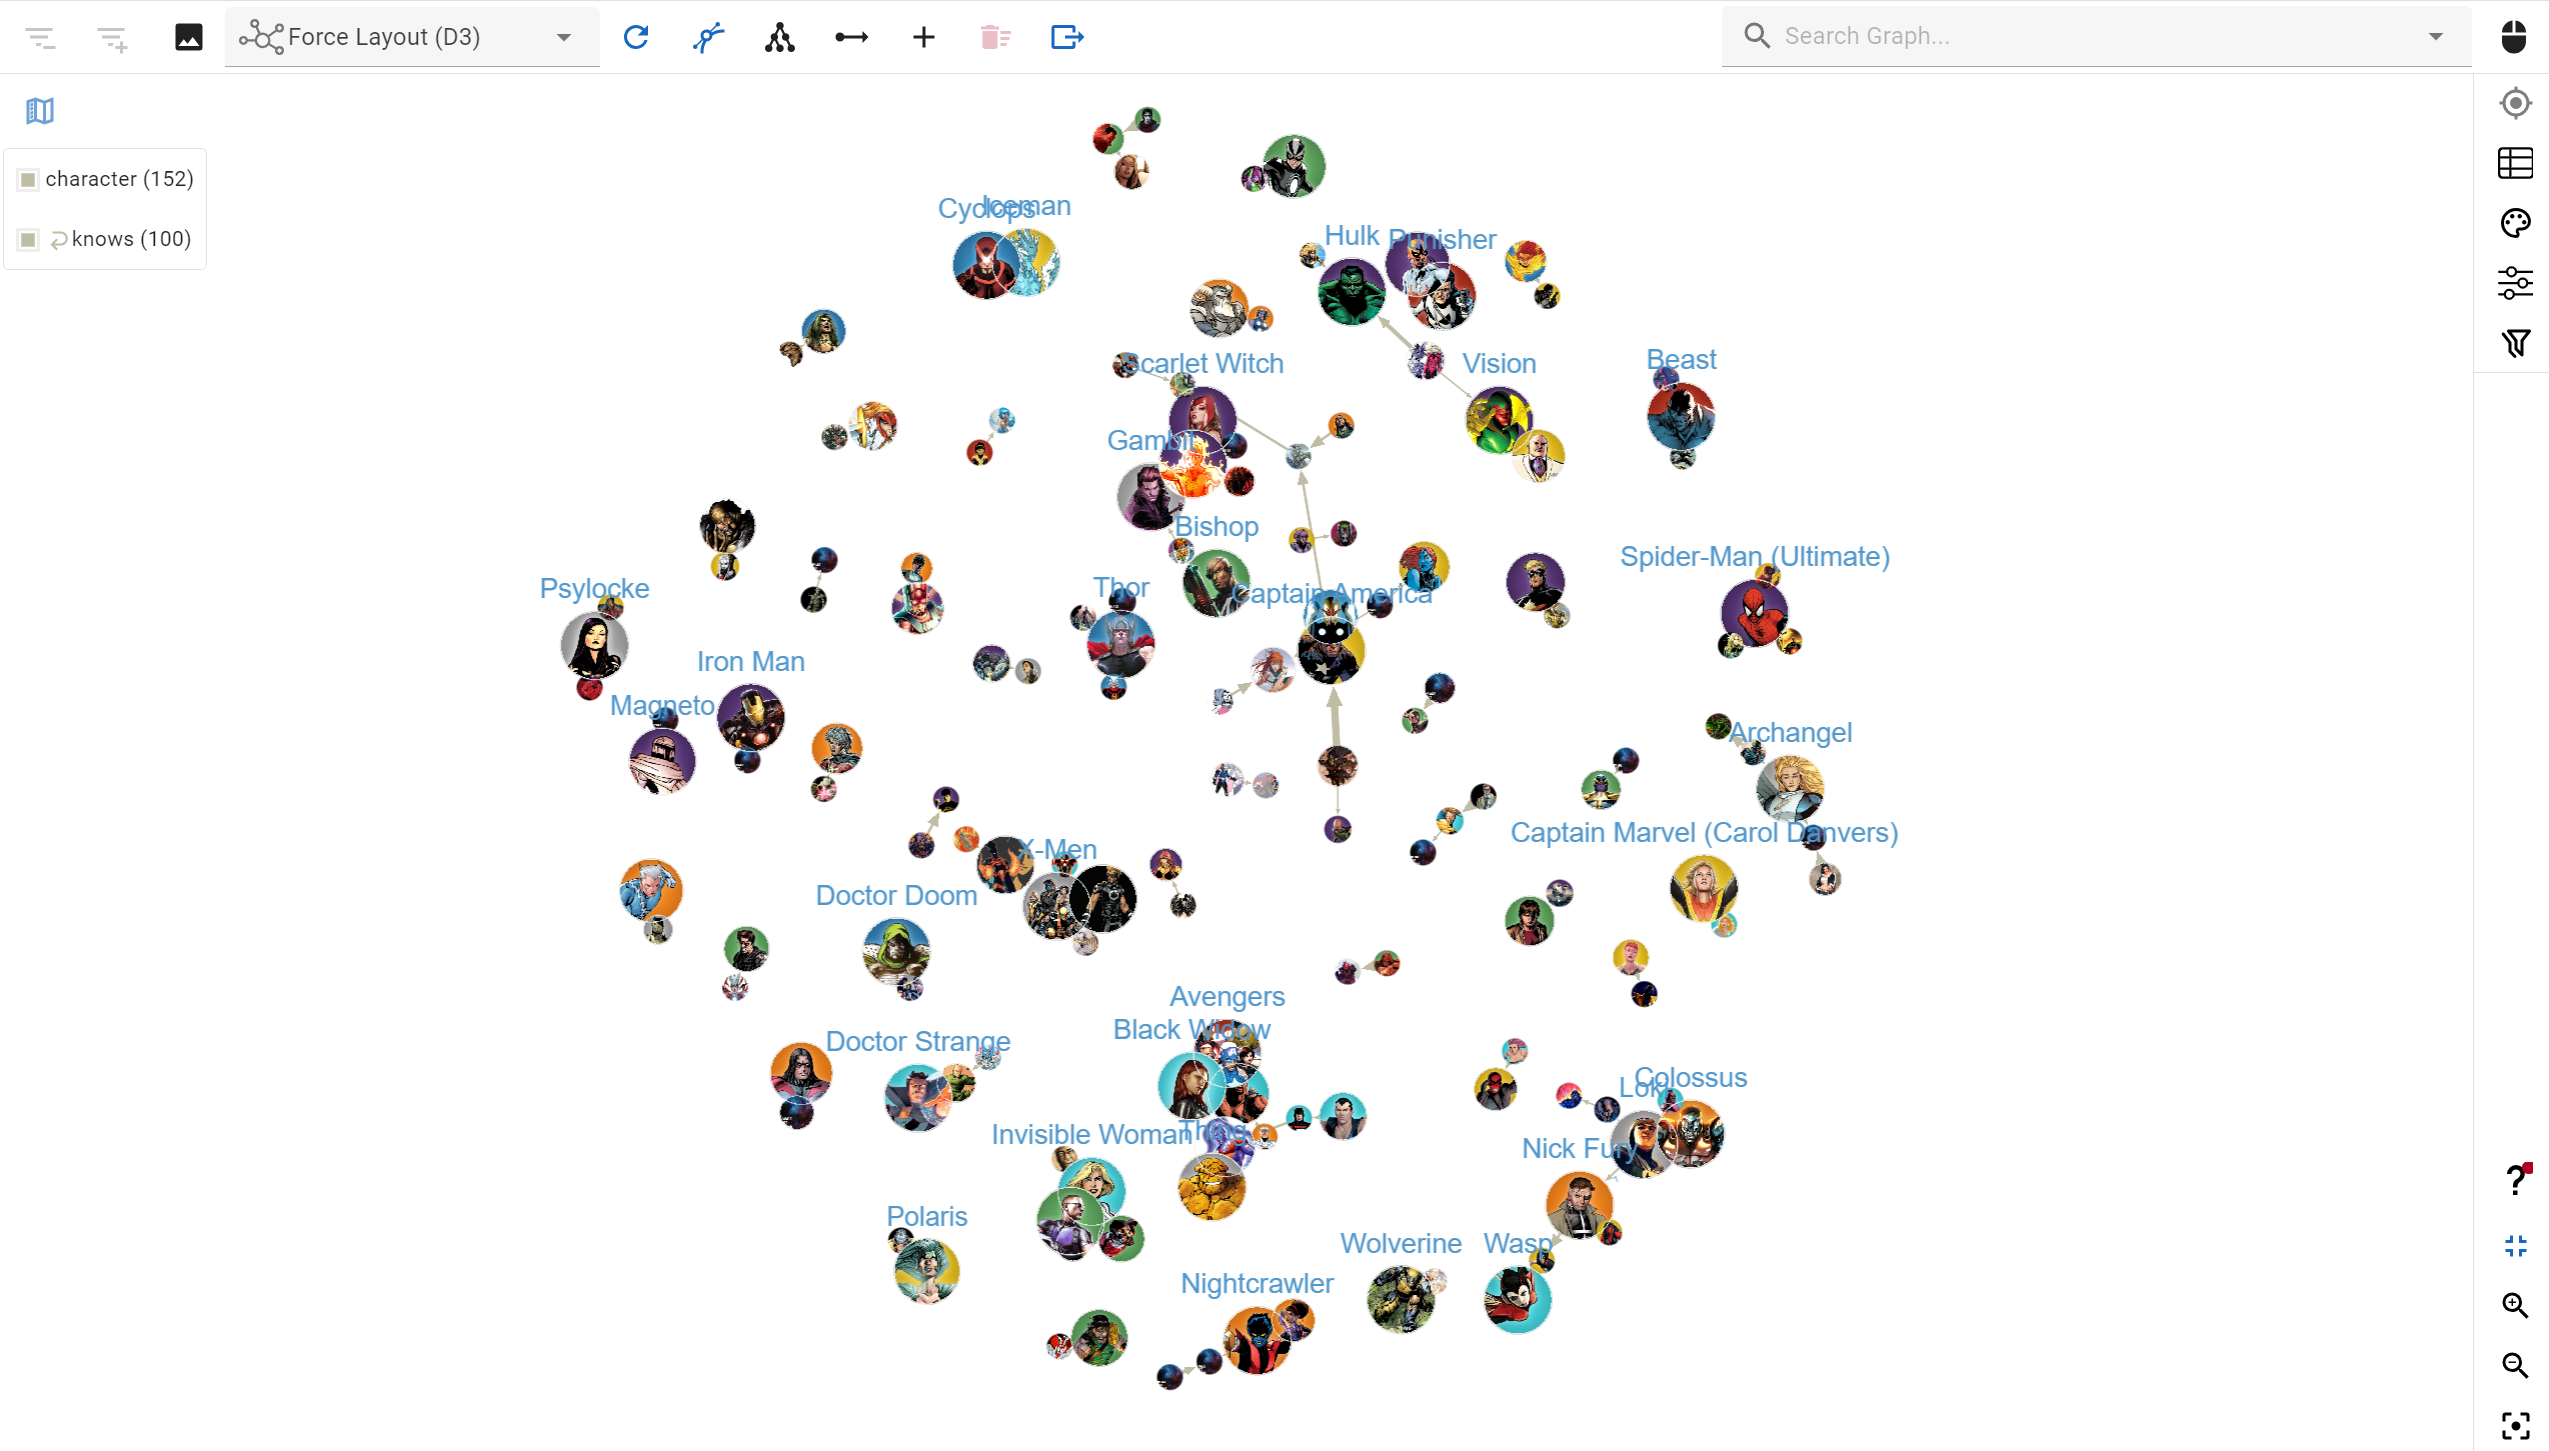
- Graph: a highly interactive graph display of your data showing vertices and their relationships
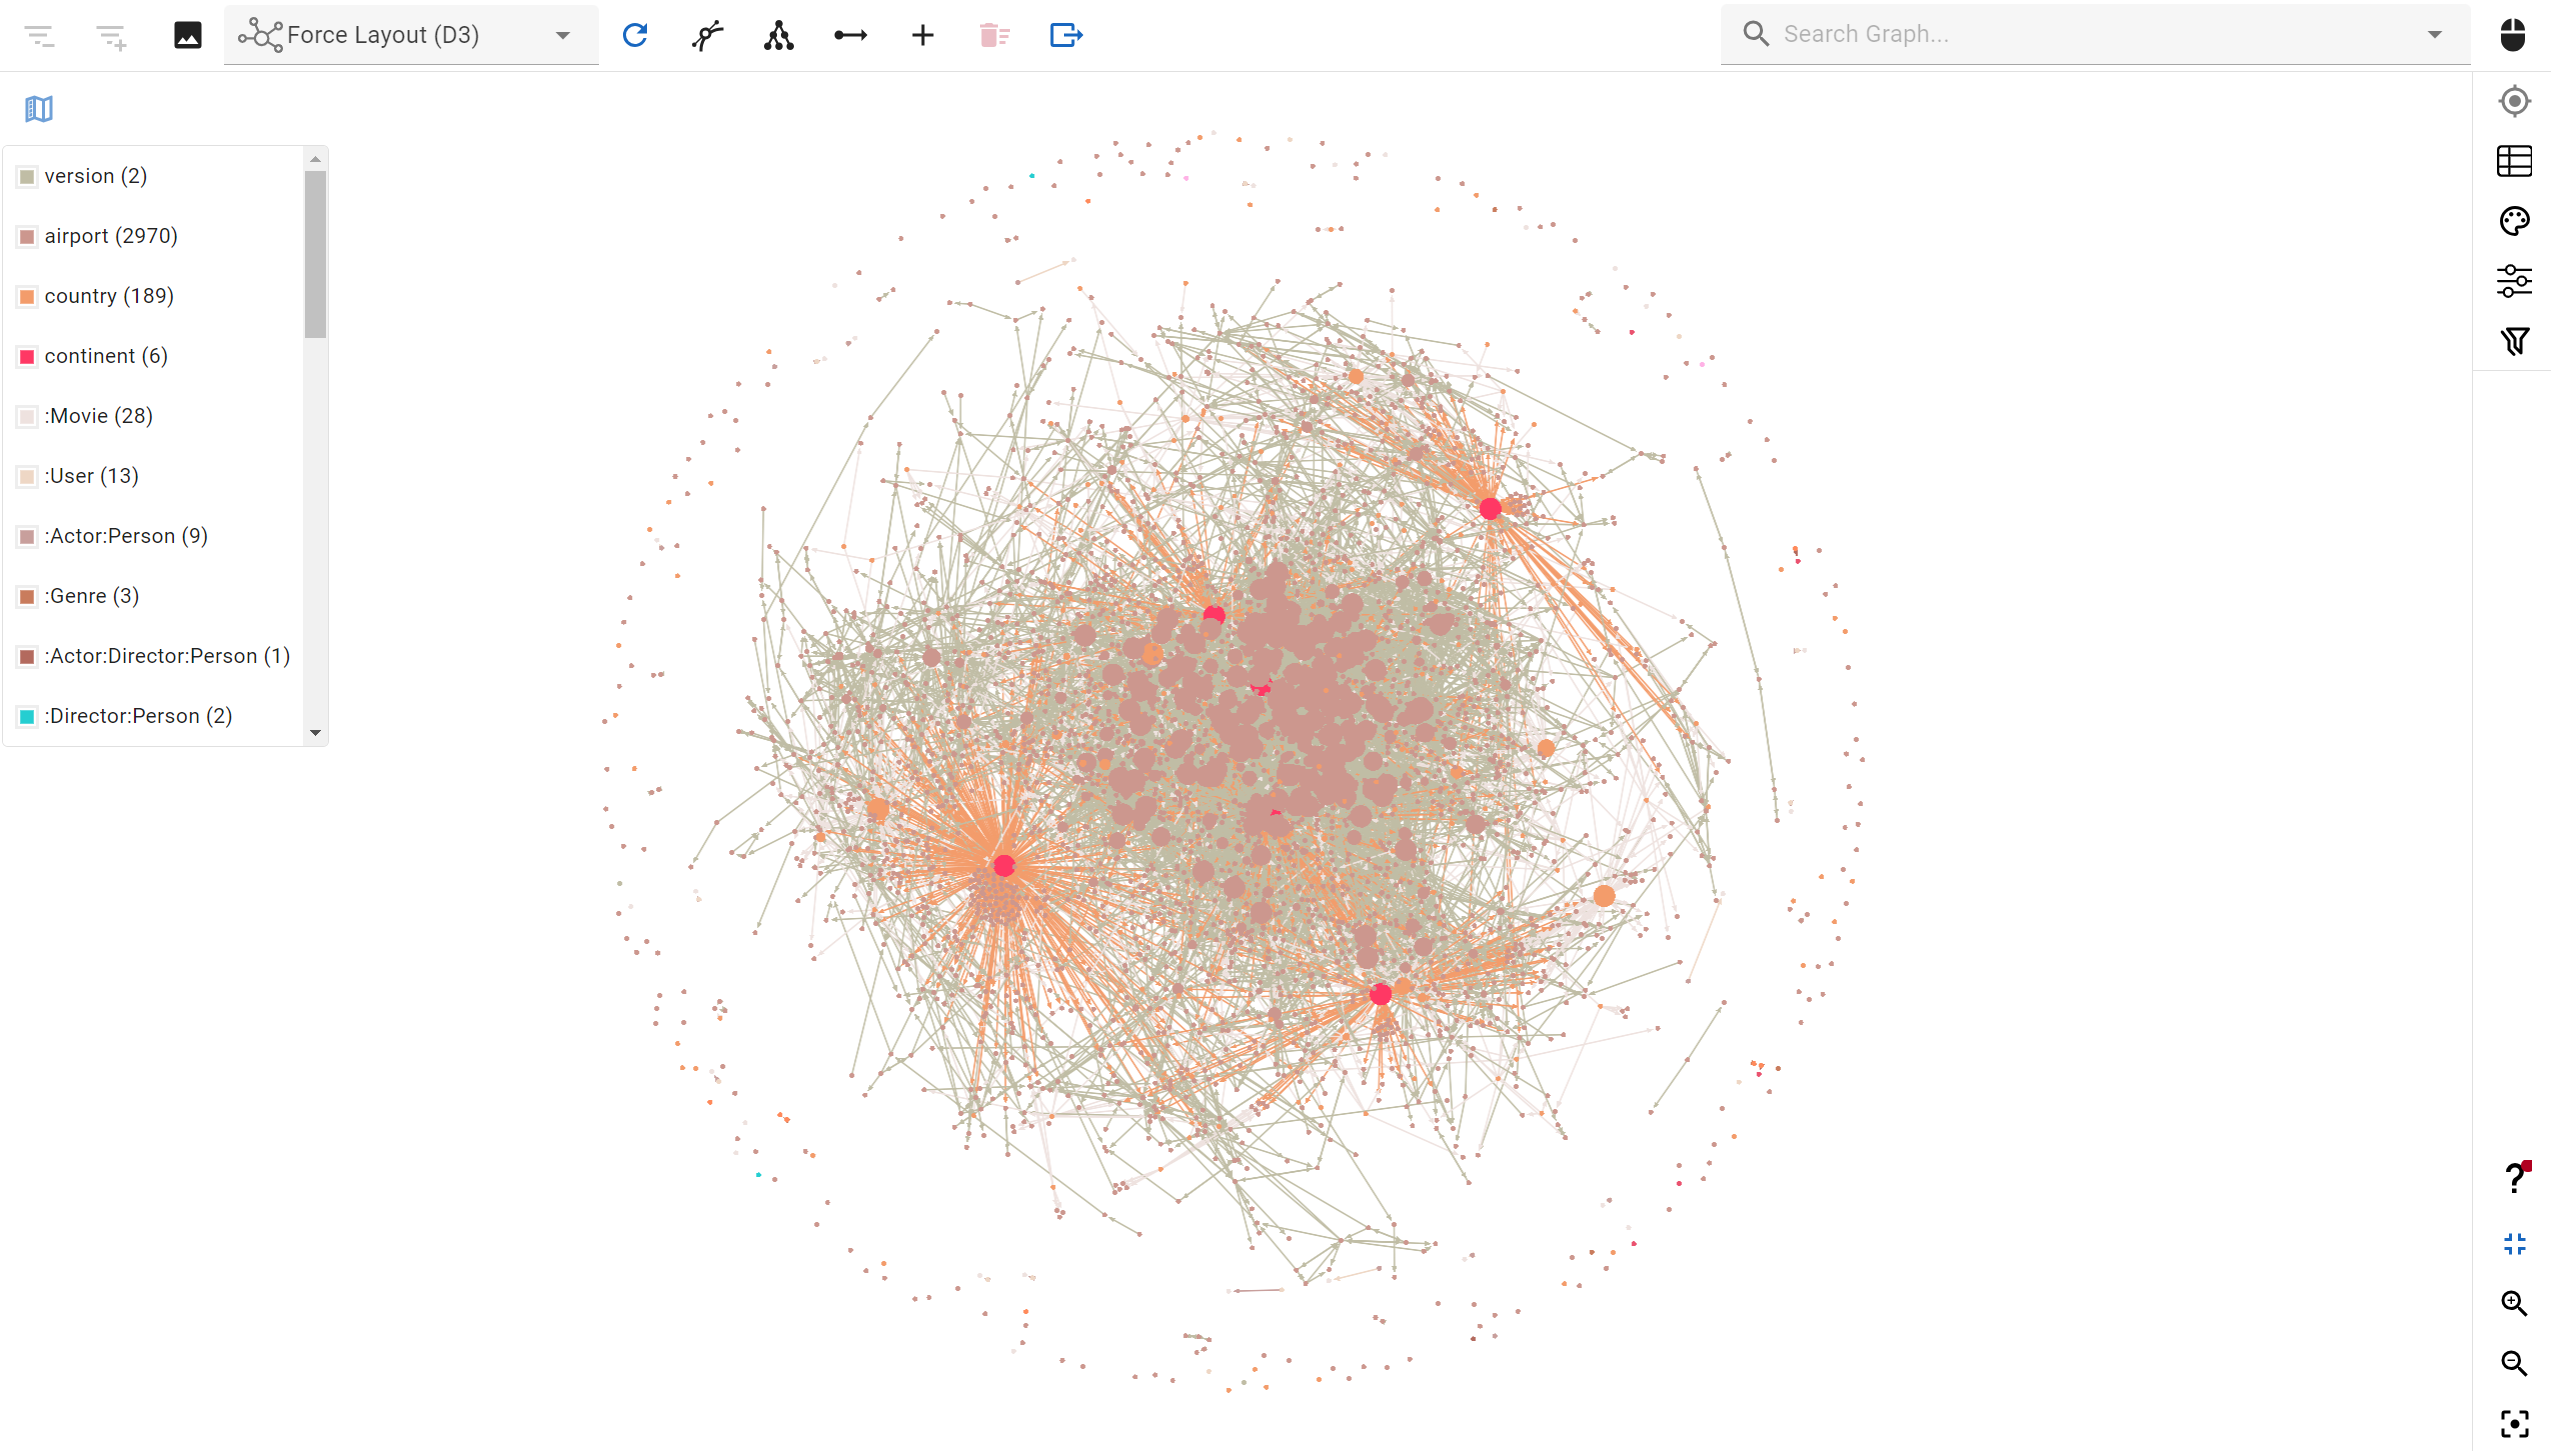
Our feature-rich graph view provides many options to explore and visualize the output of your query
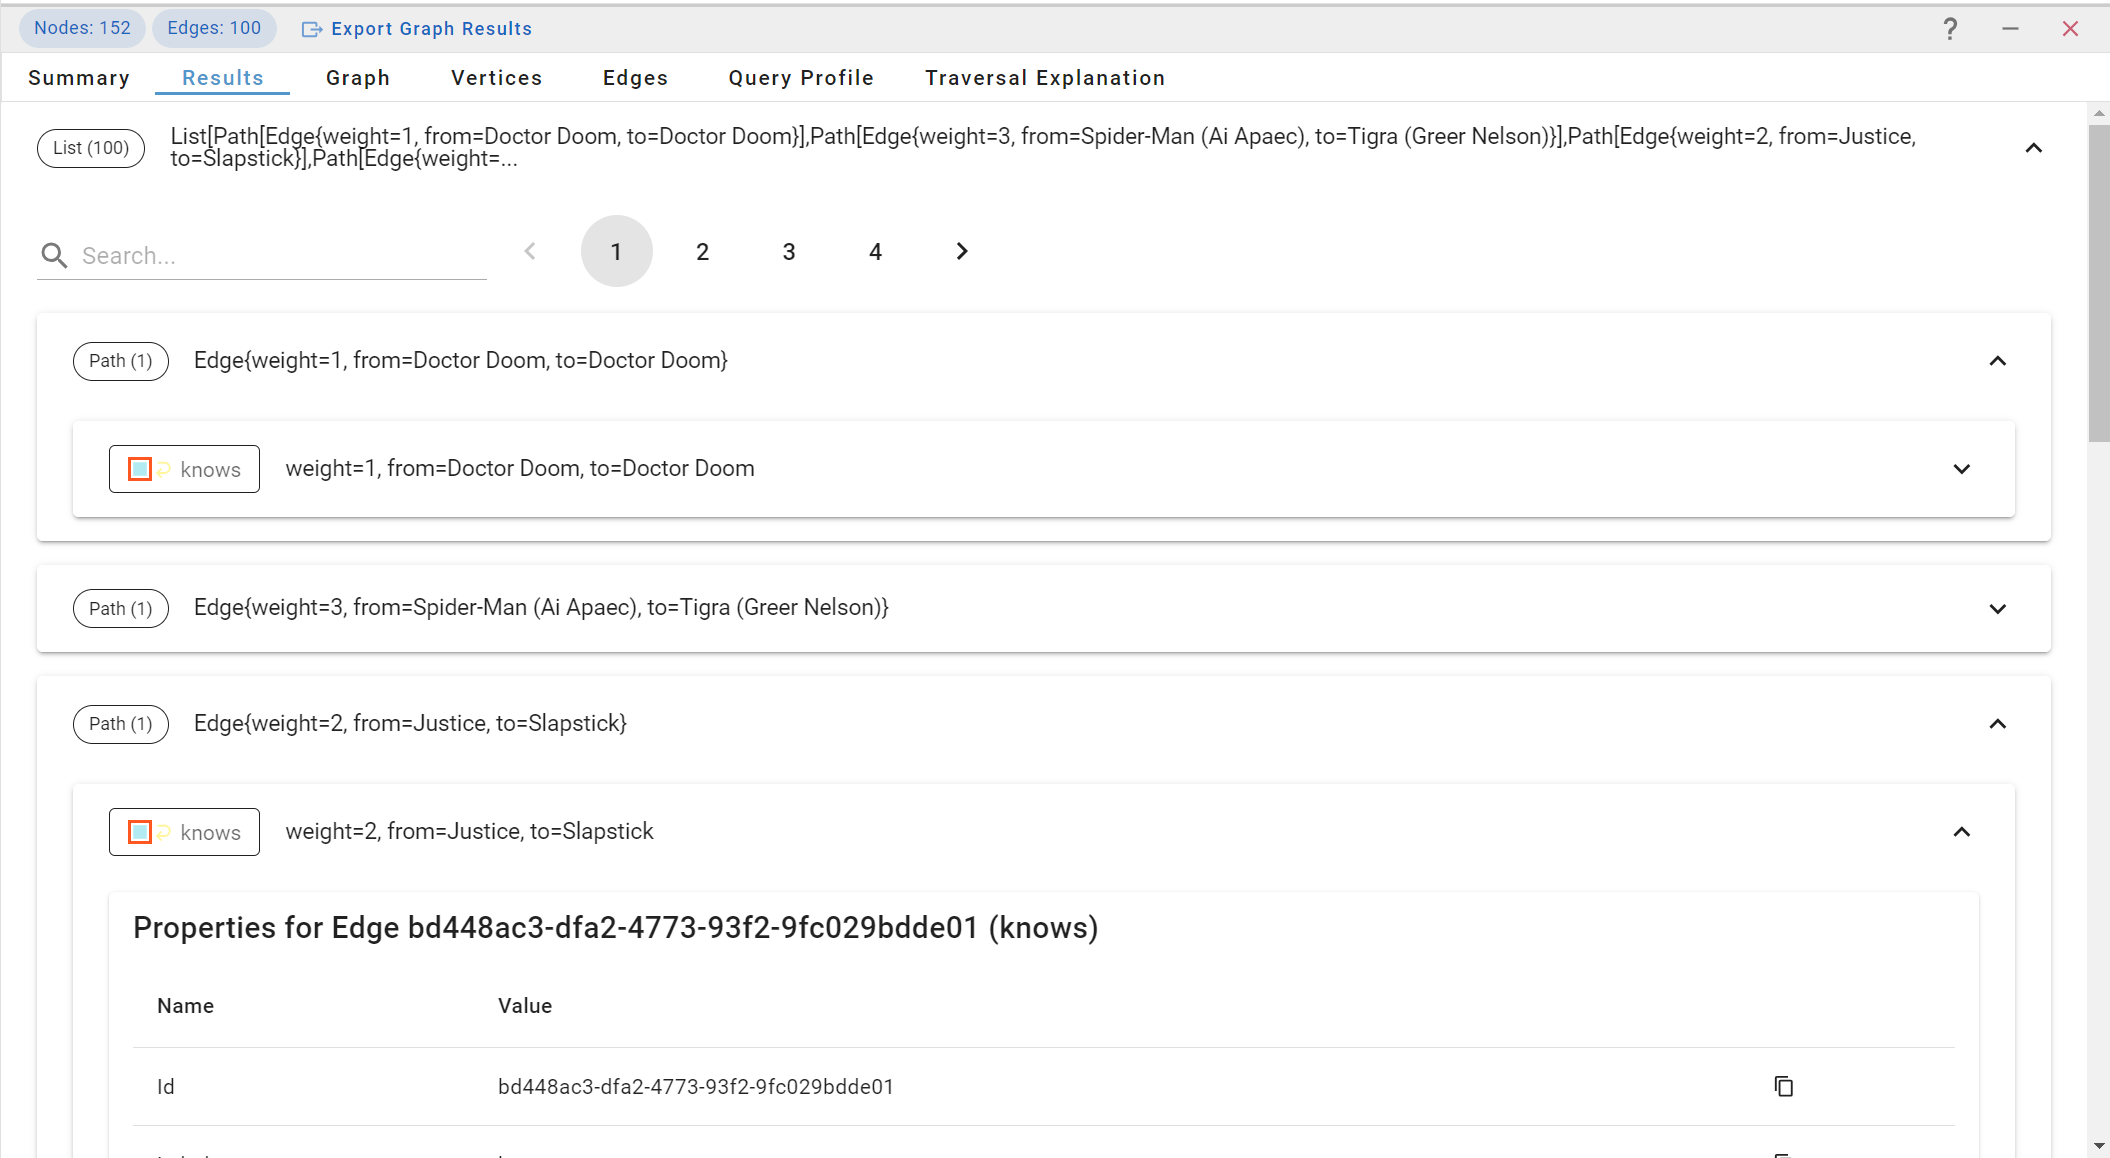
Object Browser gives you simple controls to complex object structures
- Object Browser: a filterable display of your results organized into easy to navigate panels based on the hierarchy of results (object, array, tree, etc)
Our data visualization software enables you to choose any color, size and label for your graph’s vertices and edges. You can also render images directly loaded from your elements’ properties. It’s easy to create custom visualization rules and seamlessly switch between them to deliver powerful visuals for your Aerospike data.
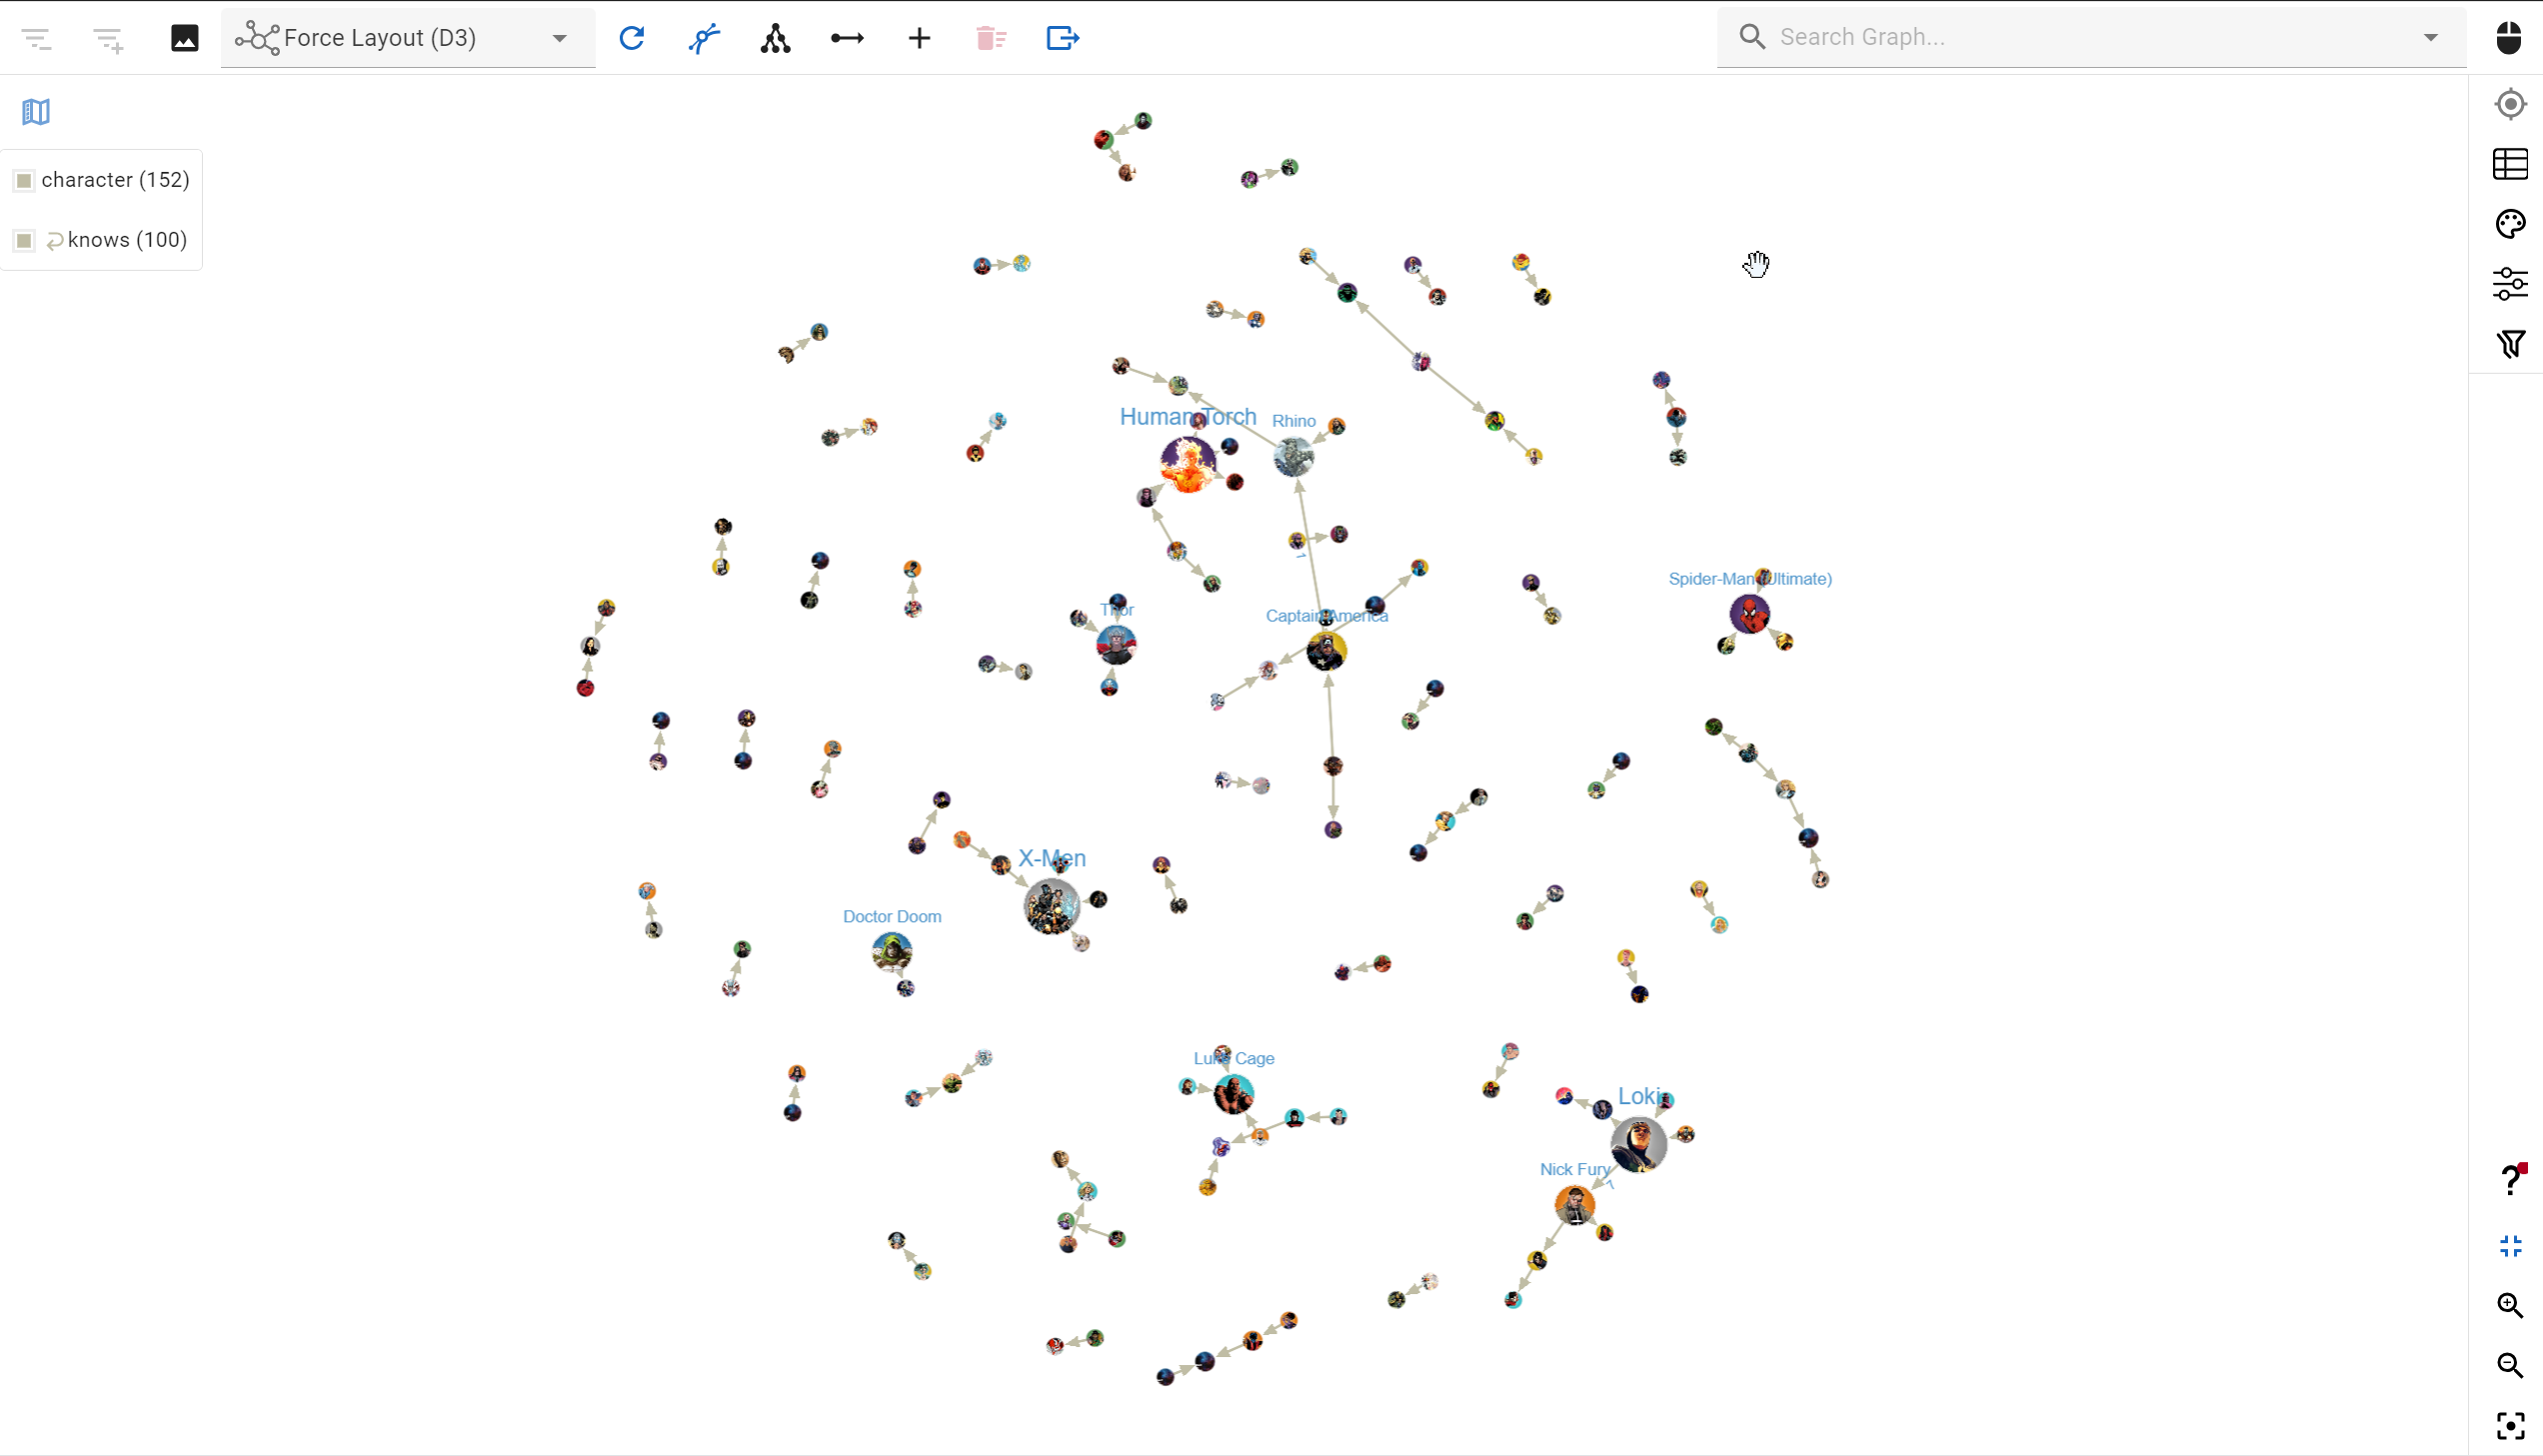
Apply graph styling and switch between styles seamlessly
Improve the way you visualize Aerospike data and try G.V() for free. Download our visualization tool and start a 60-day free trial today.
FAQs
Our developers work hand in hand with the Aerospike Database team to bring you a tool designed to optimize its offerings— G.V(). Download and trial Aerospike Graph and G.V() to deploy and explore graph data at unlimited scale.
The Ultimate Aerospike Graph Database Client
G.V() is a robust graph database client that can easily integrate and bolster your interaction with Aerospike. Further enhance Aerospike’s functionality with our plug-and-play facilities, which enable you to analyze various graph sources.
Our comprehensive graph visualization software can enhance productivity and is available on Windows, macOS and Linux, with a simple one-click installation process.
Our client runs locally on your device, with no complex deployment needed. This means that data remains entirely in the confines of your enterprise network, unlike cloud-based solutions.
Developed by Graph Database Experts, Tailored to Your Needs
G.V() is developed by a team of experienced developers. We work closely with users and database providers to deliver a continuously evolving, comprehensive visualization toolkit that meets their growing requirements.
If you have any valuable input or want to let us know more about your use case, please email us at support@gdotv.com or get in touch on Twitter (X). You can also follow us on LinkedIn for regular updates and previews of new feature releases of our software.
Revolutionize how you interact with graph databases using a unique and powerful Aerospike graph visualization tool — G.V(). Install our software and start your free trial today.
