Gremlin Graph Visualization Tool with Style Management Capabilities
Uncover and present complex information with our graph visualization tool for Apache TinkerPop graph databases.
What is Graph Visualization?
Graph visualizations allow for meaningful analysis of the information stored in your graph by highlighting trends and patterns in your data, making it easier for users to identify.
Graph visualizations are a helpful way to display information. They take complex data and convert it into graphs that are easy to understand and navigate. Our graph database client, G.V(), makes creating interactive graph visualizations effortless.
A graph consists of nodes and edges, with nodes representing the entities of your graph and the edges representing the relationships between the elements. Put together, they form a network that is best represented visually as a graph structure.
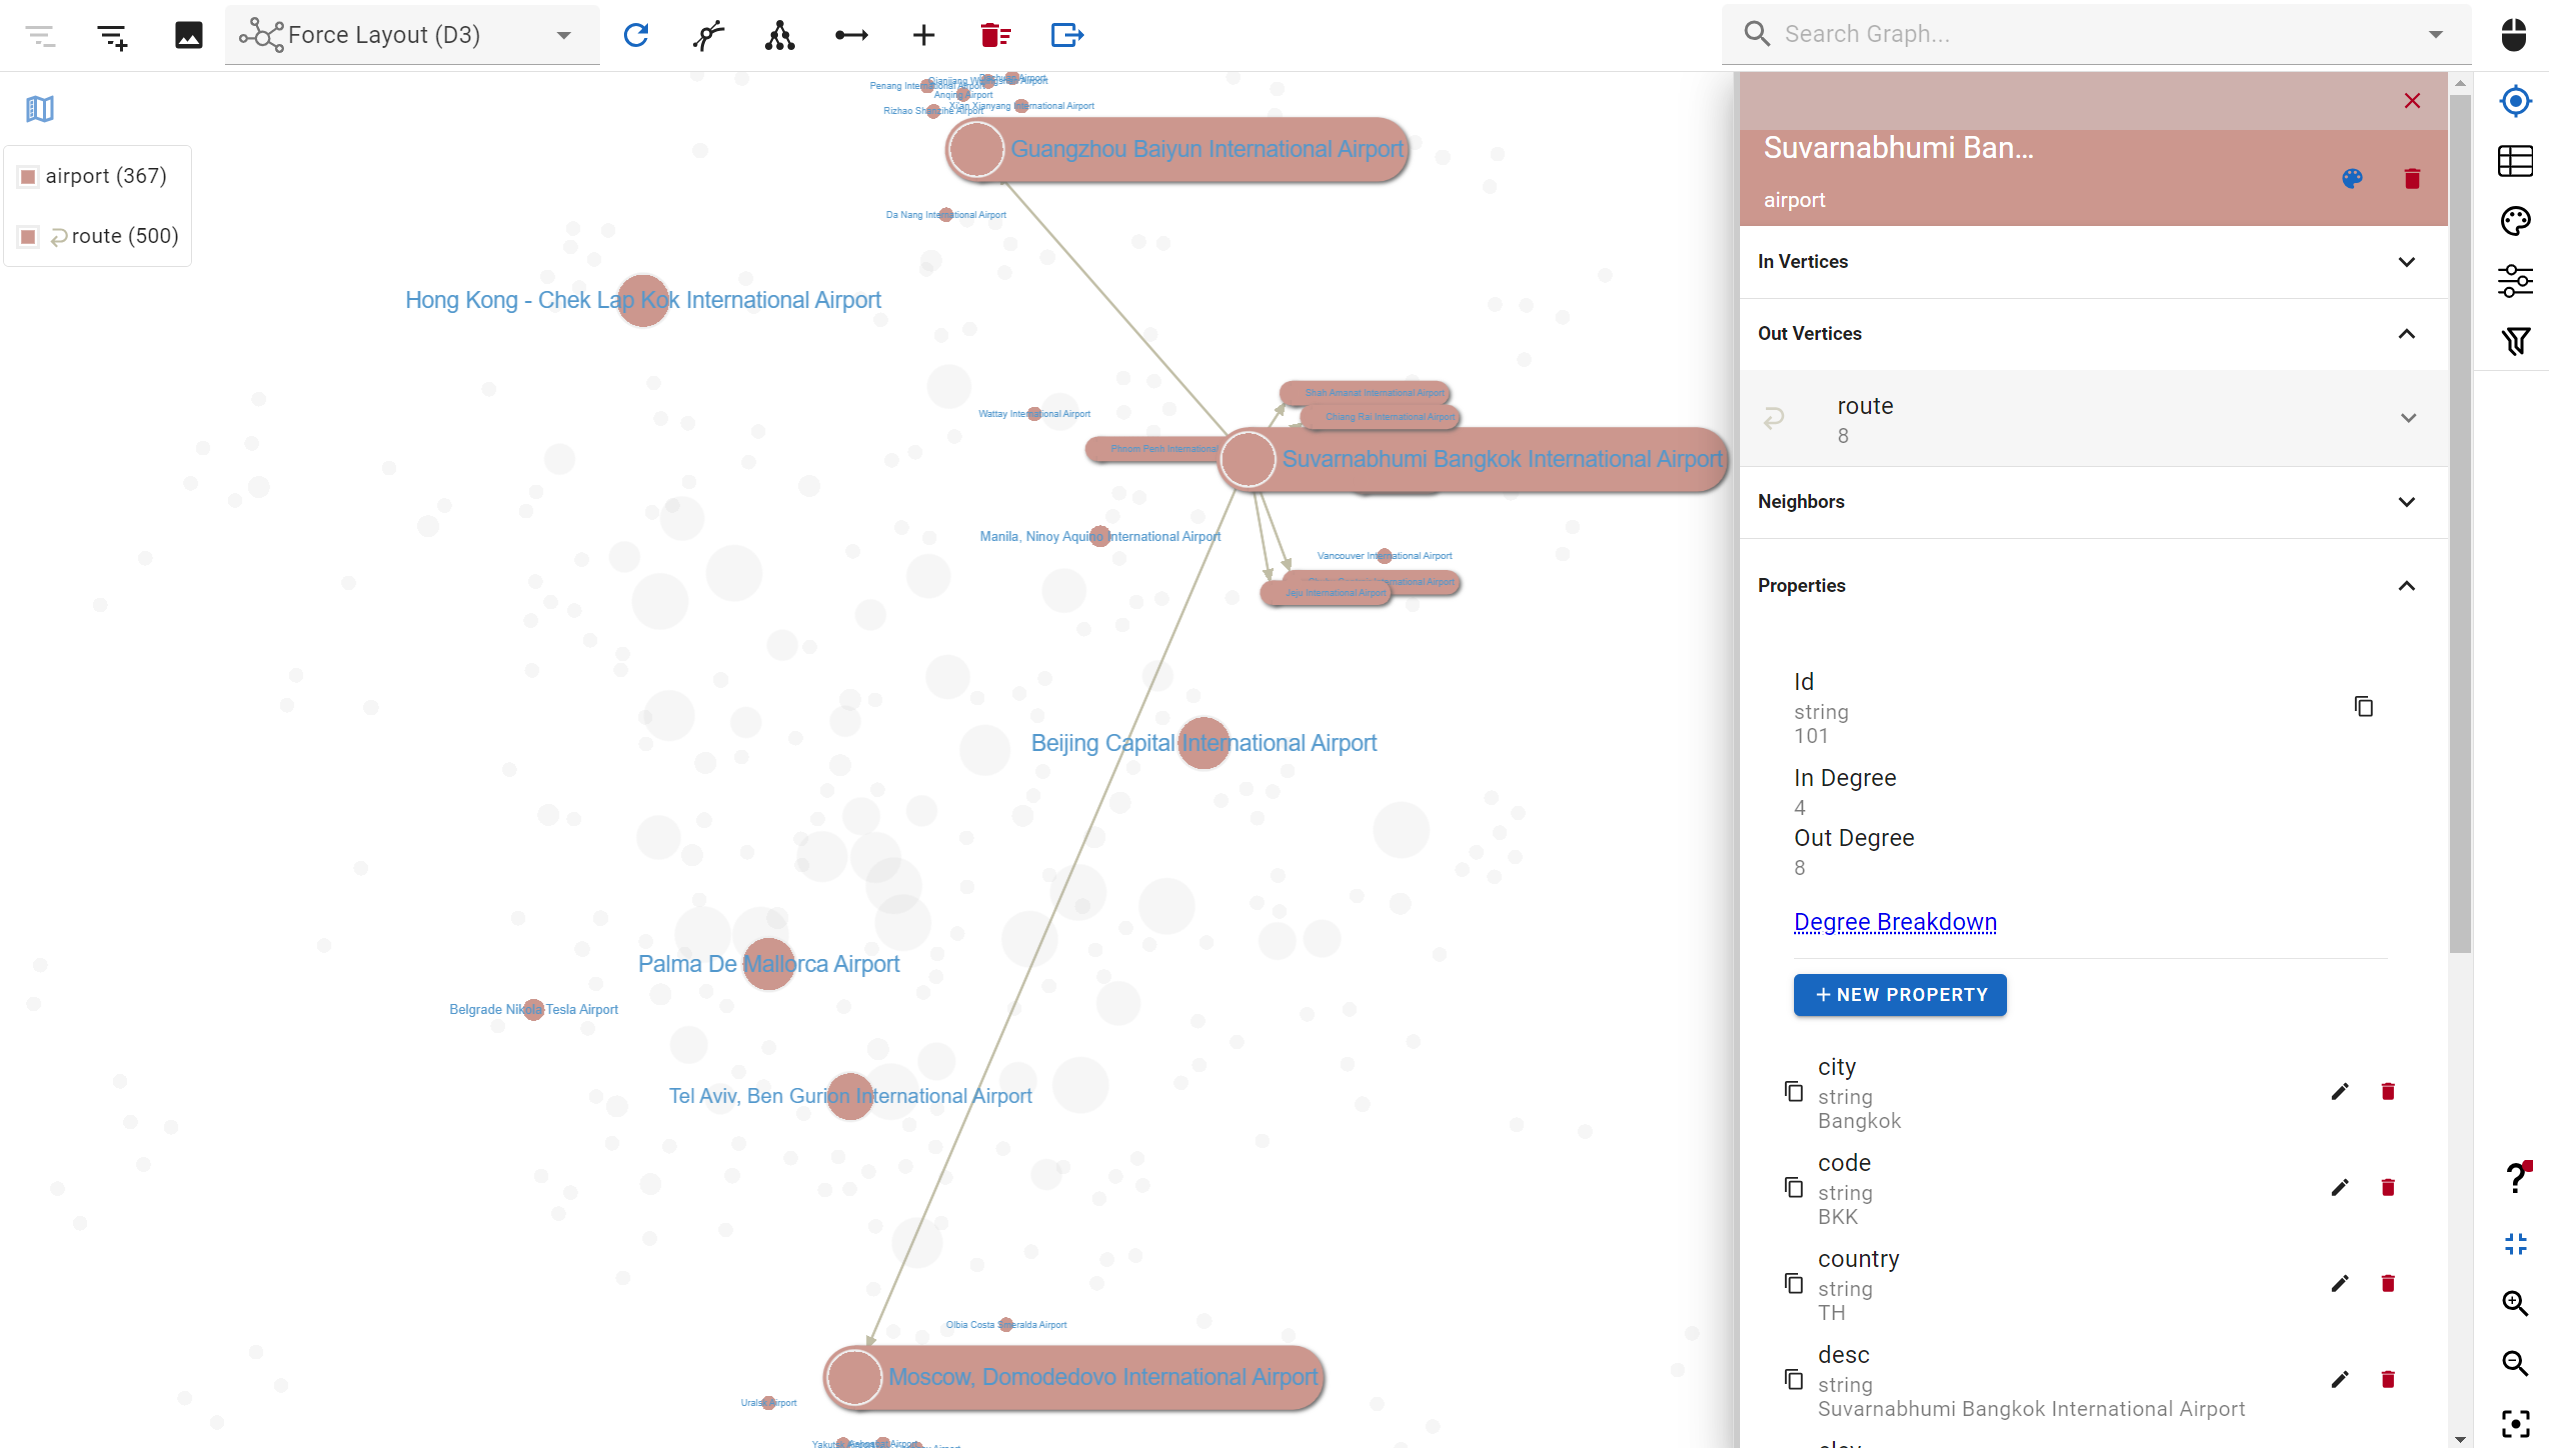
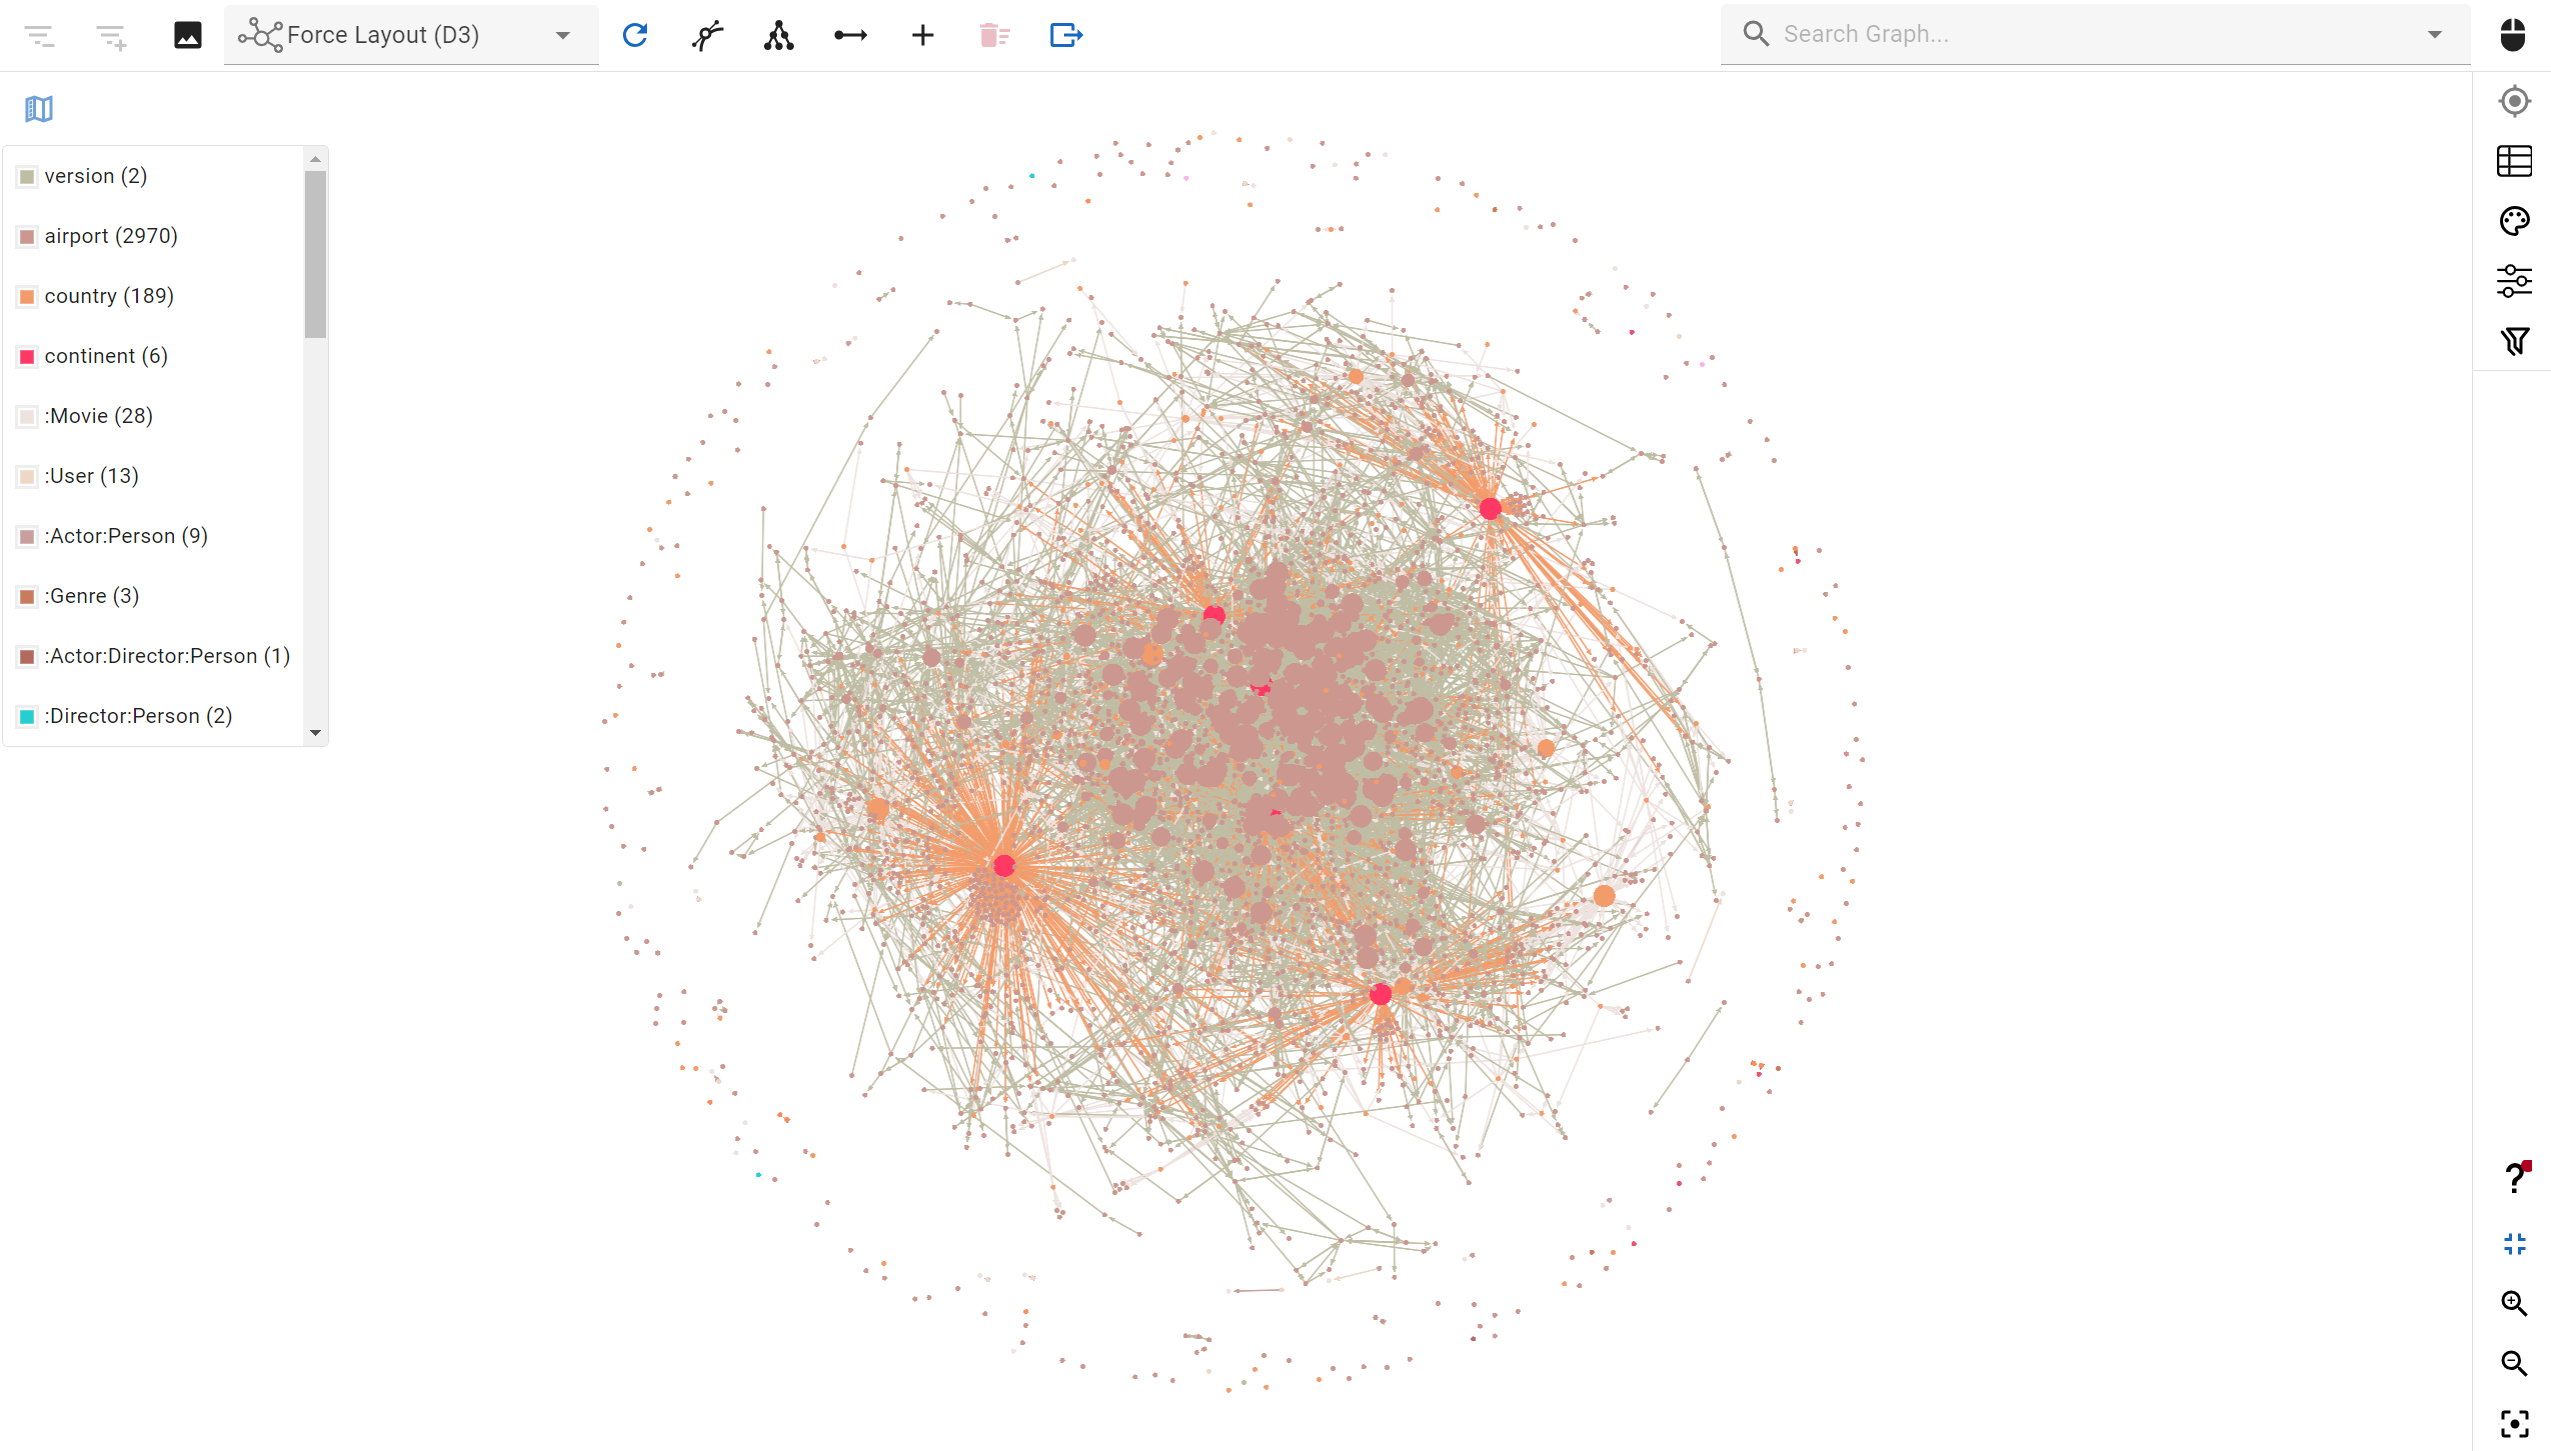
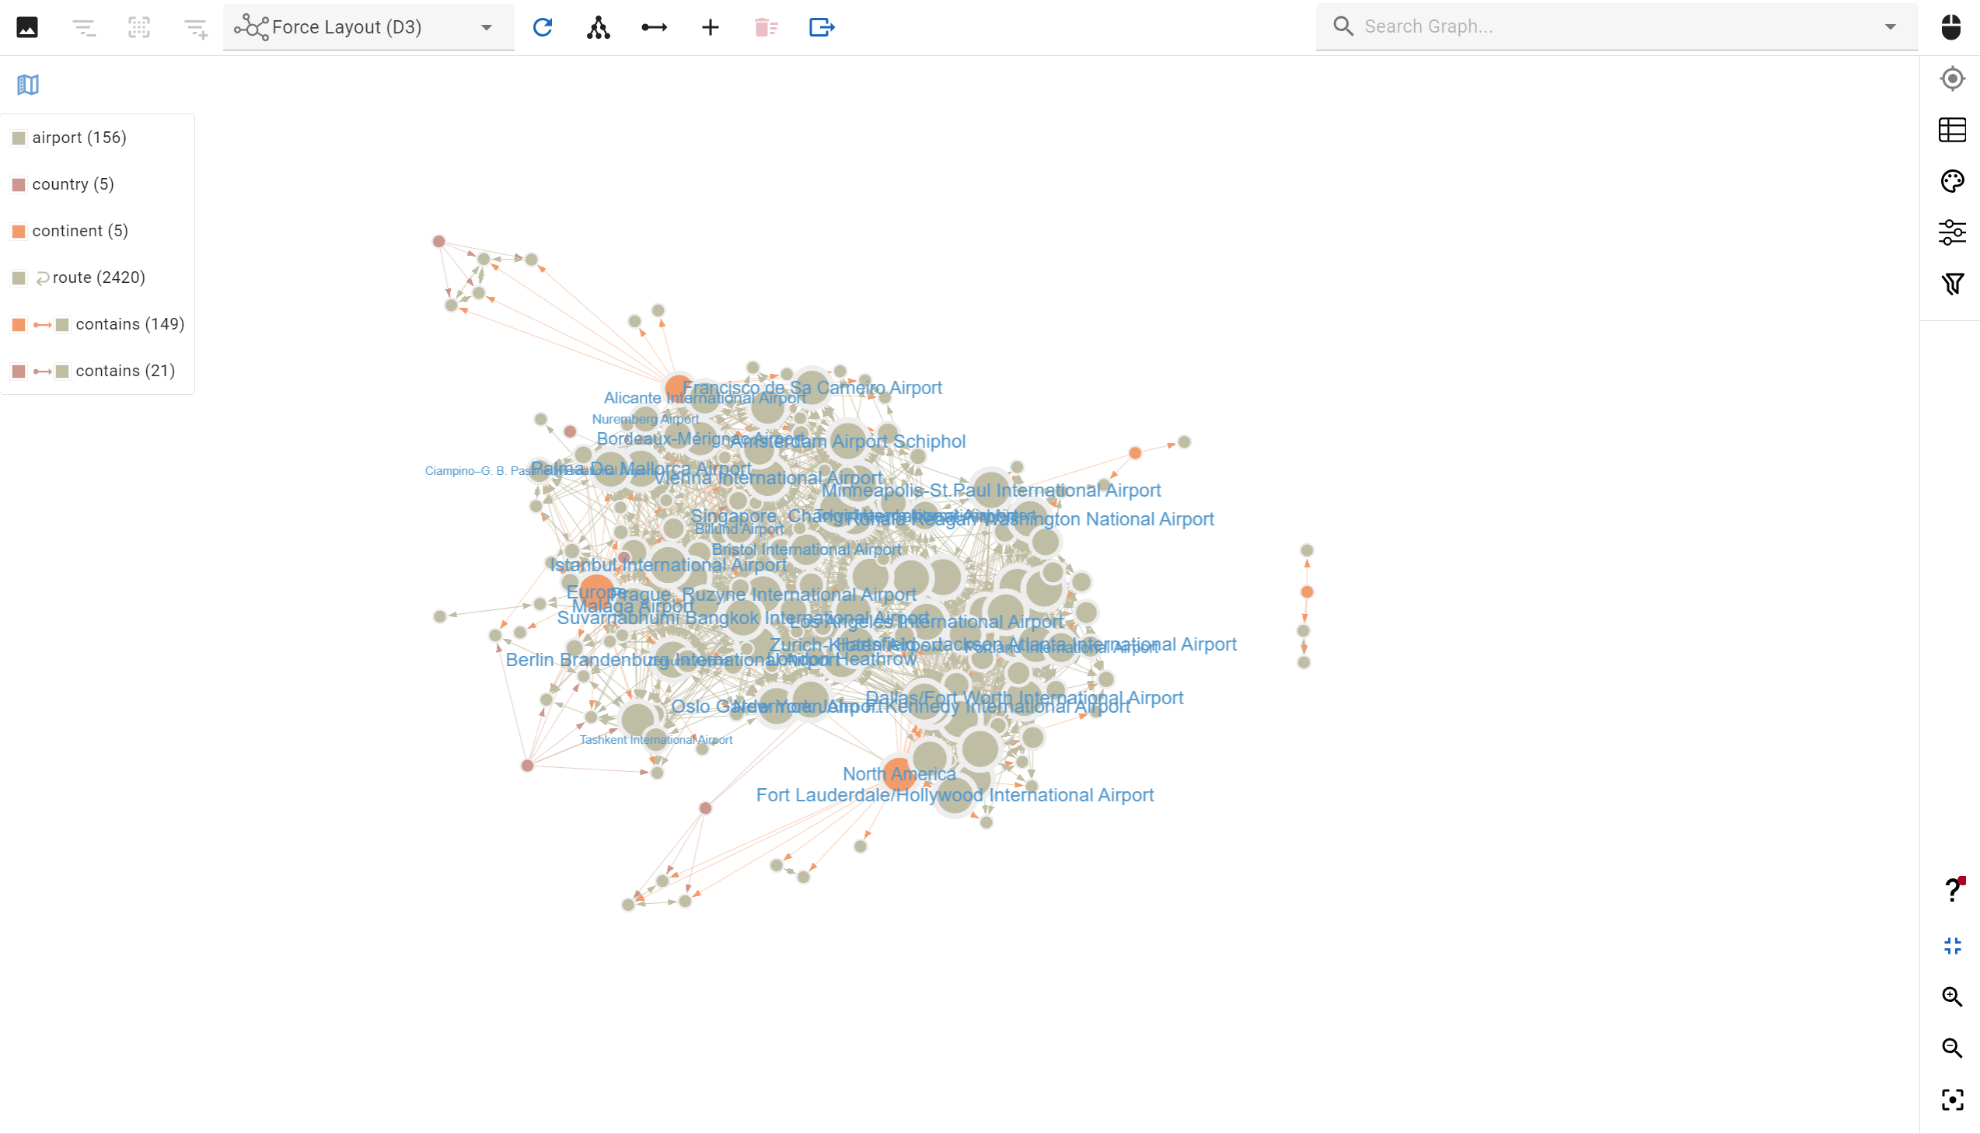
A sample output of airports and routes displayed as a graph on G.V()
G.V() is a feature rich visualization tool that enables querying graph databases to produce graph visualization, with graph layout, functional style management capabilities, interactive navigation and many more capabilities.
Create interactive graphs and generate visual insights from your graph database with G.V() today.
Sign up for a free trial and get access to our full suite of data visualization tools.
Our Graph Visualization & Styling Features
G.V() offers comprehensive settings to customize the look and feel of data extracted from your Gremlin graph database. It is also aware of the nature of your element properties, allowing you to open and view external URLs with ease, images stored in your database, and export them easily.
Here are just some of the stand-out offerings our database client provides:
Choose from Various Graph Layout Options
Our visualization tools allows you to change the way the results of your Gremlin queries are presented on your graph. You can apply layouts to your graph data according to various algorithms.
G.V() provides algorithms that don’t require coding capabilities but still allow you to present your data model in compelling ways. You have the option to visualize your queries in different layouts, such as:
- Force-directed layout: G.V()’s default layout uses the force-directed algorithm, which places the elements with the most connections in the center of the graph, expanding outward to show connections with fewer relationships. This algorithm is great to visualize graphs with many elements
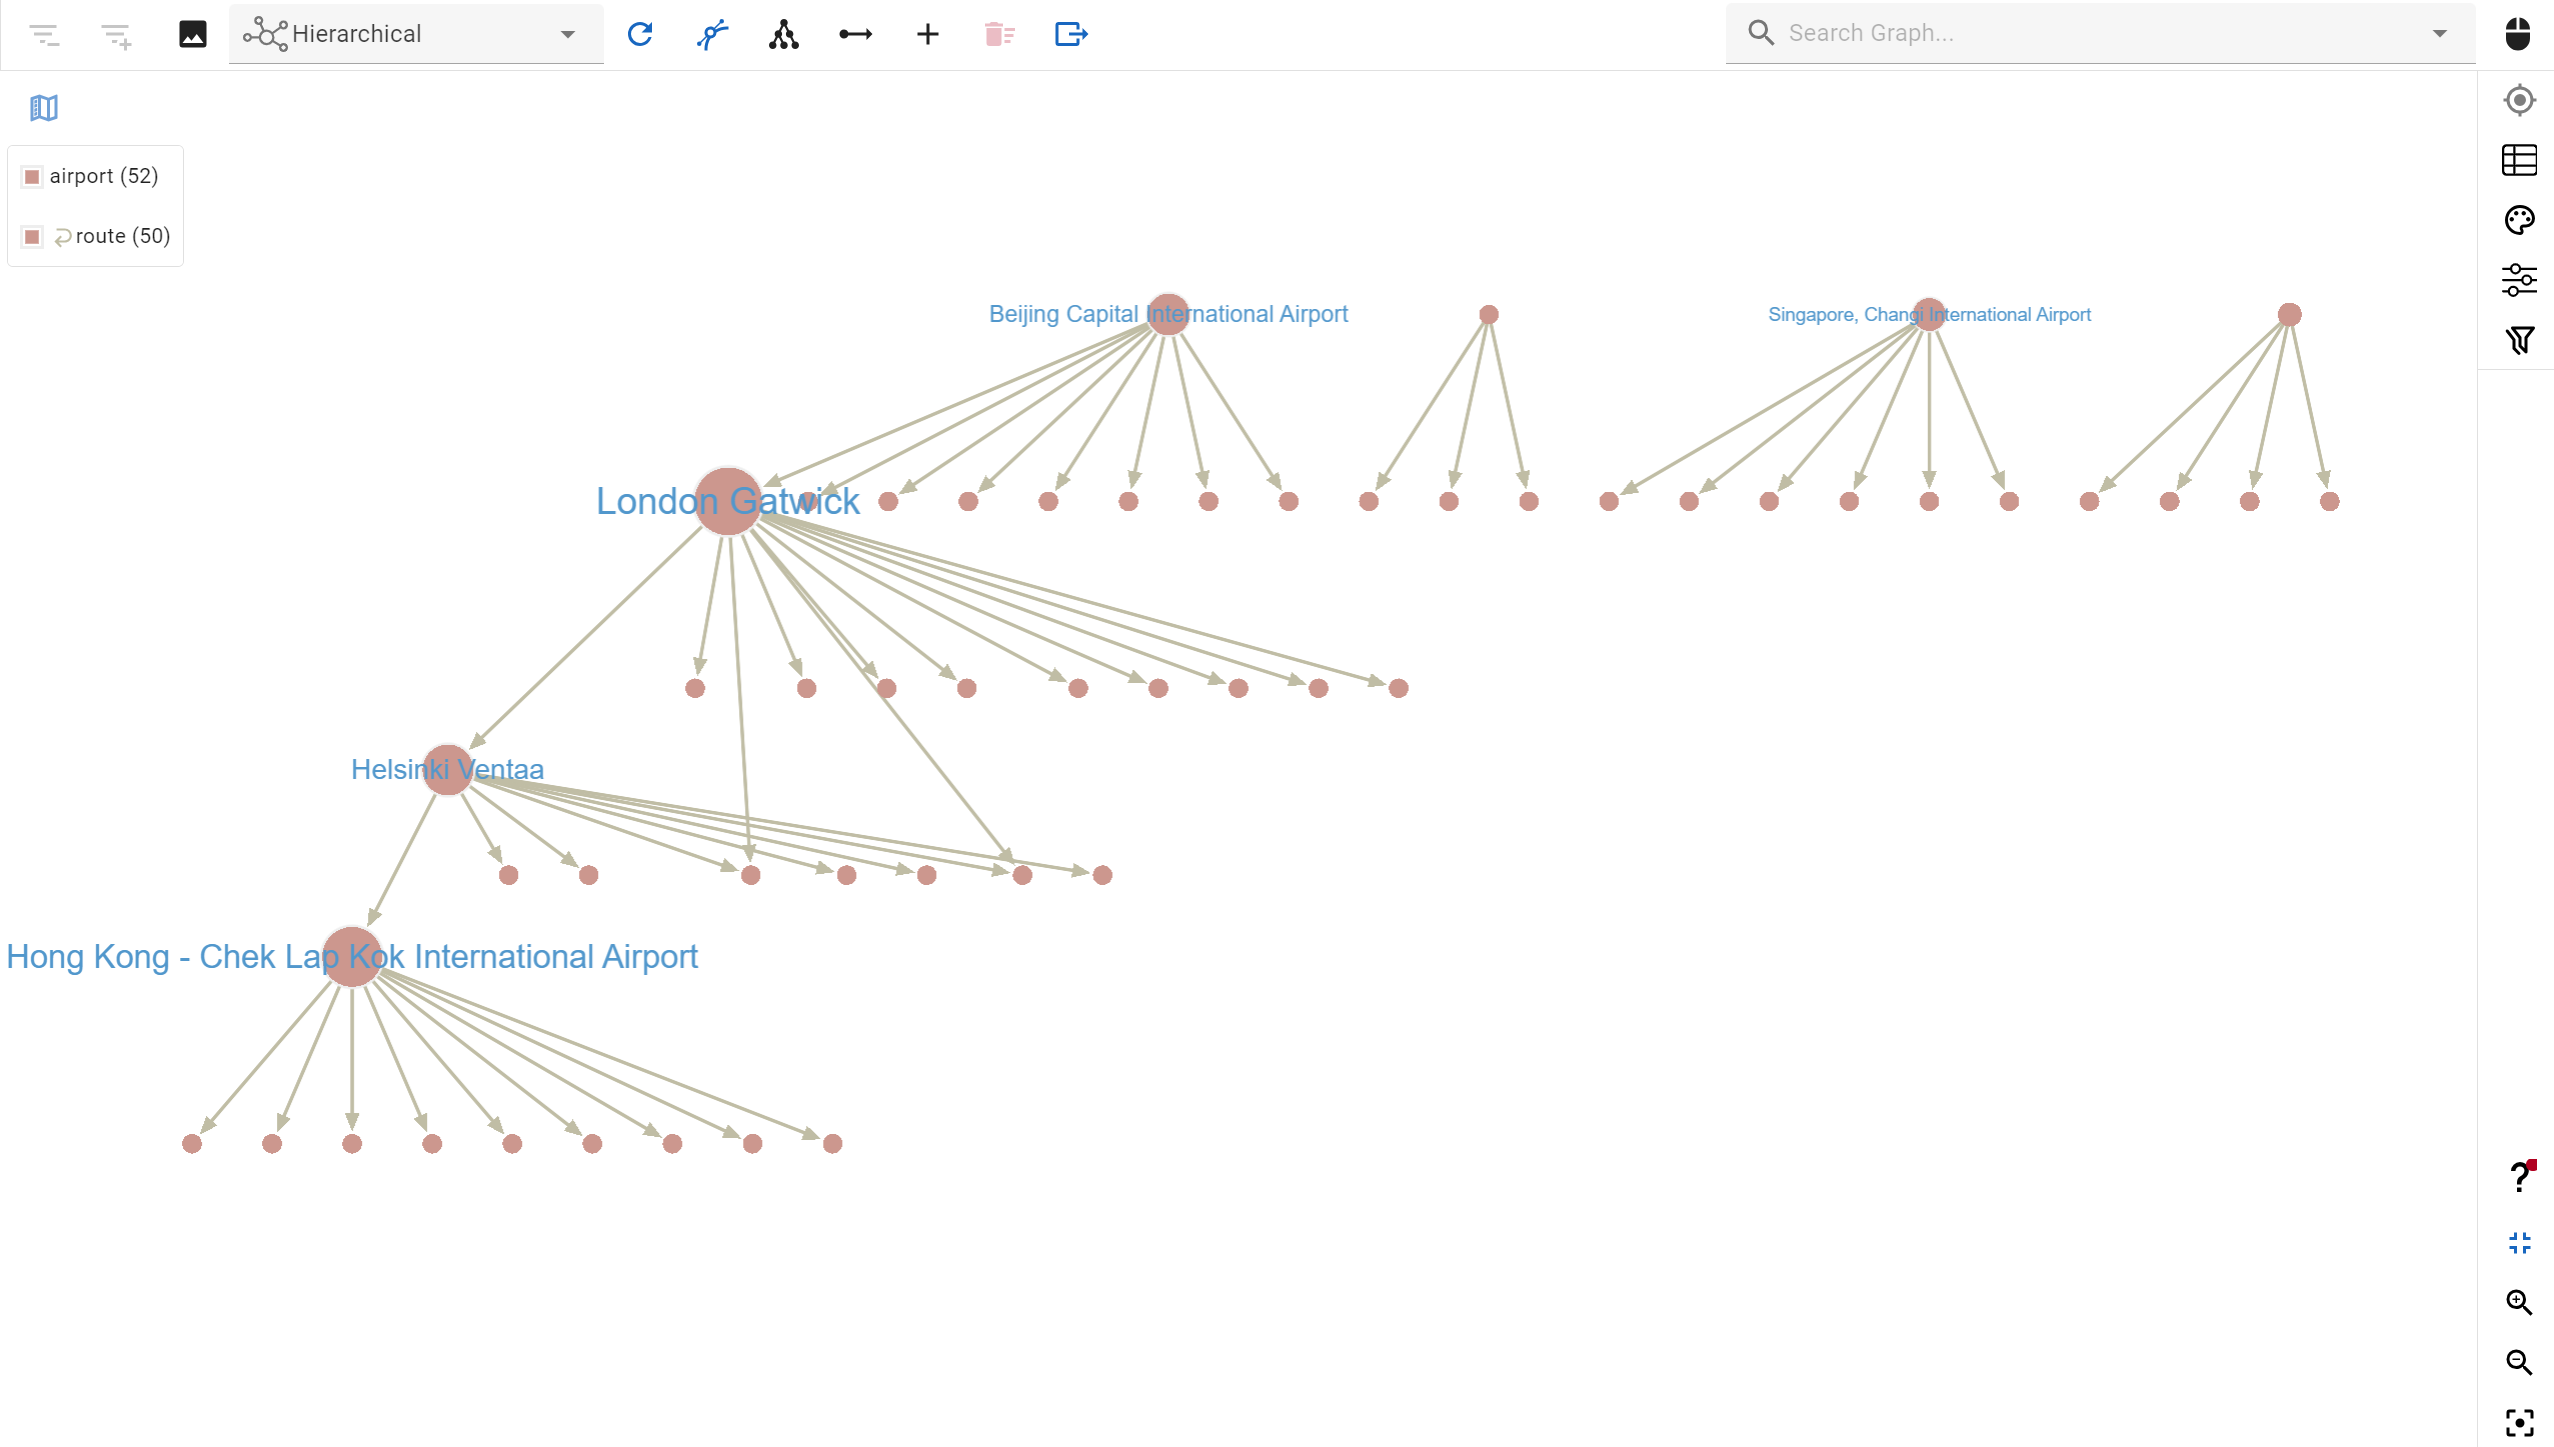
- Hierarchical layout: Presents graph queries in the form of a tree, with the most connected vertices forming the upper branches. The lower the tree goes, the fewer relationships there are. This layout is perfect for displaying organizational charts and viewing hierarchical structures.
- Grid layout: Visualize your data in an evenly spaced out grid ranked from most to least connected vertices. The nodes are displayed in an ordered sequence giving you a symmetrical view of connected links.
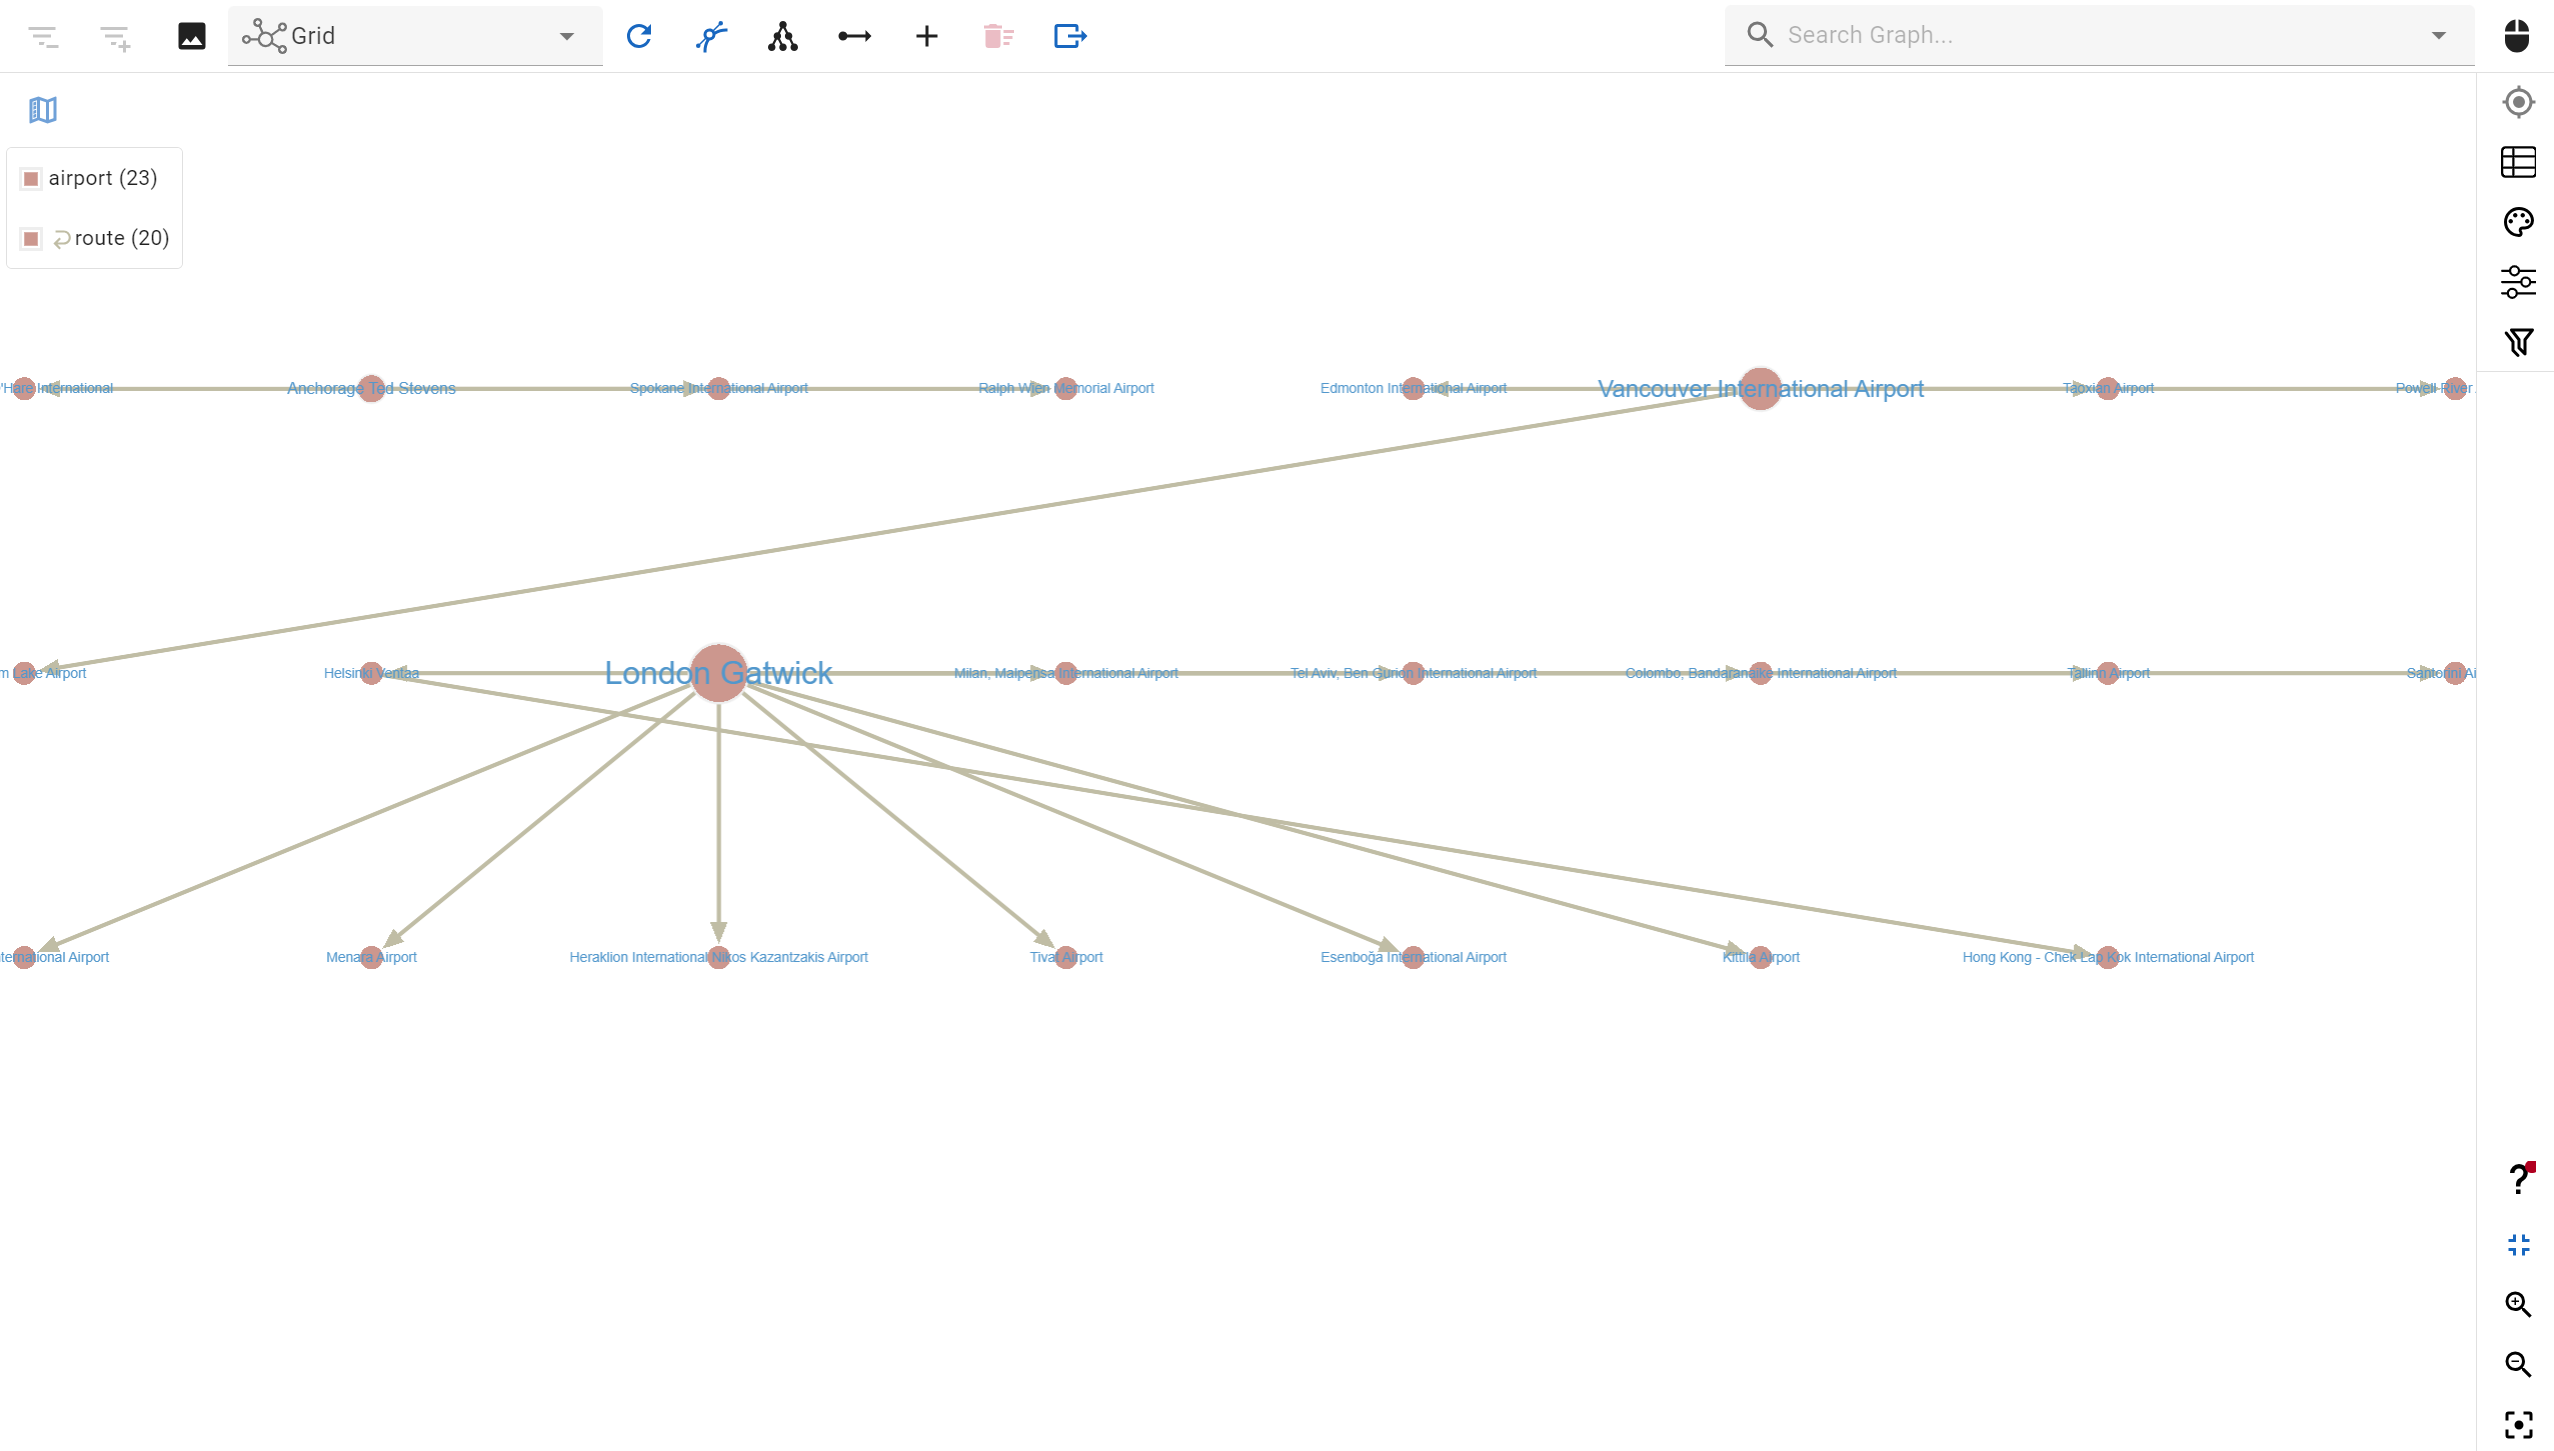
Grid layout: Visualize your data in an evenly spaced out grid ranked from most to least connected vertices. The nodes are displayed in an ordered sequence giving you a symmetrical view of connected links.
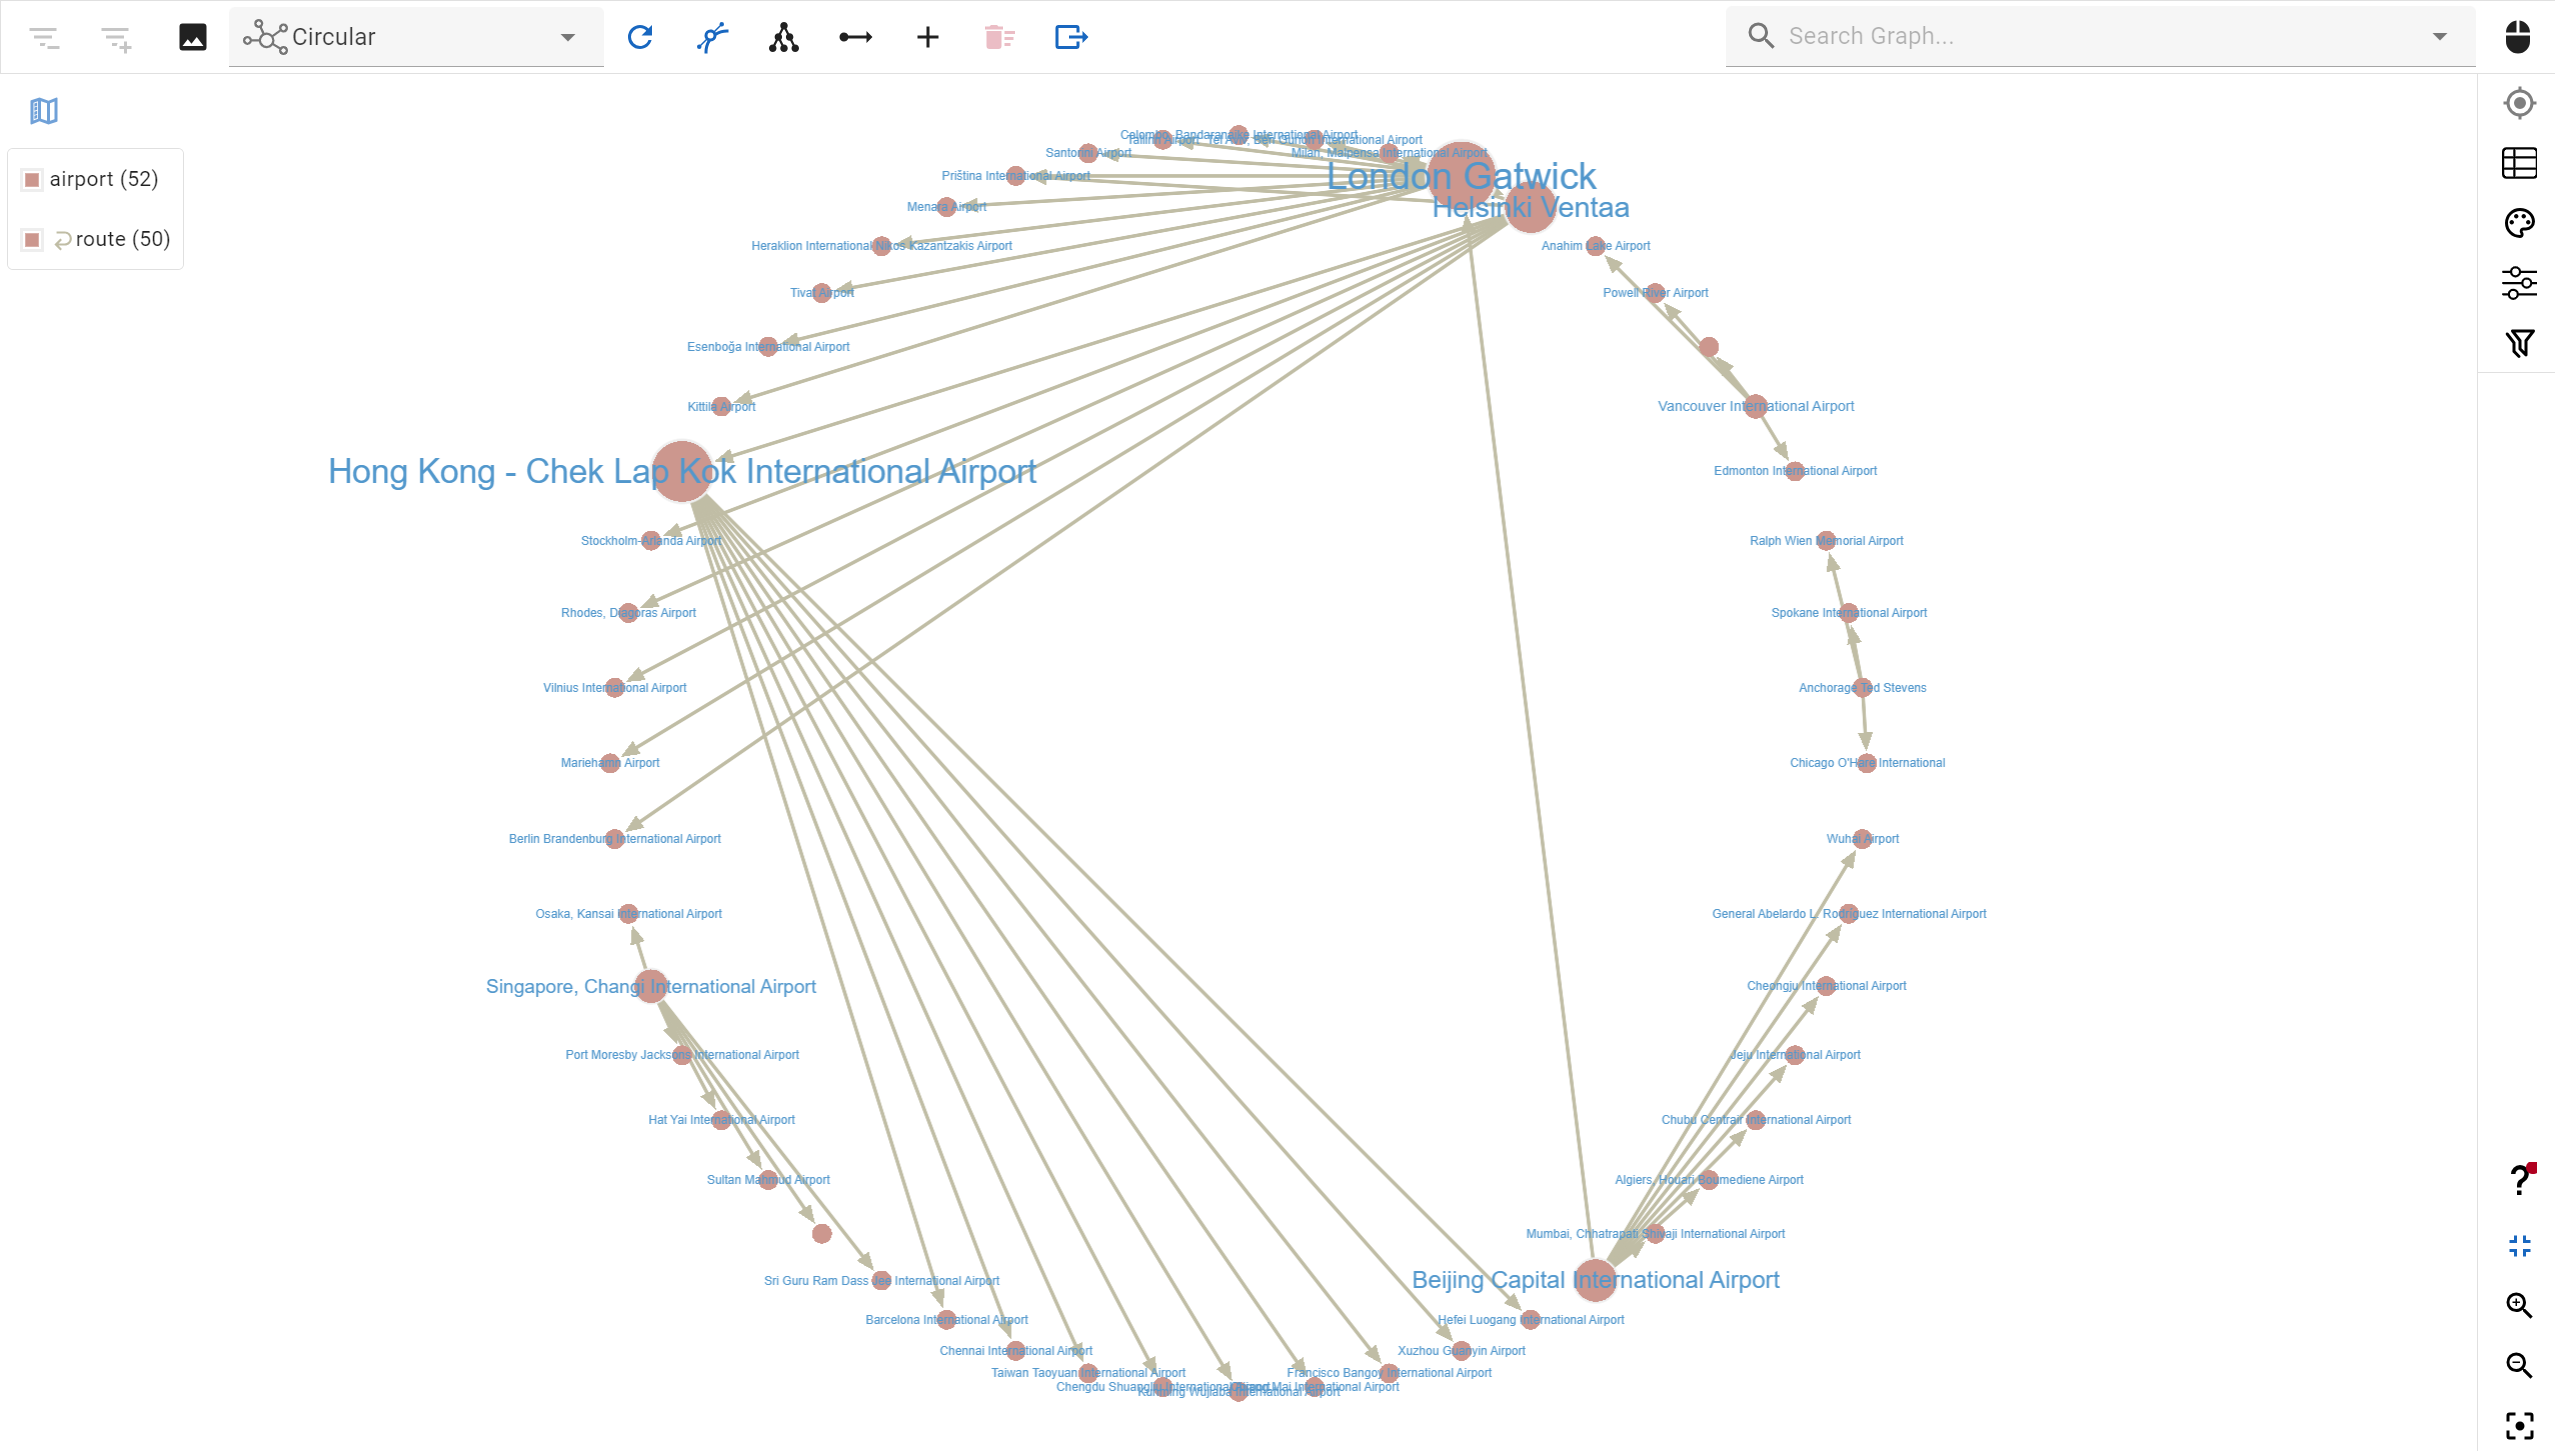
- Circular layout: This simplified view organizes the data in a circle. Vertices are displayed on the circumference with the relationships displayed across the surface. It is best suited for smaller, weakly connected graphs.
These are just some example algorithms G.V() offers. Choose which visualization
layout works best for your graph data structure to ensure you gain maximum insight.
Interactive Data Loading
and Graphing
With G.V(), you can instantly generate graph visualizations and navigate them interactively. With knowledge of your graph data model, our user interface allows you to load incoming or outgoing relationships from nodes based on the type (or label) of the edge.
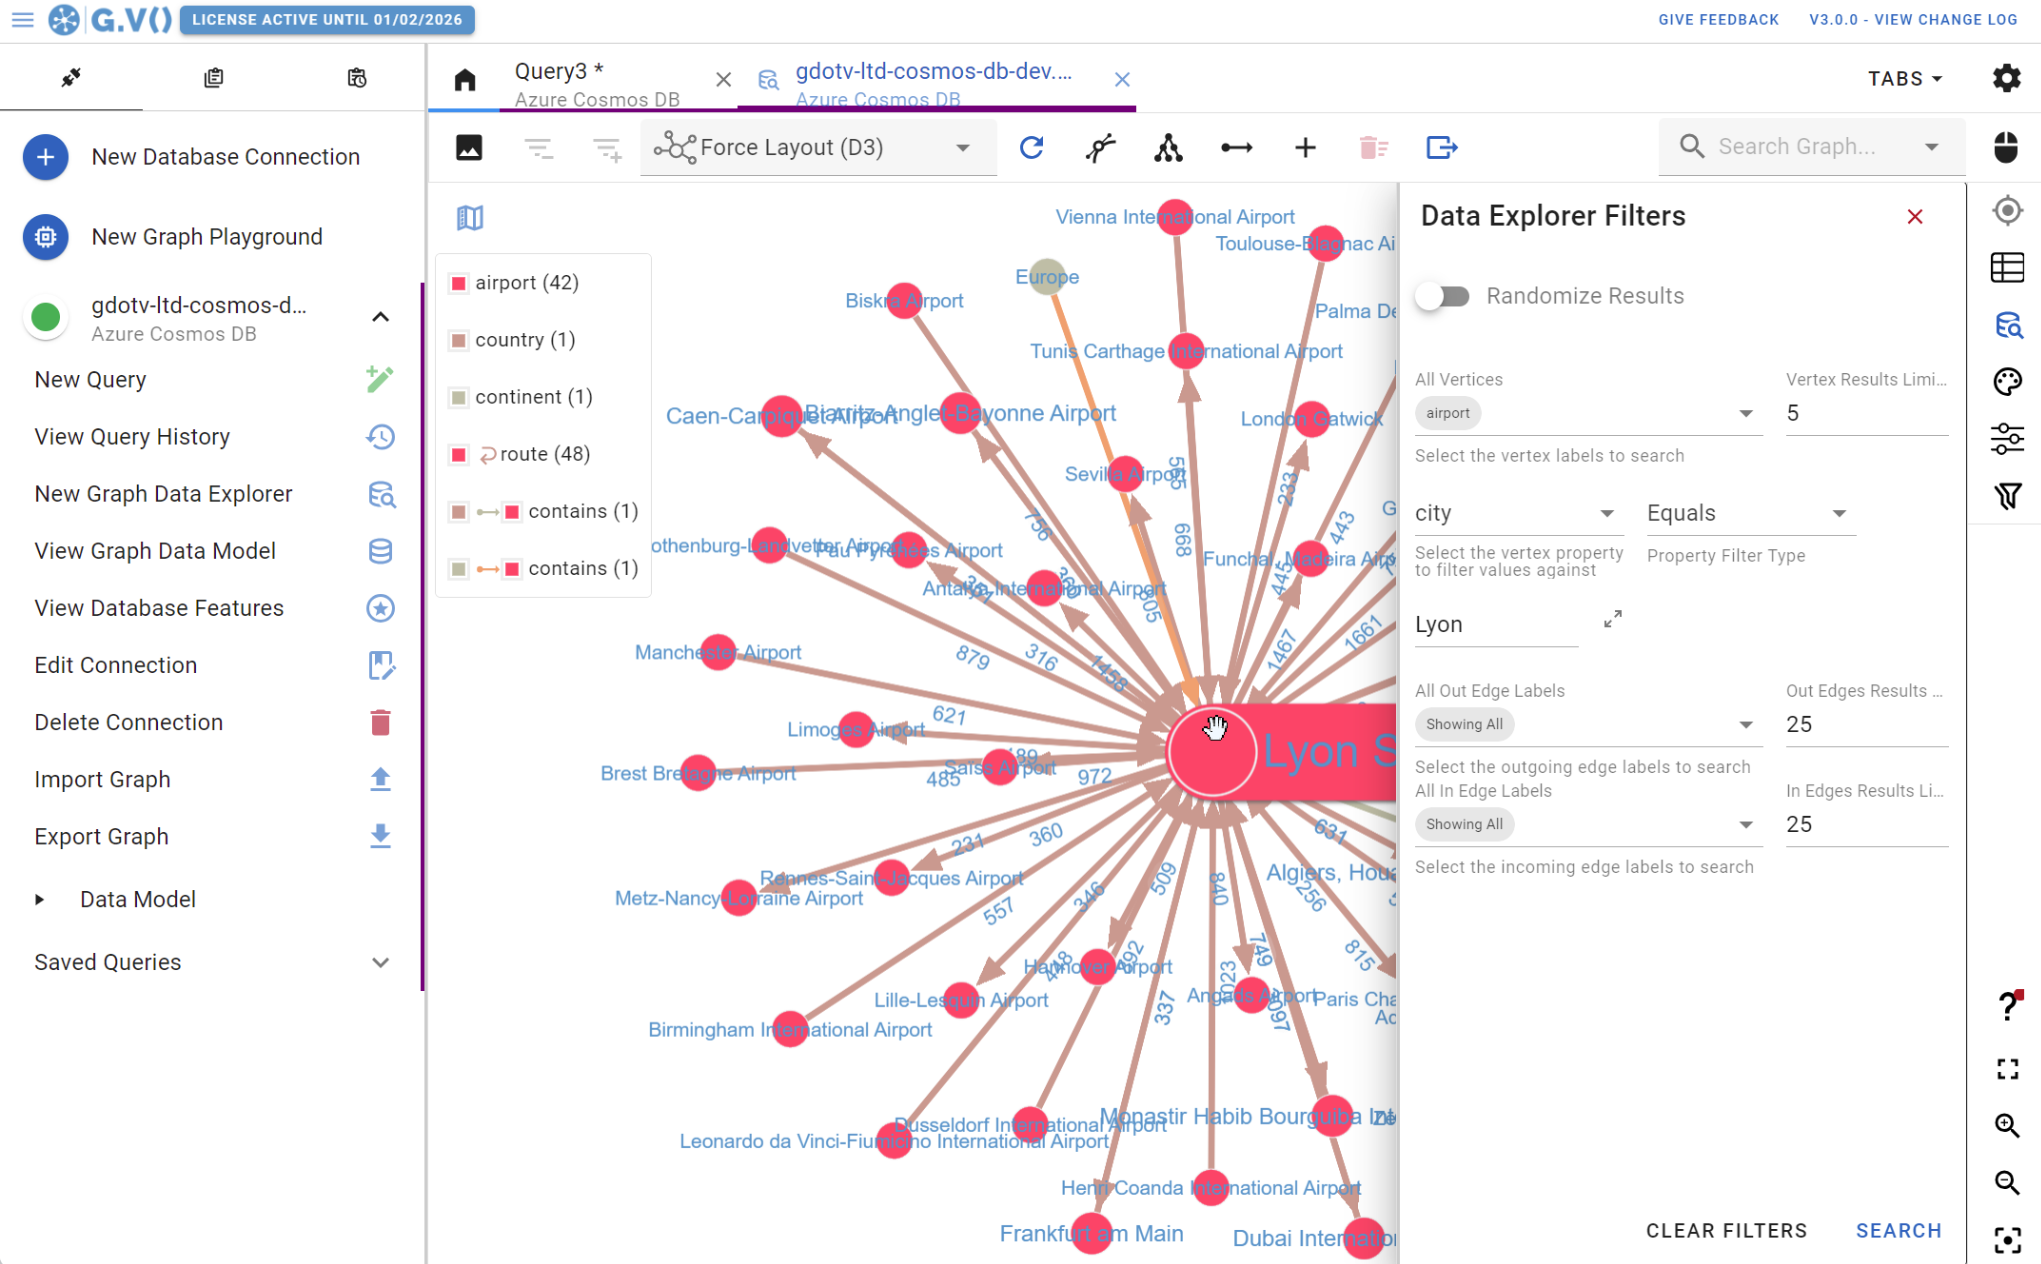
Our graph data explorer allows you to fetch data directly from your graph database using simple but powerful filters, without the need to write a Gremlin query. Specify your data loading requirements and G.V() will load them directly from your database, then display them on the graph view. You can open and compare data explorers easily, load additional data in a couple of clicks and reset the graph to its original state with the press of a button.
Our graph legend component lets you highlight different elements based on the labels you want to see — easily cutting through the multitudes of data and showcasing the most important information you need to review and interact with.
Helpful Data Filters to Interact With Large Data Sources
G.V()’s graph explorer can display large amounts of data from your stored entities in an easy-to-understand format. Our graph rendering engine is optimized for large graph displays of tens of thousands of elements.
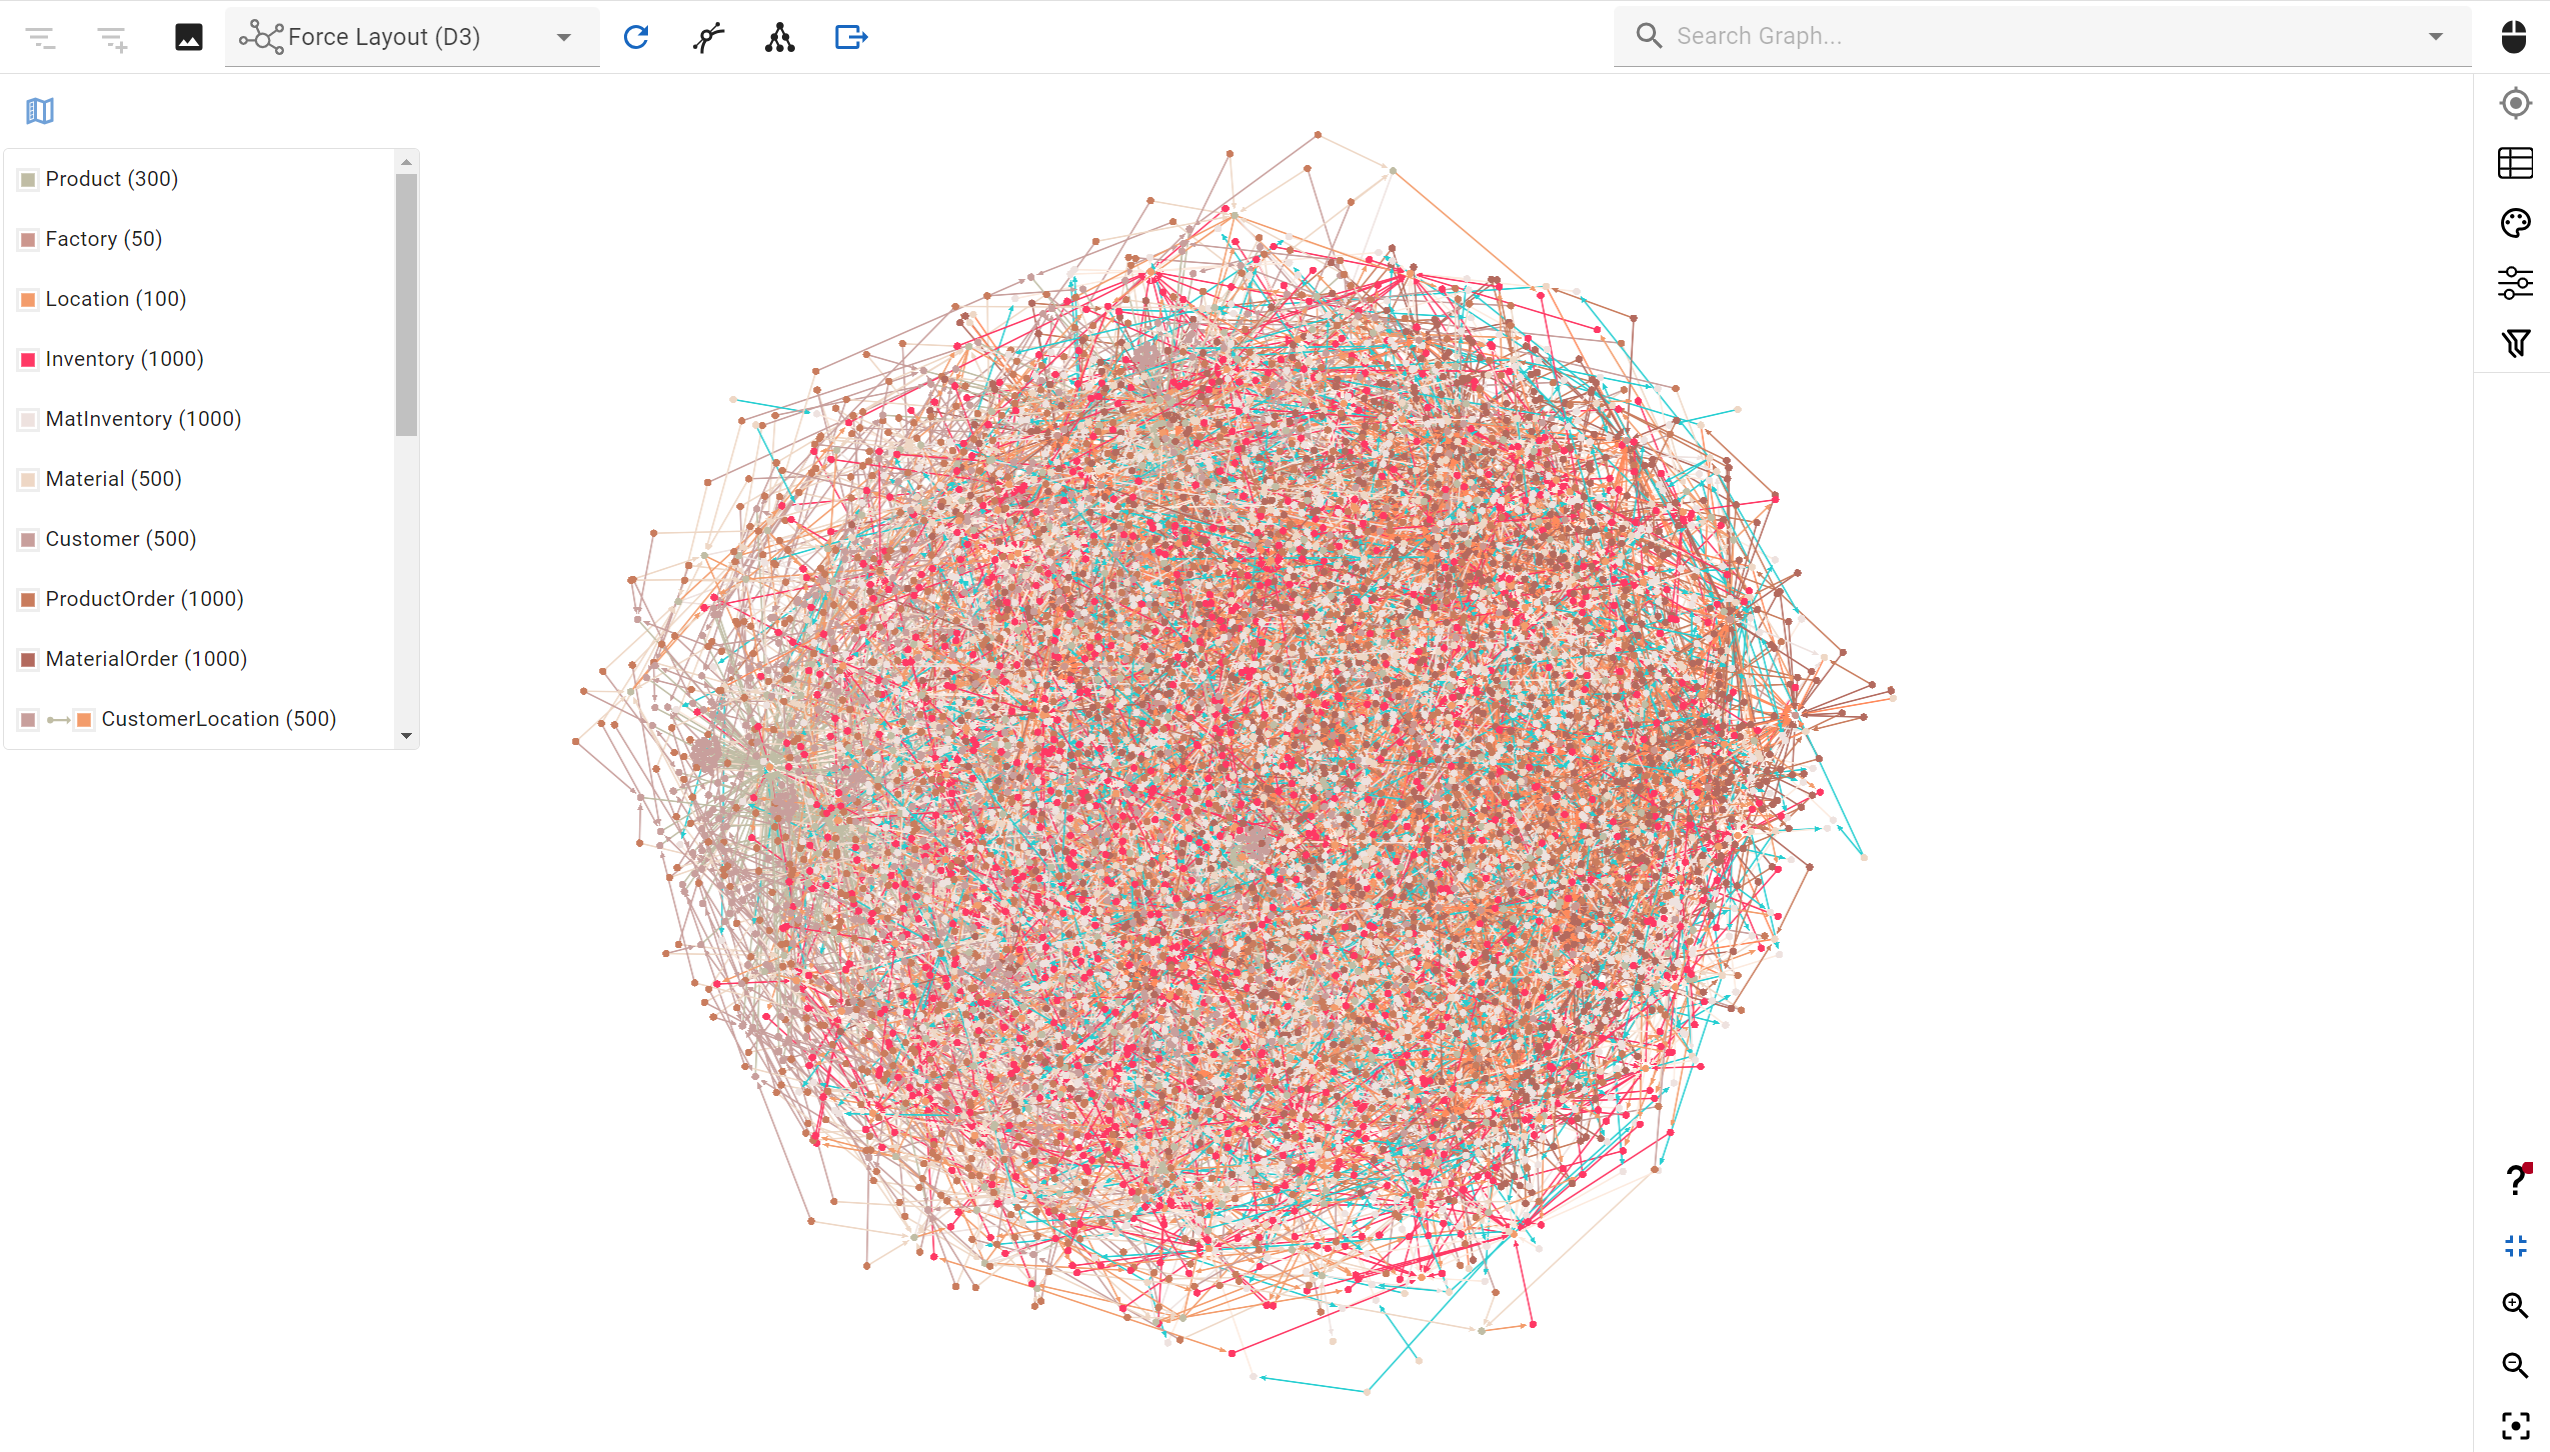
Display and filter large graphs with ease
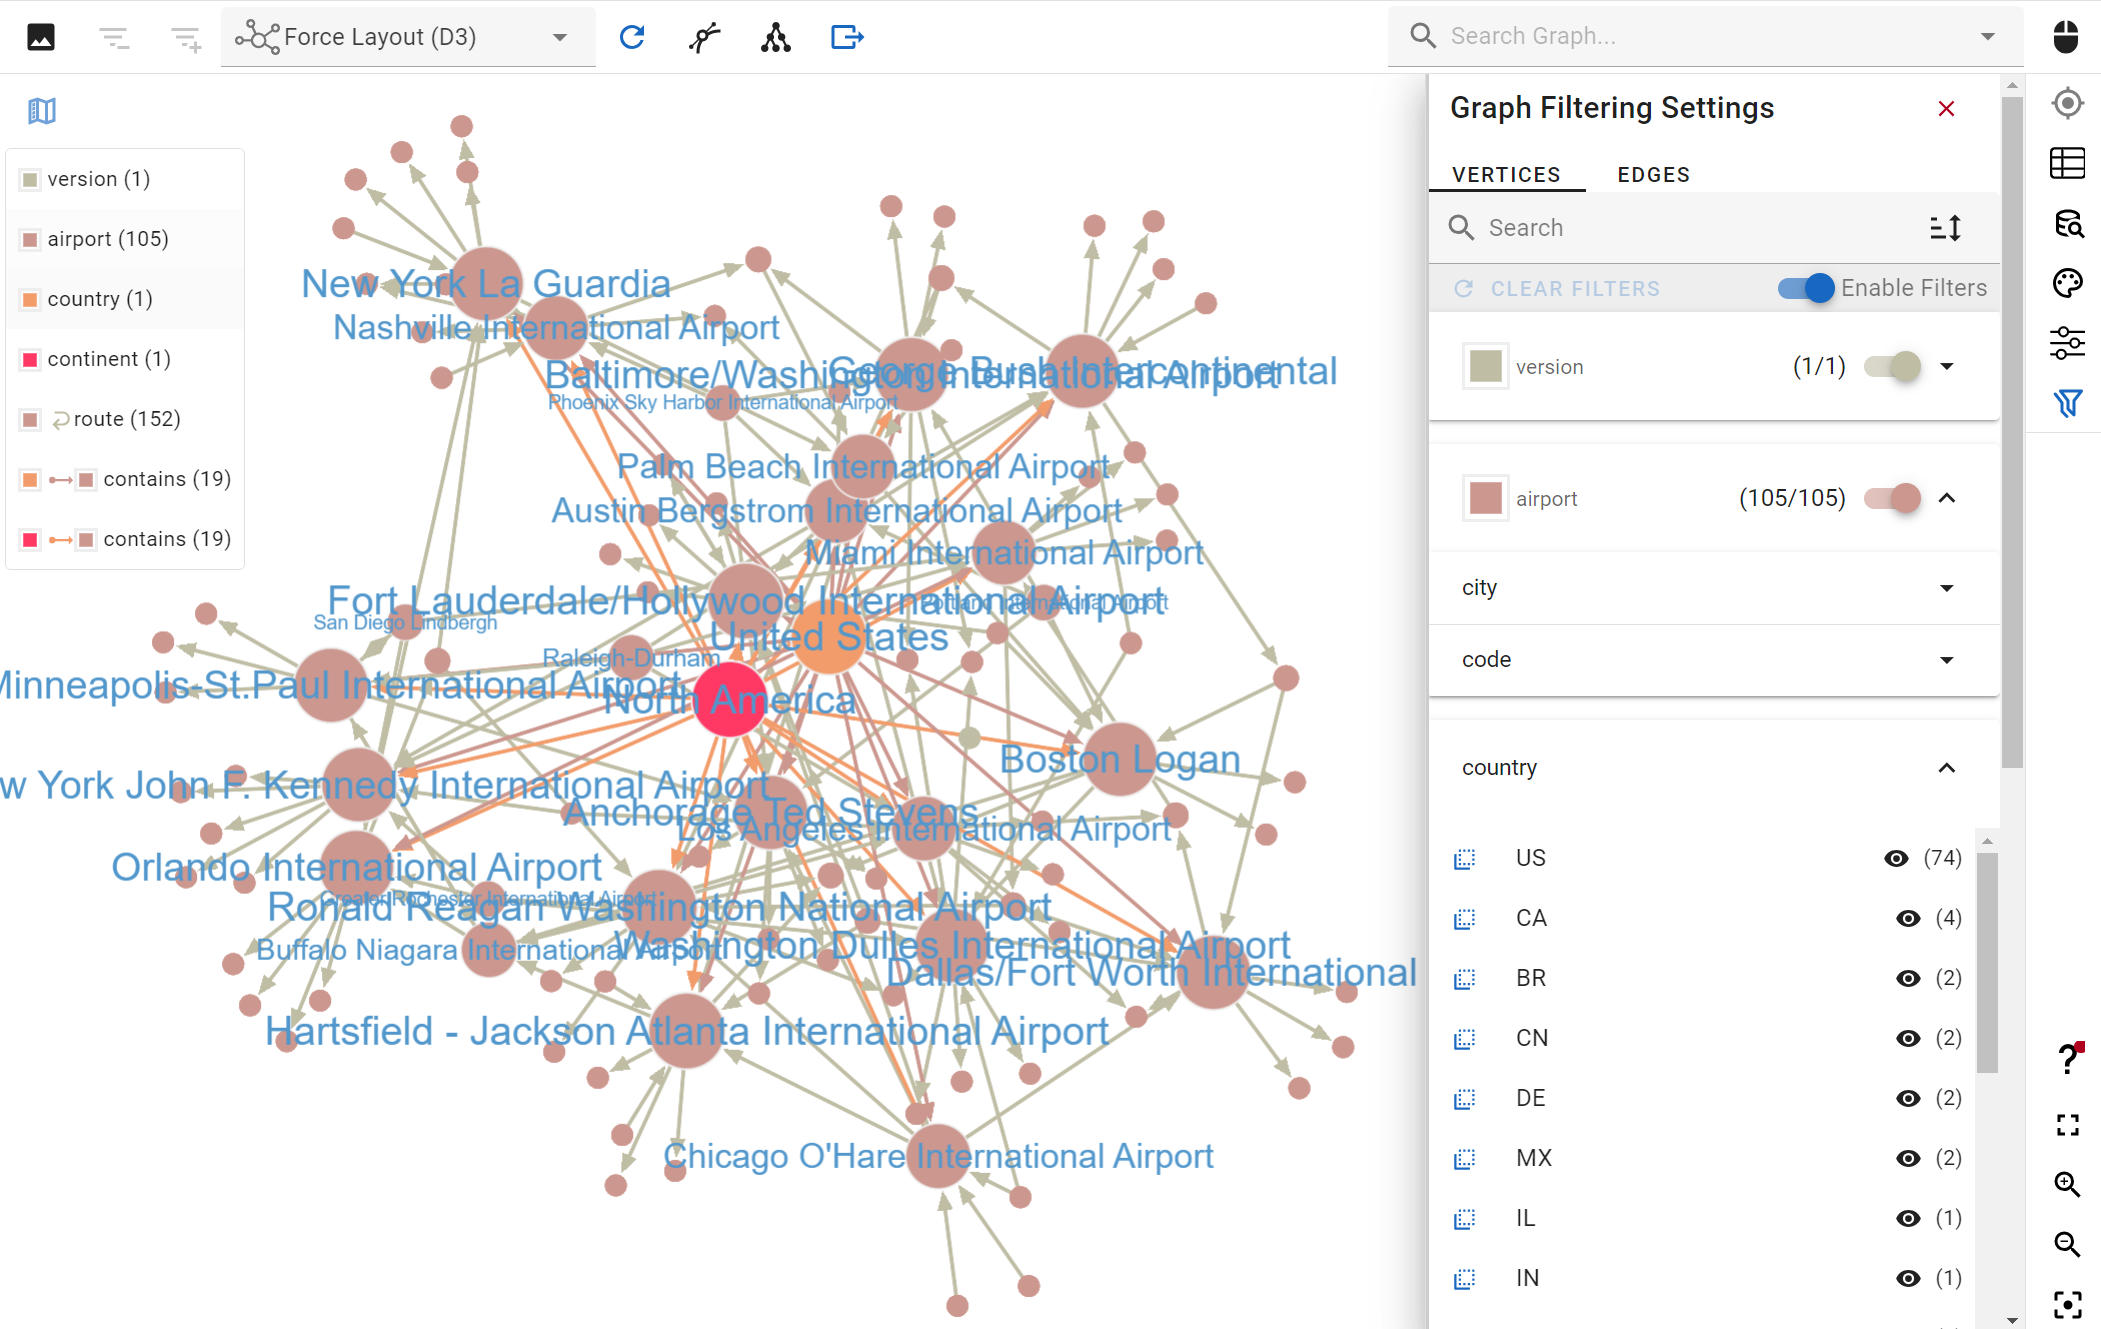
Filters are automatically generated and help narrowing down or isolating specific entities
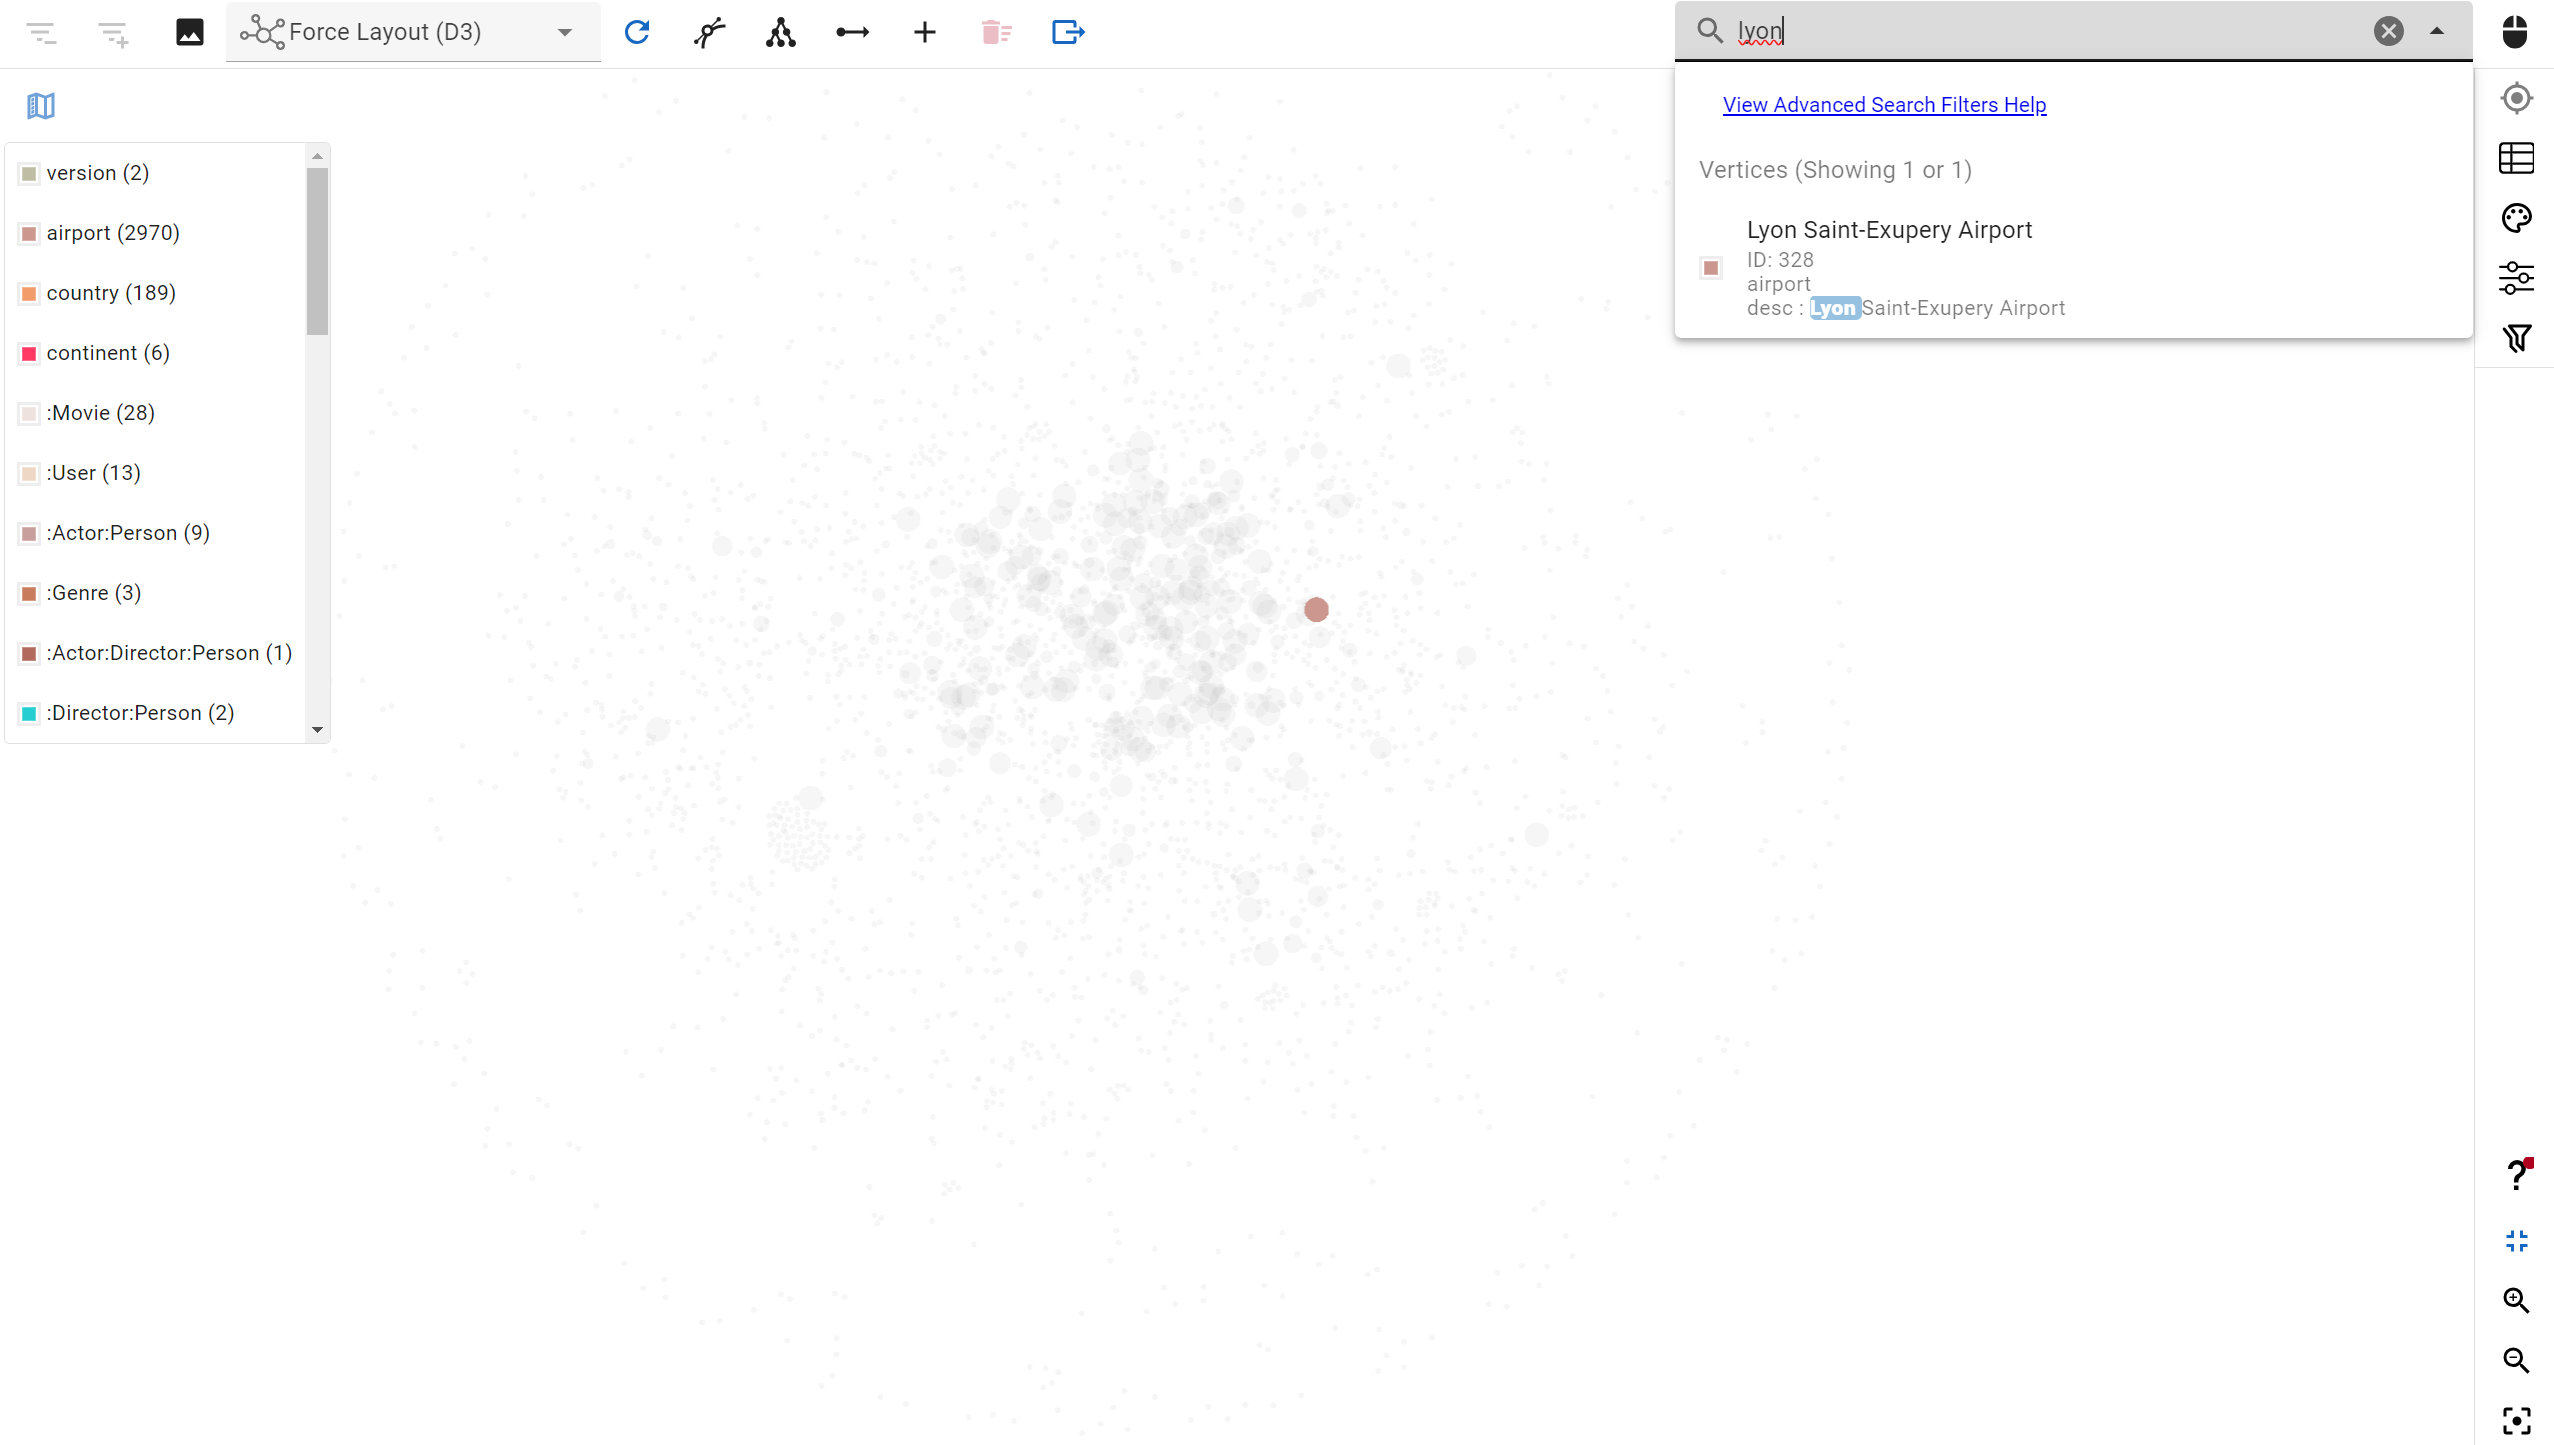
You can perform fuzzy-search or advanced text-based filtering to quickly isolate a data point
Find answers by isolating exactly what you want to see on your graph. You can do this by filtering elements based on node and edge properties’ values. You can define either use our search bar or our automatically generated filter toggles to select, focus or remove elements from your data viz in one click. This allows you to narrow down your dataset to what you’re looking for instantly.
Graph Styles Configuration
G.V() makes it easy to create compelling visuals of your graph by providing the ability to adjust the styles of your nodes and edges on the graph. You can leverage property values of elements to determine their style.
For instance, if your graph stores images (or URLs of images), you can configure your stylesheet to display those as a background for nodes. Alternatively you can set a static image or a color for each given node label and relationship type.
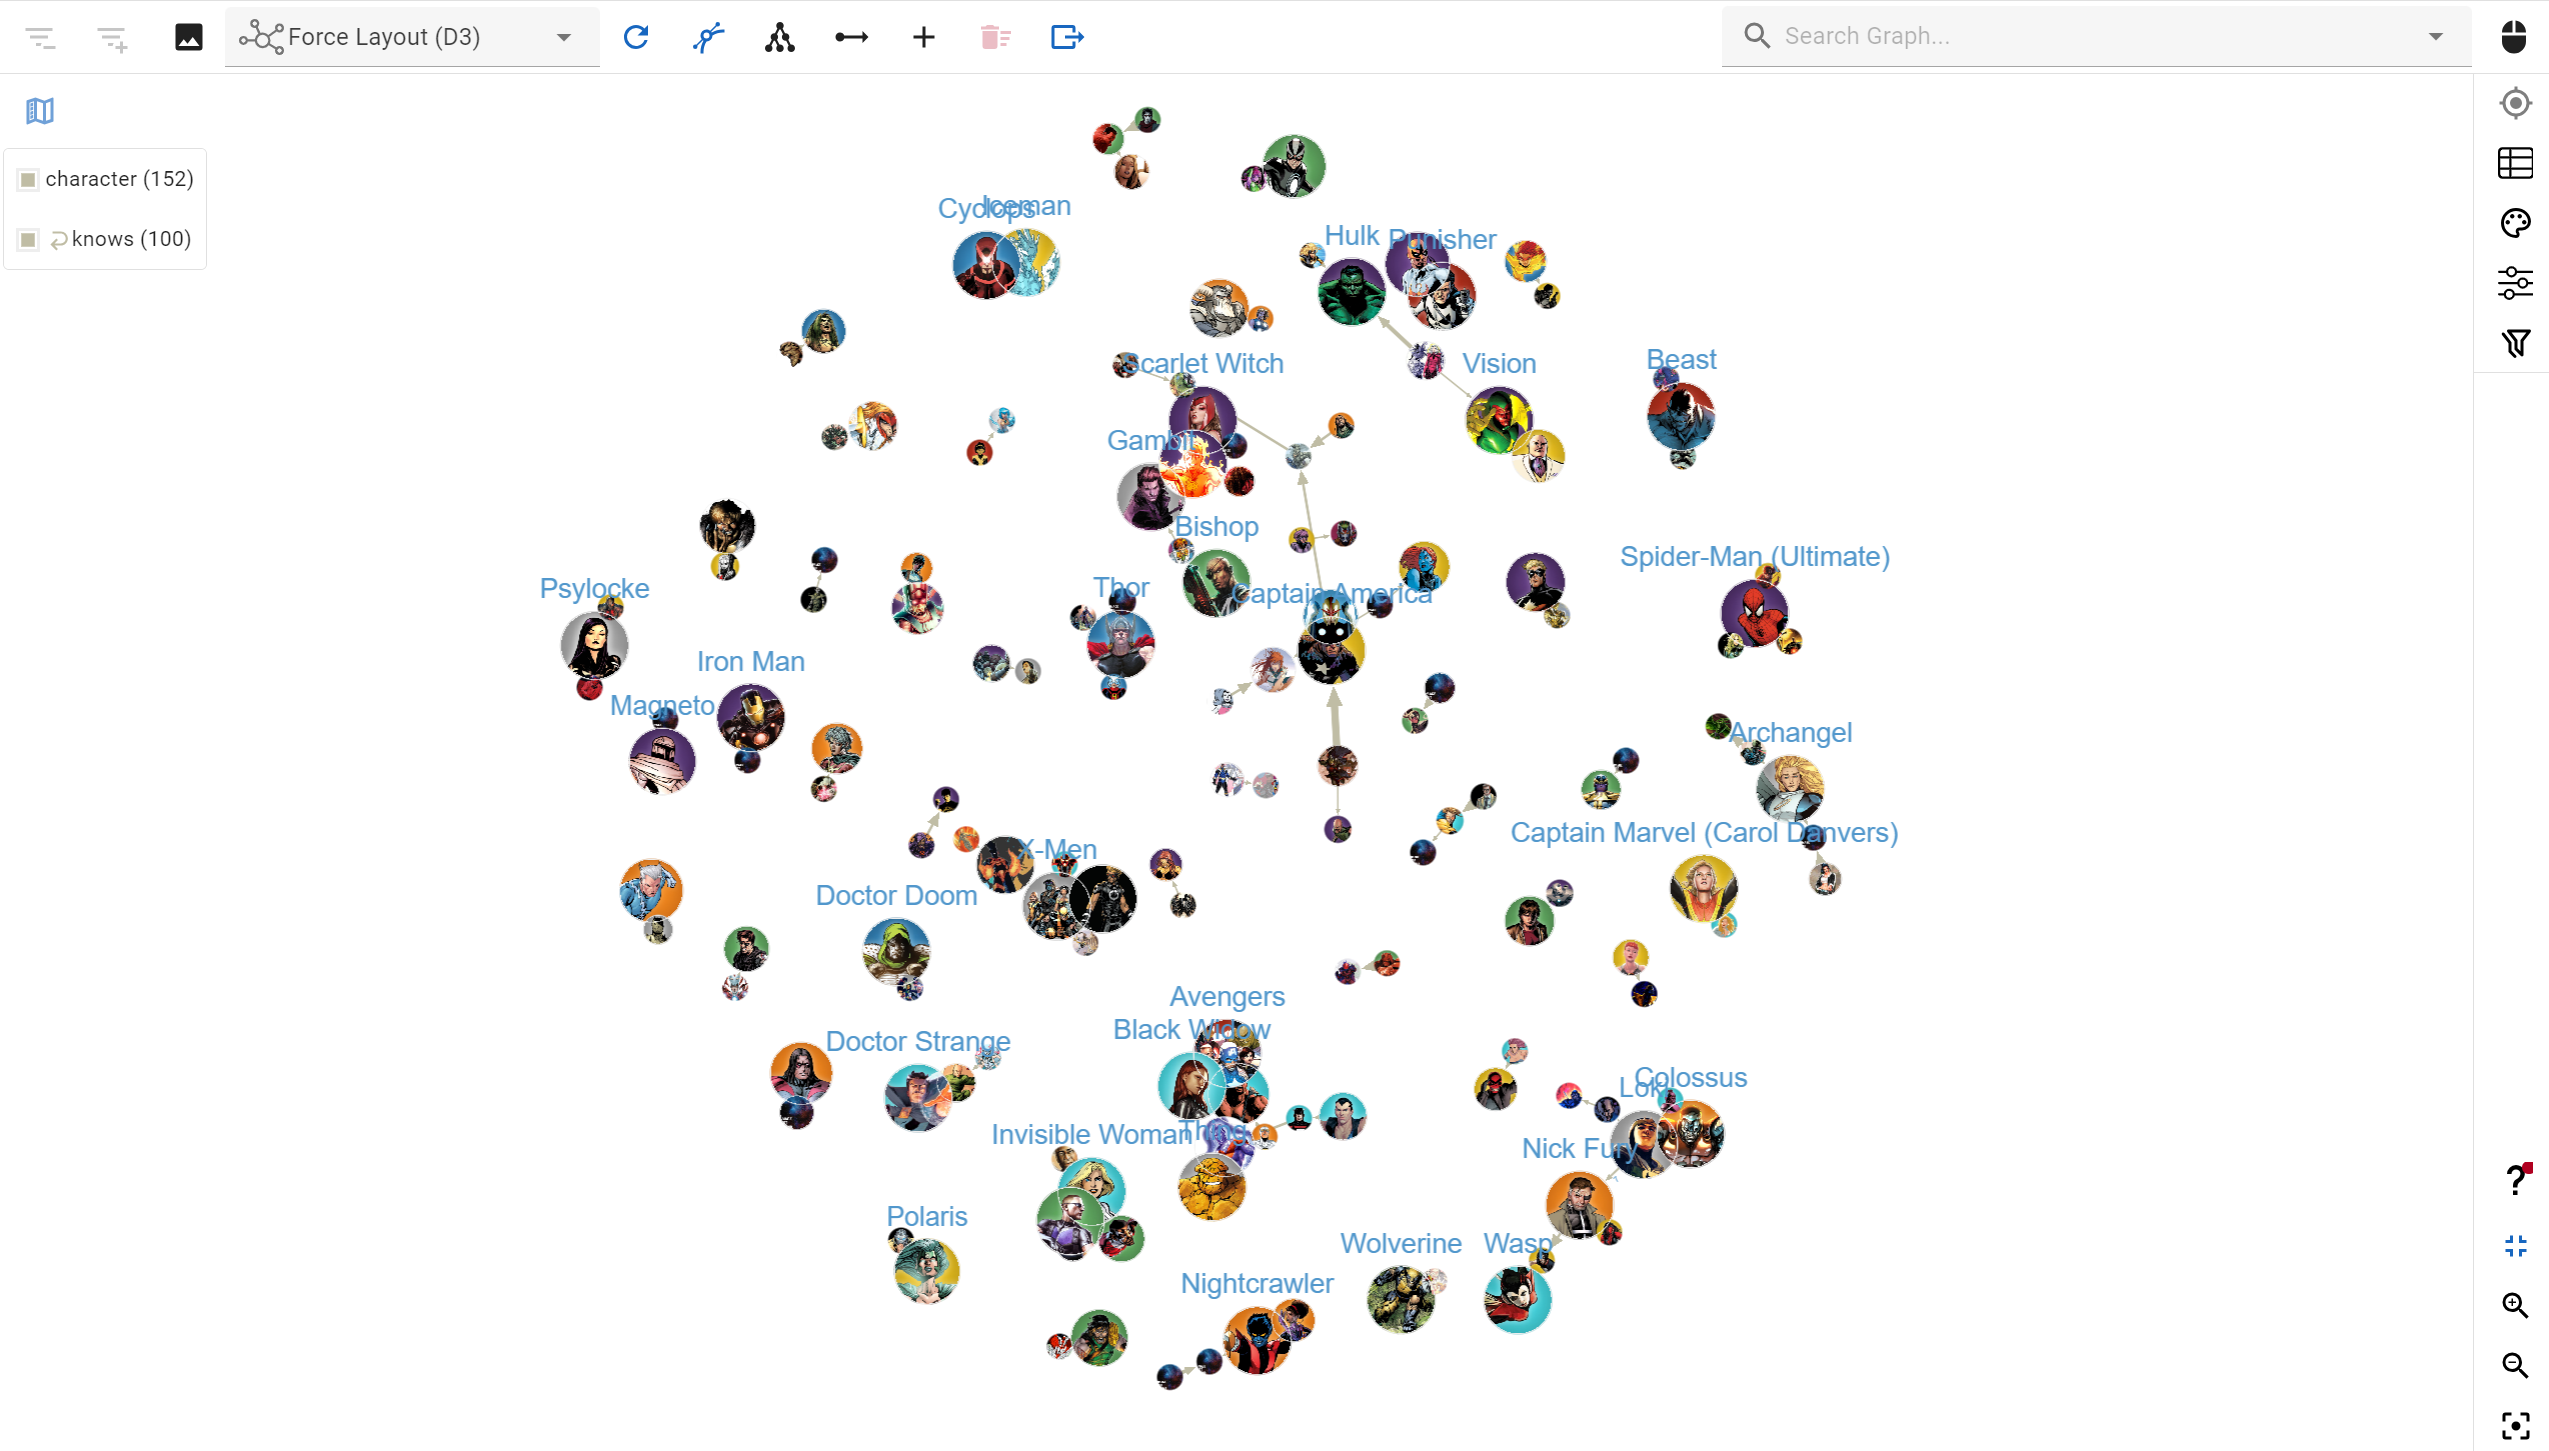
Load images and labels directly from a node's properties to make elements instantly identifiable
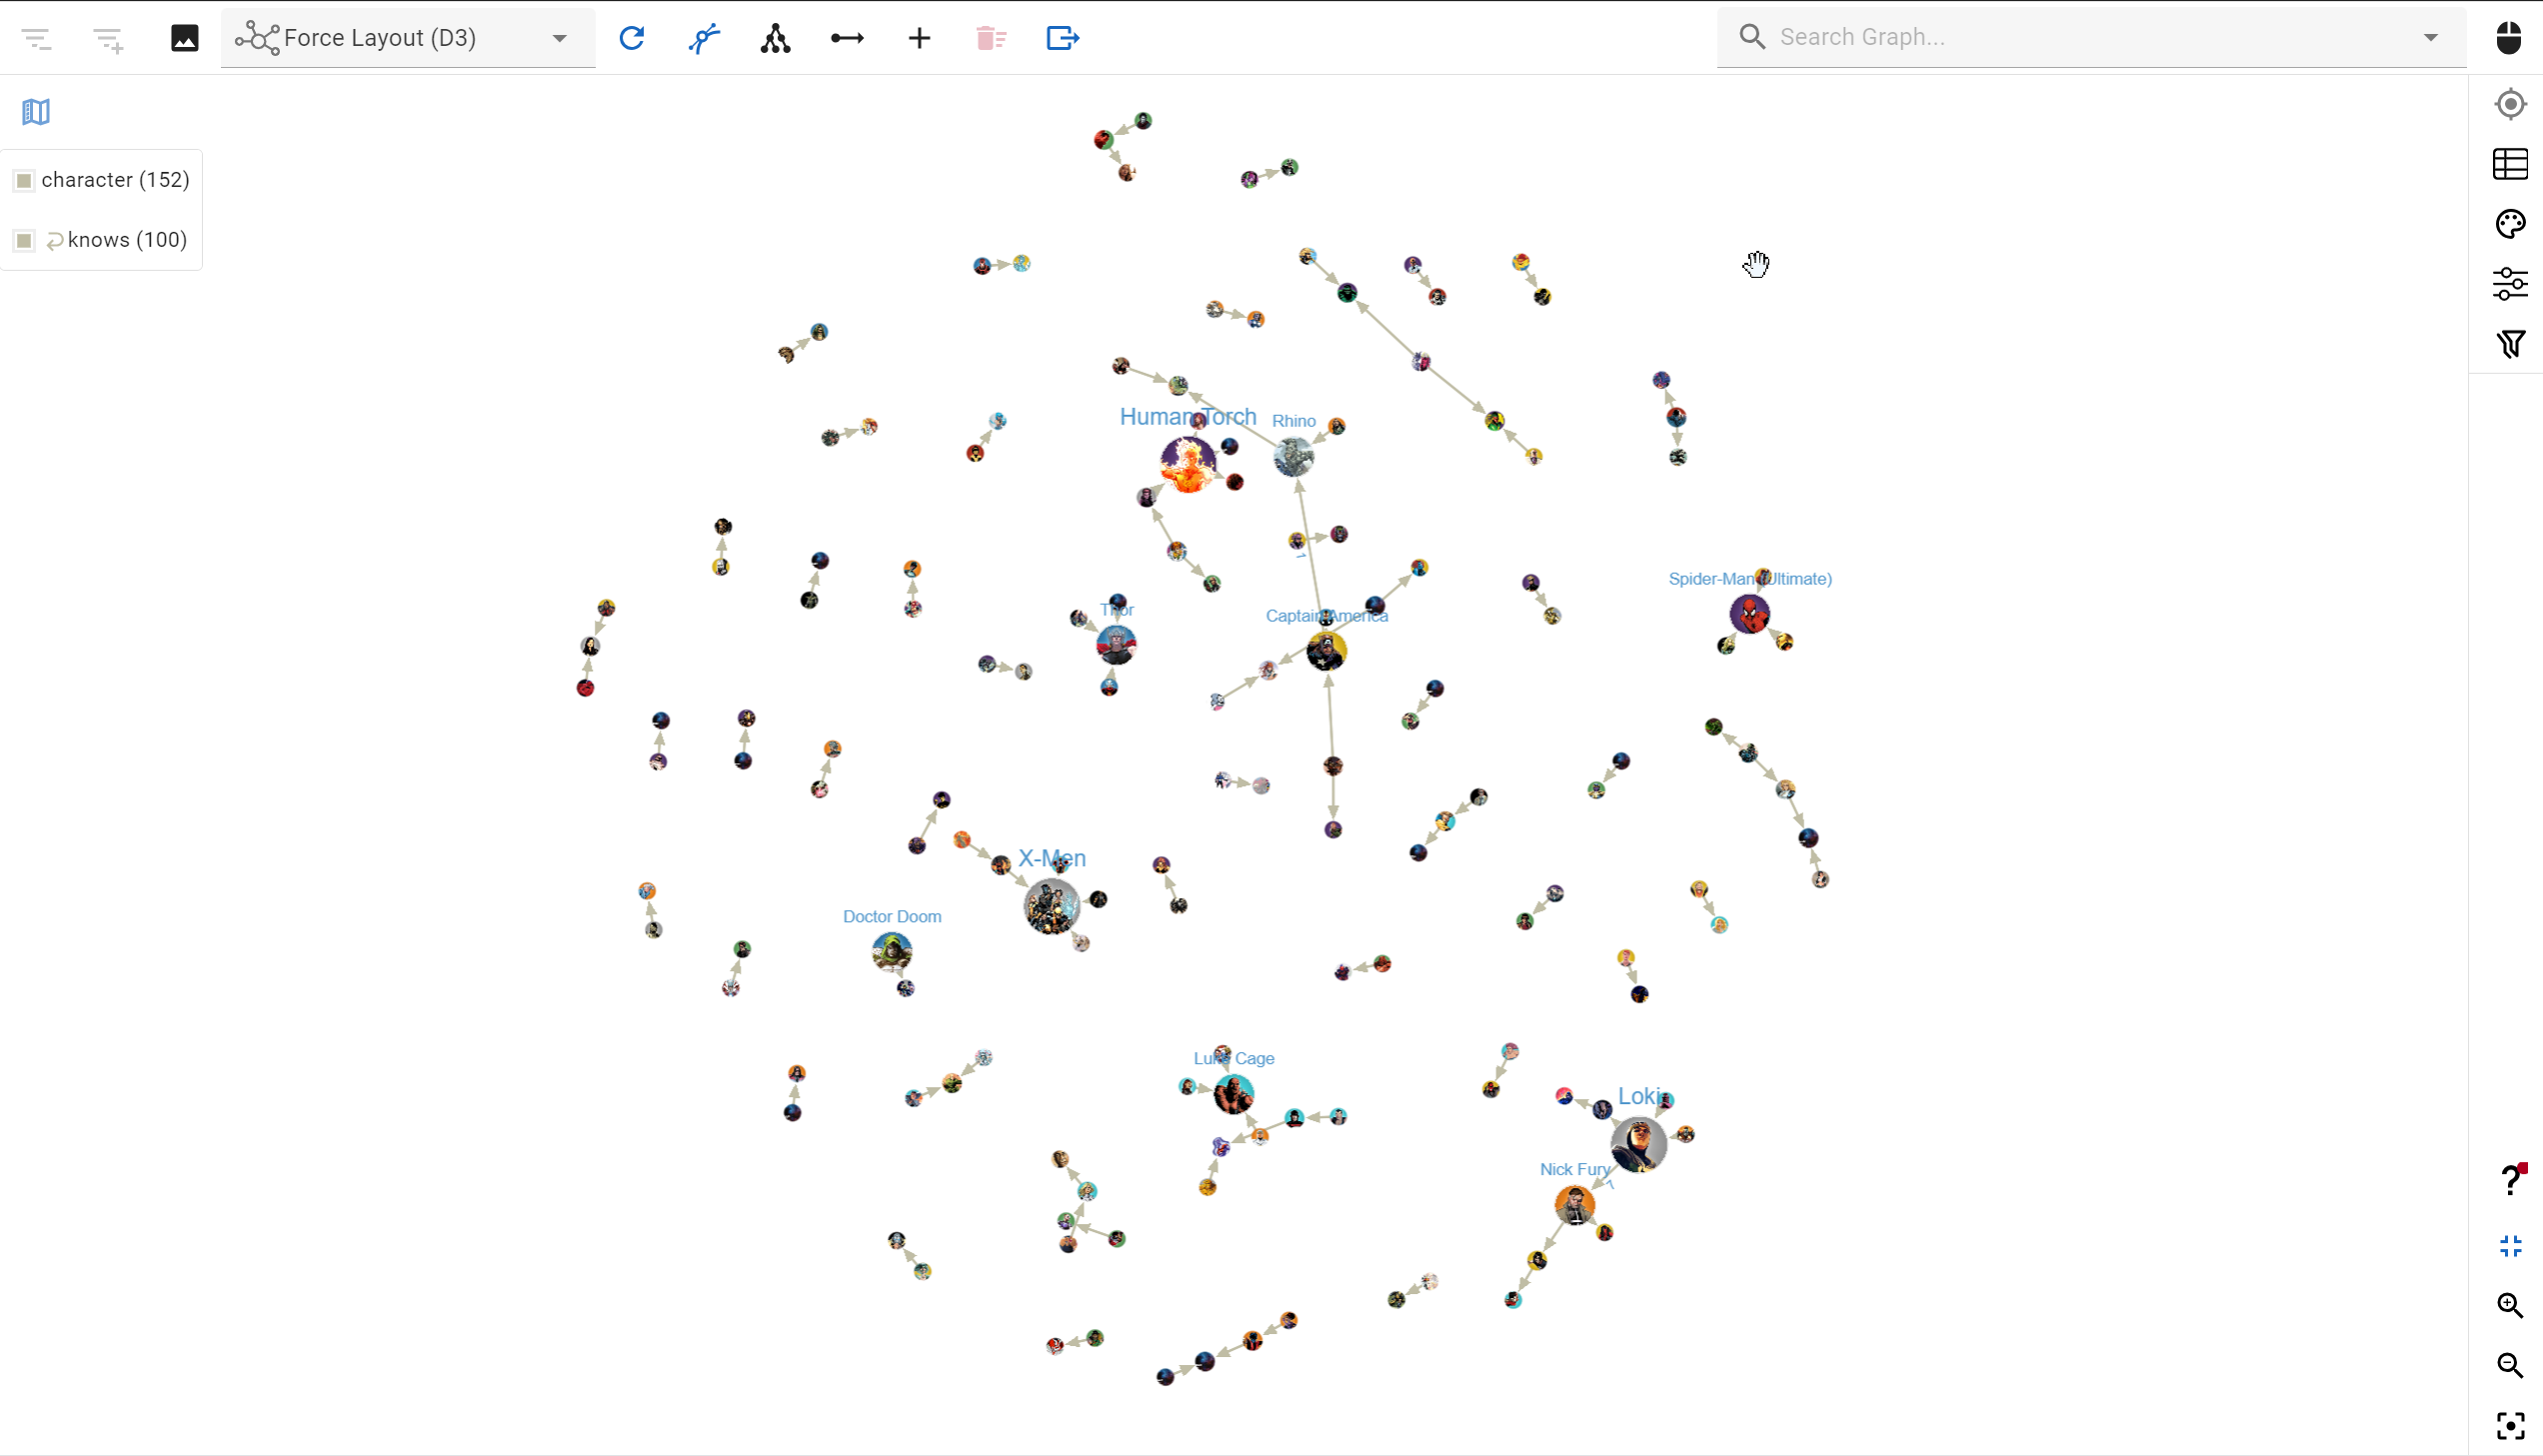
Visualizing graphs in a variety of ways is made seamless with our stylesheet system
Labels can be derived directly from edges and nodes properties too, allowing you to create displays rich in information.
Stylesheets can be imported and exported, and can be easily switched between to instantly re-render the graph visualization with new settings.
Custom Element Sizing Rules
To help drive further insights from a graph display, G.V() offers convenient settings to customize node display and edge display based on property values. For example, you can size nodes by their degree on the graph to make highly connected nodes more prominent in the display.
Numeric property values can also be used to size elements and edges can be sized according to property values from their source and target nodes. These rules can be created on a relationship type or node label basis.
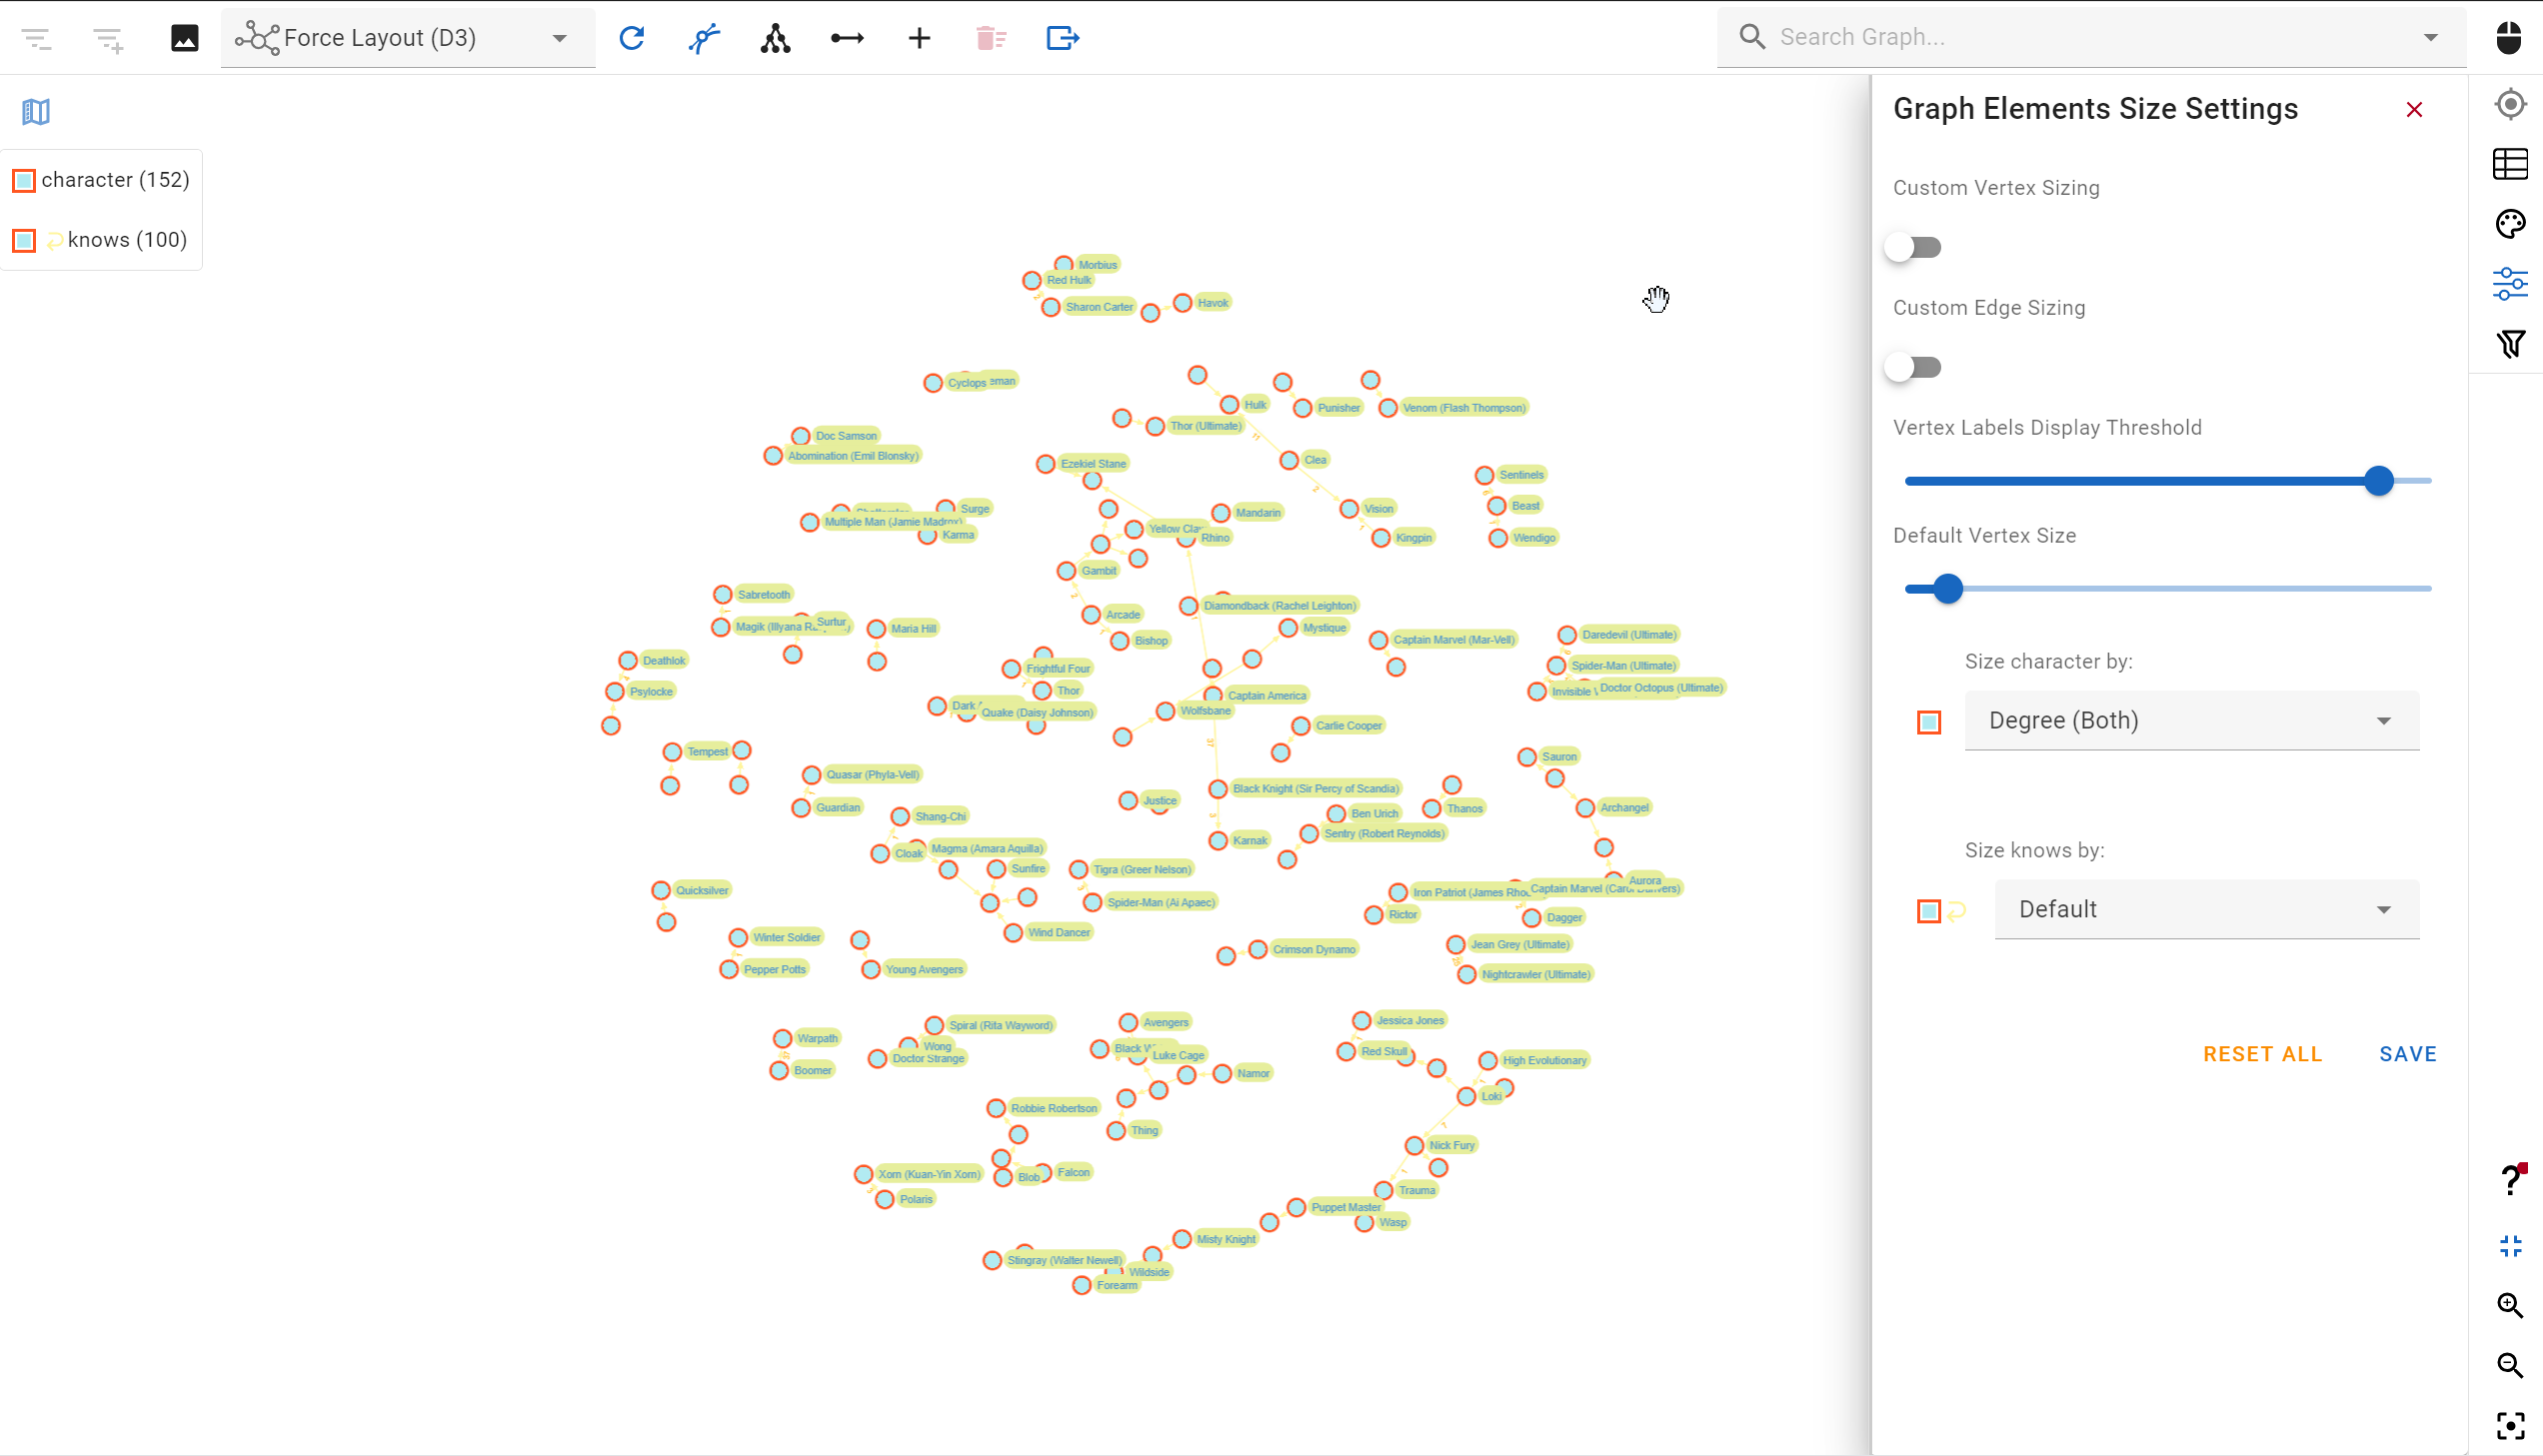
Sizing elements according to their properties is simple and instant with G.V()
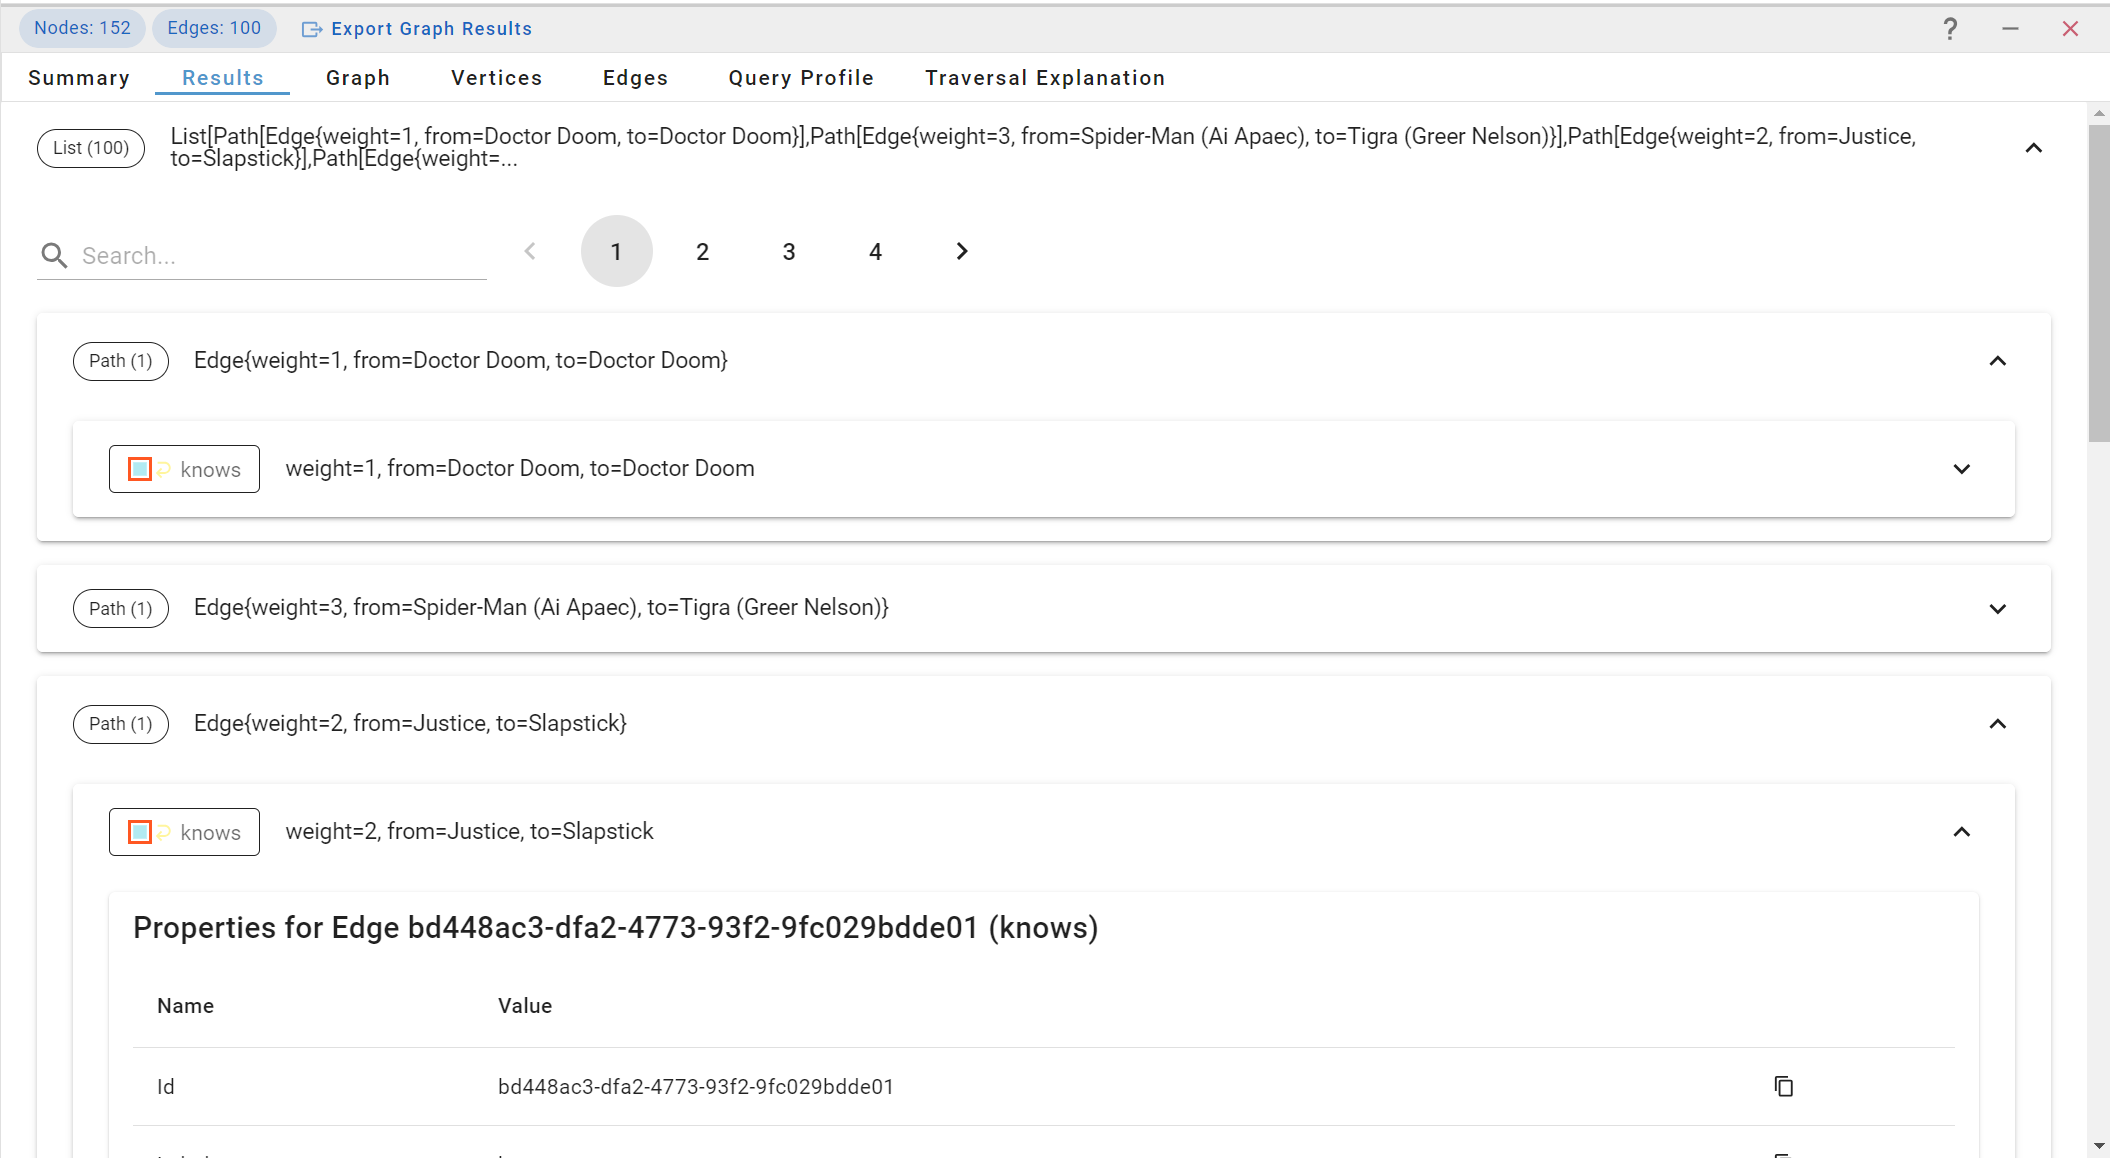
Easily navigate complex objects such as paths, trees, nodes and edges with our results view
Select Relevant Graph Data Visualization Outputs
G.V() offers various data formats to choose from to inspect your Gremlin query results. It automatically recommends a suitable data viz based on the structure of the data returned by your queries.
You can choose from plain JSON display, to graph and tabular formats, as well as a filterable object browser making navigating of data a breeze.
The JSON display is a developer-friendly format that can be easily exported, and is complemented by our results tab which makes it easier to navigate interactively.
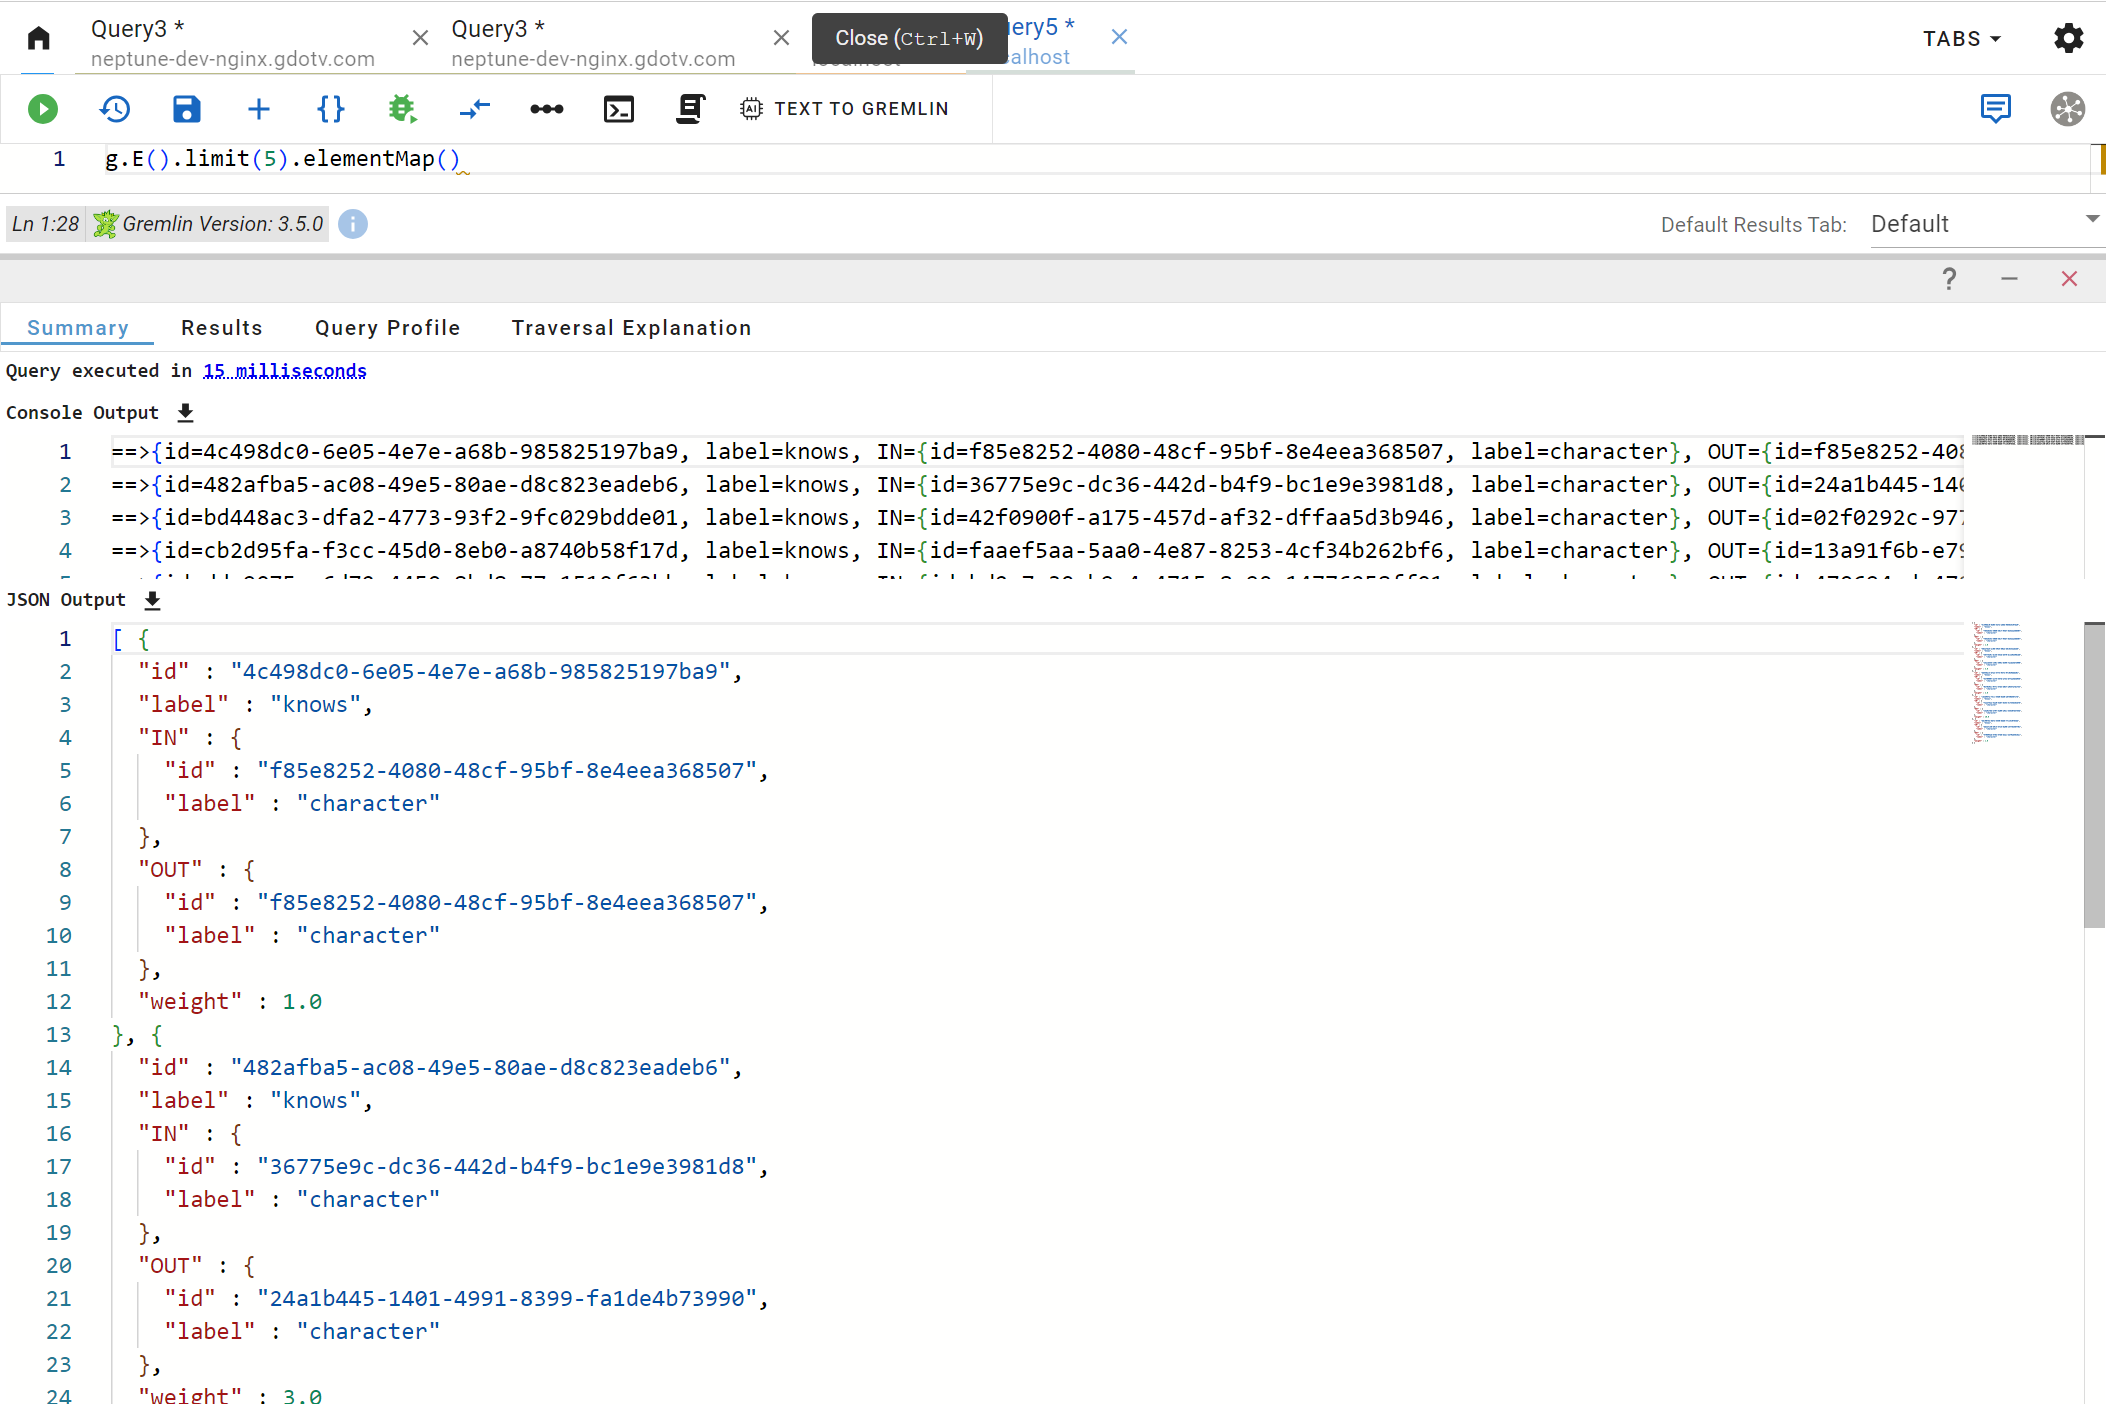
Simple yet effective JSON output and Gremlin Console output of Gremlin query results
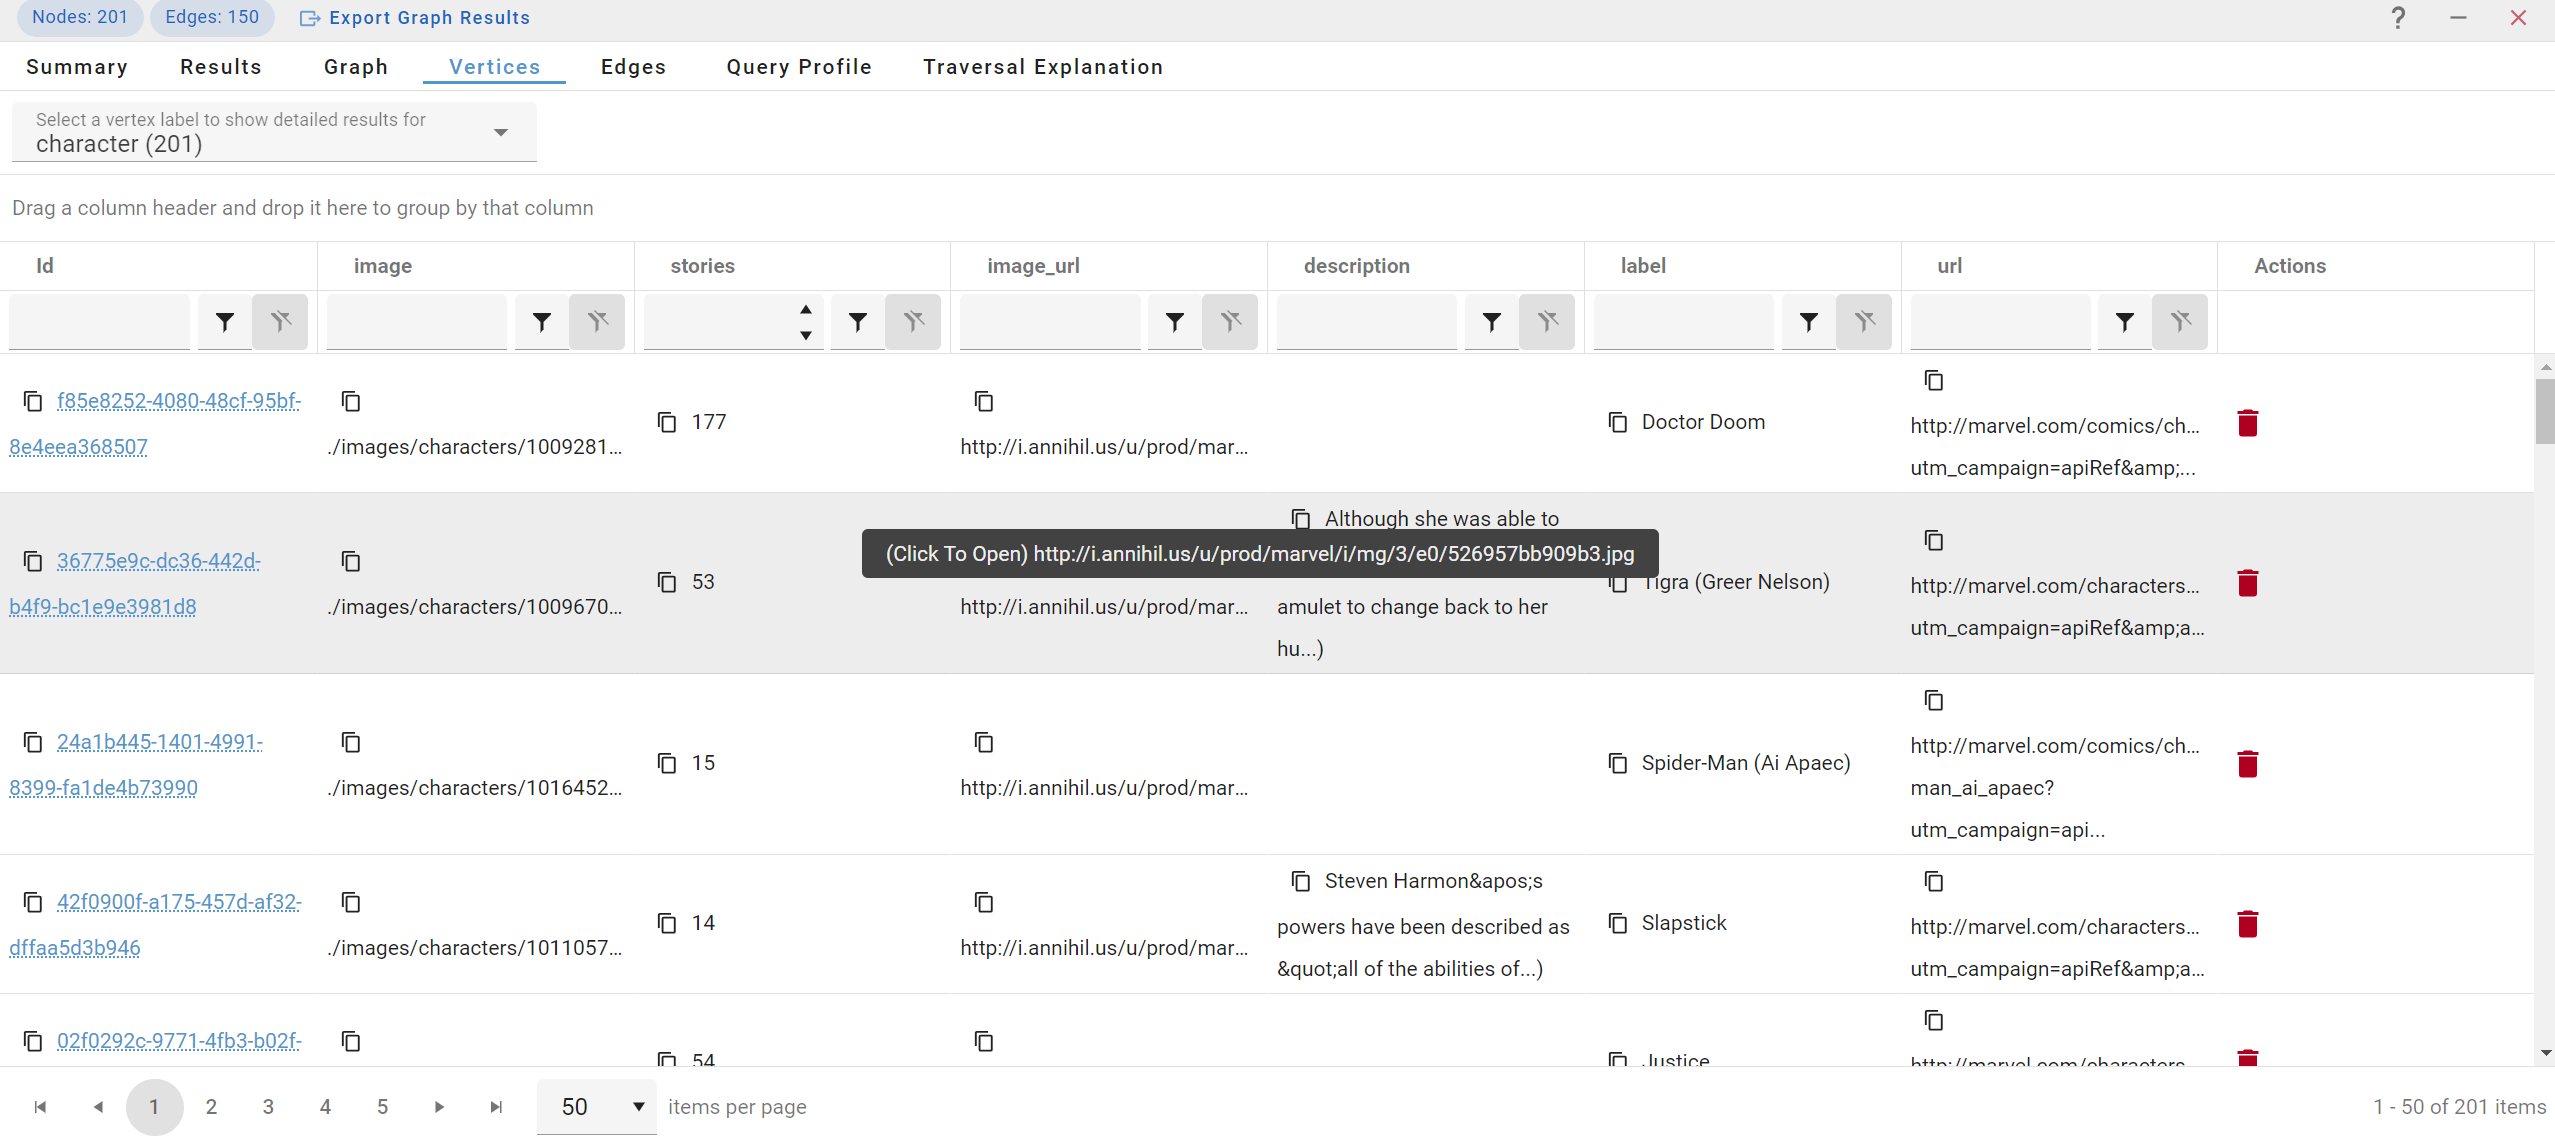
It's not always about graph! Sometimes, a simple tabular display is all you need
Our vertex and edge table views allow you to quickly visualize and compare properties of elements returned by your Gremlin query. It uses properties as columns, comes with sorting and filtering capabilities and organizes tables based on node labels and relationship types.
Streamline Graph Database Modification
Our graph database client allows for easy graph data modification and editing. Whether it’s simply adding new information or updating current data, you can do so without hassle. Non-technical users will find this editing component beneficial, as G.V() completely removes the need to write queries at all
With a few button clicks, you can change the properties stored on your graph and save the changes directly against your data source. You can also add and delete existing elements directly from the graph viewport, and apply those changes to your database.
Our intuitive client will suggest what you can create based on your existing graph data schema, automatically detecting known labels, relationship types and properties, and suggesting them when creating or updating elements.
Navigate relationships seamlessly on the graph to uncover distance between elements
Load Relationships Interactively & Visualize Statistics at Multiple Hops
The G.V() graph view also acts as a data browser enabling you to interactively load more elements from your data source in just a couple of clicks. By understanding your data model, our software lets you query relationships from a single node based on simple filters such as edge direction or label.
Our tool also automatically calculate useful neighborhood information for nodes giving you a simple way to determine the hop distance between elements in your output.
Bring your data to life with our effortless visualization features and comprehensive graph styling configuration.
Download and install G.V() today to turn data to insights.
FAQs
Streamline your data analysis efforts with our feature-rich UI, offering different tools for graph visualizations.
Download and use G.V() today to revolutionize how you visualize data.
G.V() – A Feature Rich Gremlin Visualization Software
Streamline how you navigate your data with our interactive visualization software. It turns raw query results to meaningful graph visualization. G.V() also streamlines your day-to-day database operations with our suite of Integrated Development Environment features.
Our visualization tool has been developed by a team of experts, and we aim to improve our offerings through user feedback and collaboration. Reach out with helpful suggestions by sending an email to support@gdotv.com.
Build intuitive graphs with our comprehensive graph visualization tool. Sign up today for a free 1-month trial.
