Full Gremlin IDE Features & Functionality
Simplify your graph database development process and maximize productivity with our
Gremlin Integrated Development Environment (IDE).
What is G.V()?
G.V() is a desktop software compatible with Windows, macOS and Linux that provides users with a comprehensive set of tools to interact with their graph databases.
It breaks past the limitations of default tools like Gremlin Console or Azure Cosmos DB Data Explorer, giving you a rich user experience to query, profile or debug Gremlin queries. You can then analyze their results using context-aware visualization formats such as graph, tables and JSON.
G.V() is compatible and optimized for all the leading Apache TinkerPop graph databases such as Amazon Neptune, Azure Cosmos DB Gremlin API, JanusGraph, Aerospike Graph and many more.
Here’s what you can do with G.V():
Manage Multiple
Connections Centrally
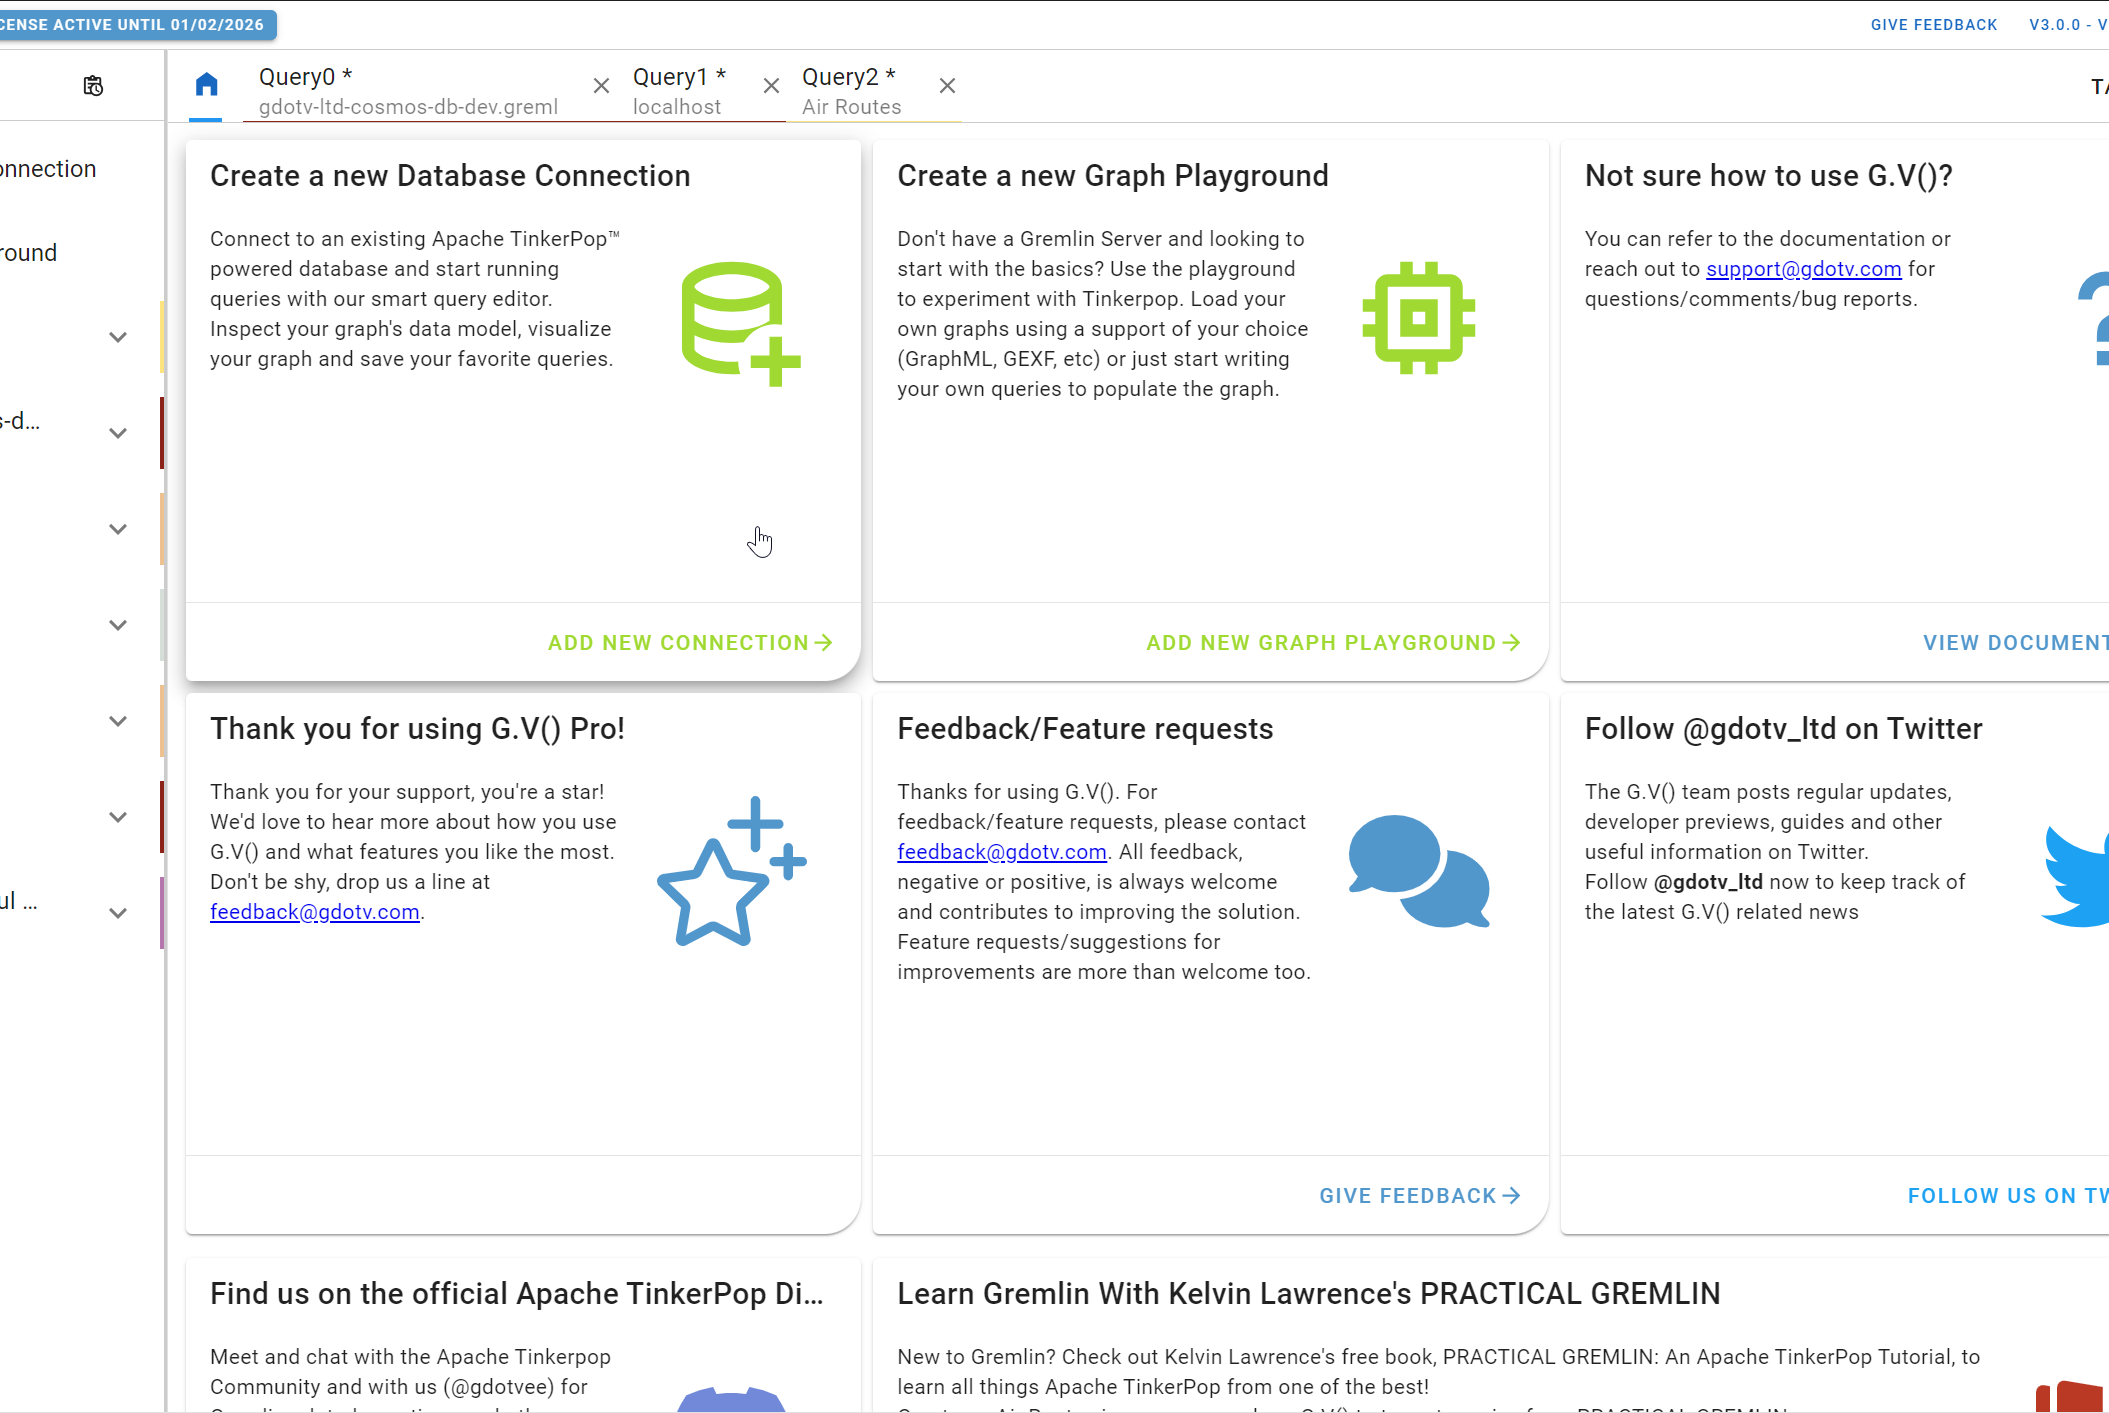
Connect to Tinkerpop-compatible graph databases from multiple providers effortlessly. G.V() can run connections simultaneously, meaning you can switch between databases seamlessly. It supports even the most complex setups, such as Kerberos or AWS IAM authentication.
Our plug-and-play integration connects to your chosen Apache Tinkerpop-compatible databases with just a couple of clicks by walking you through the necessary steps to query your database.
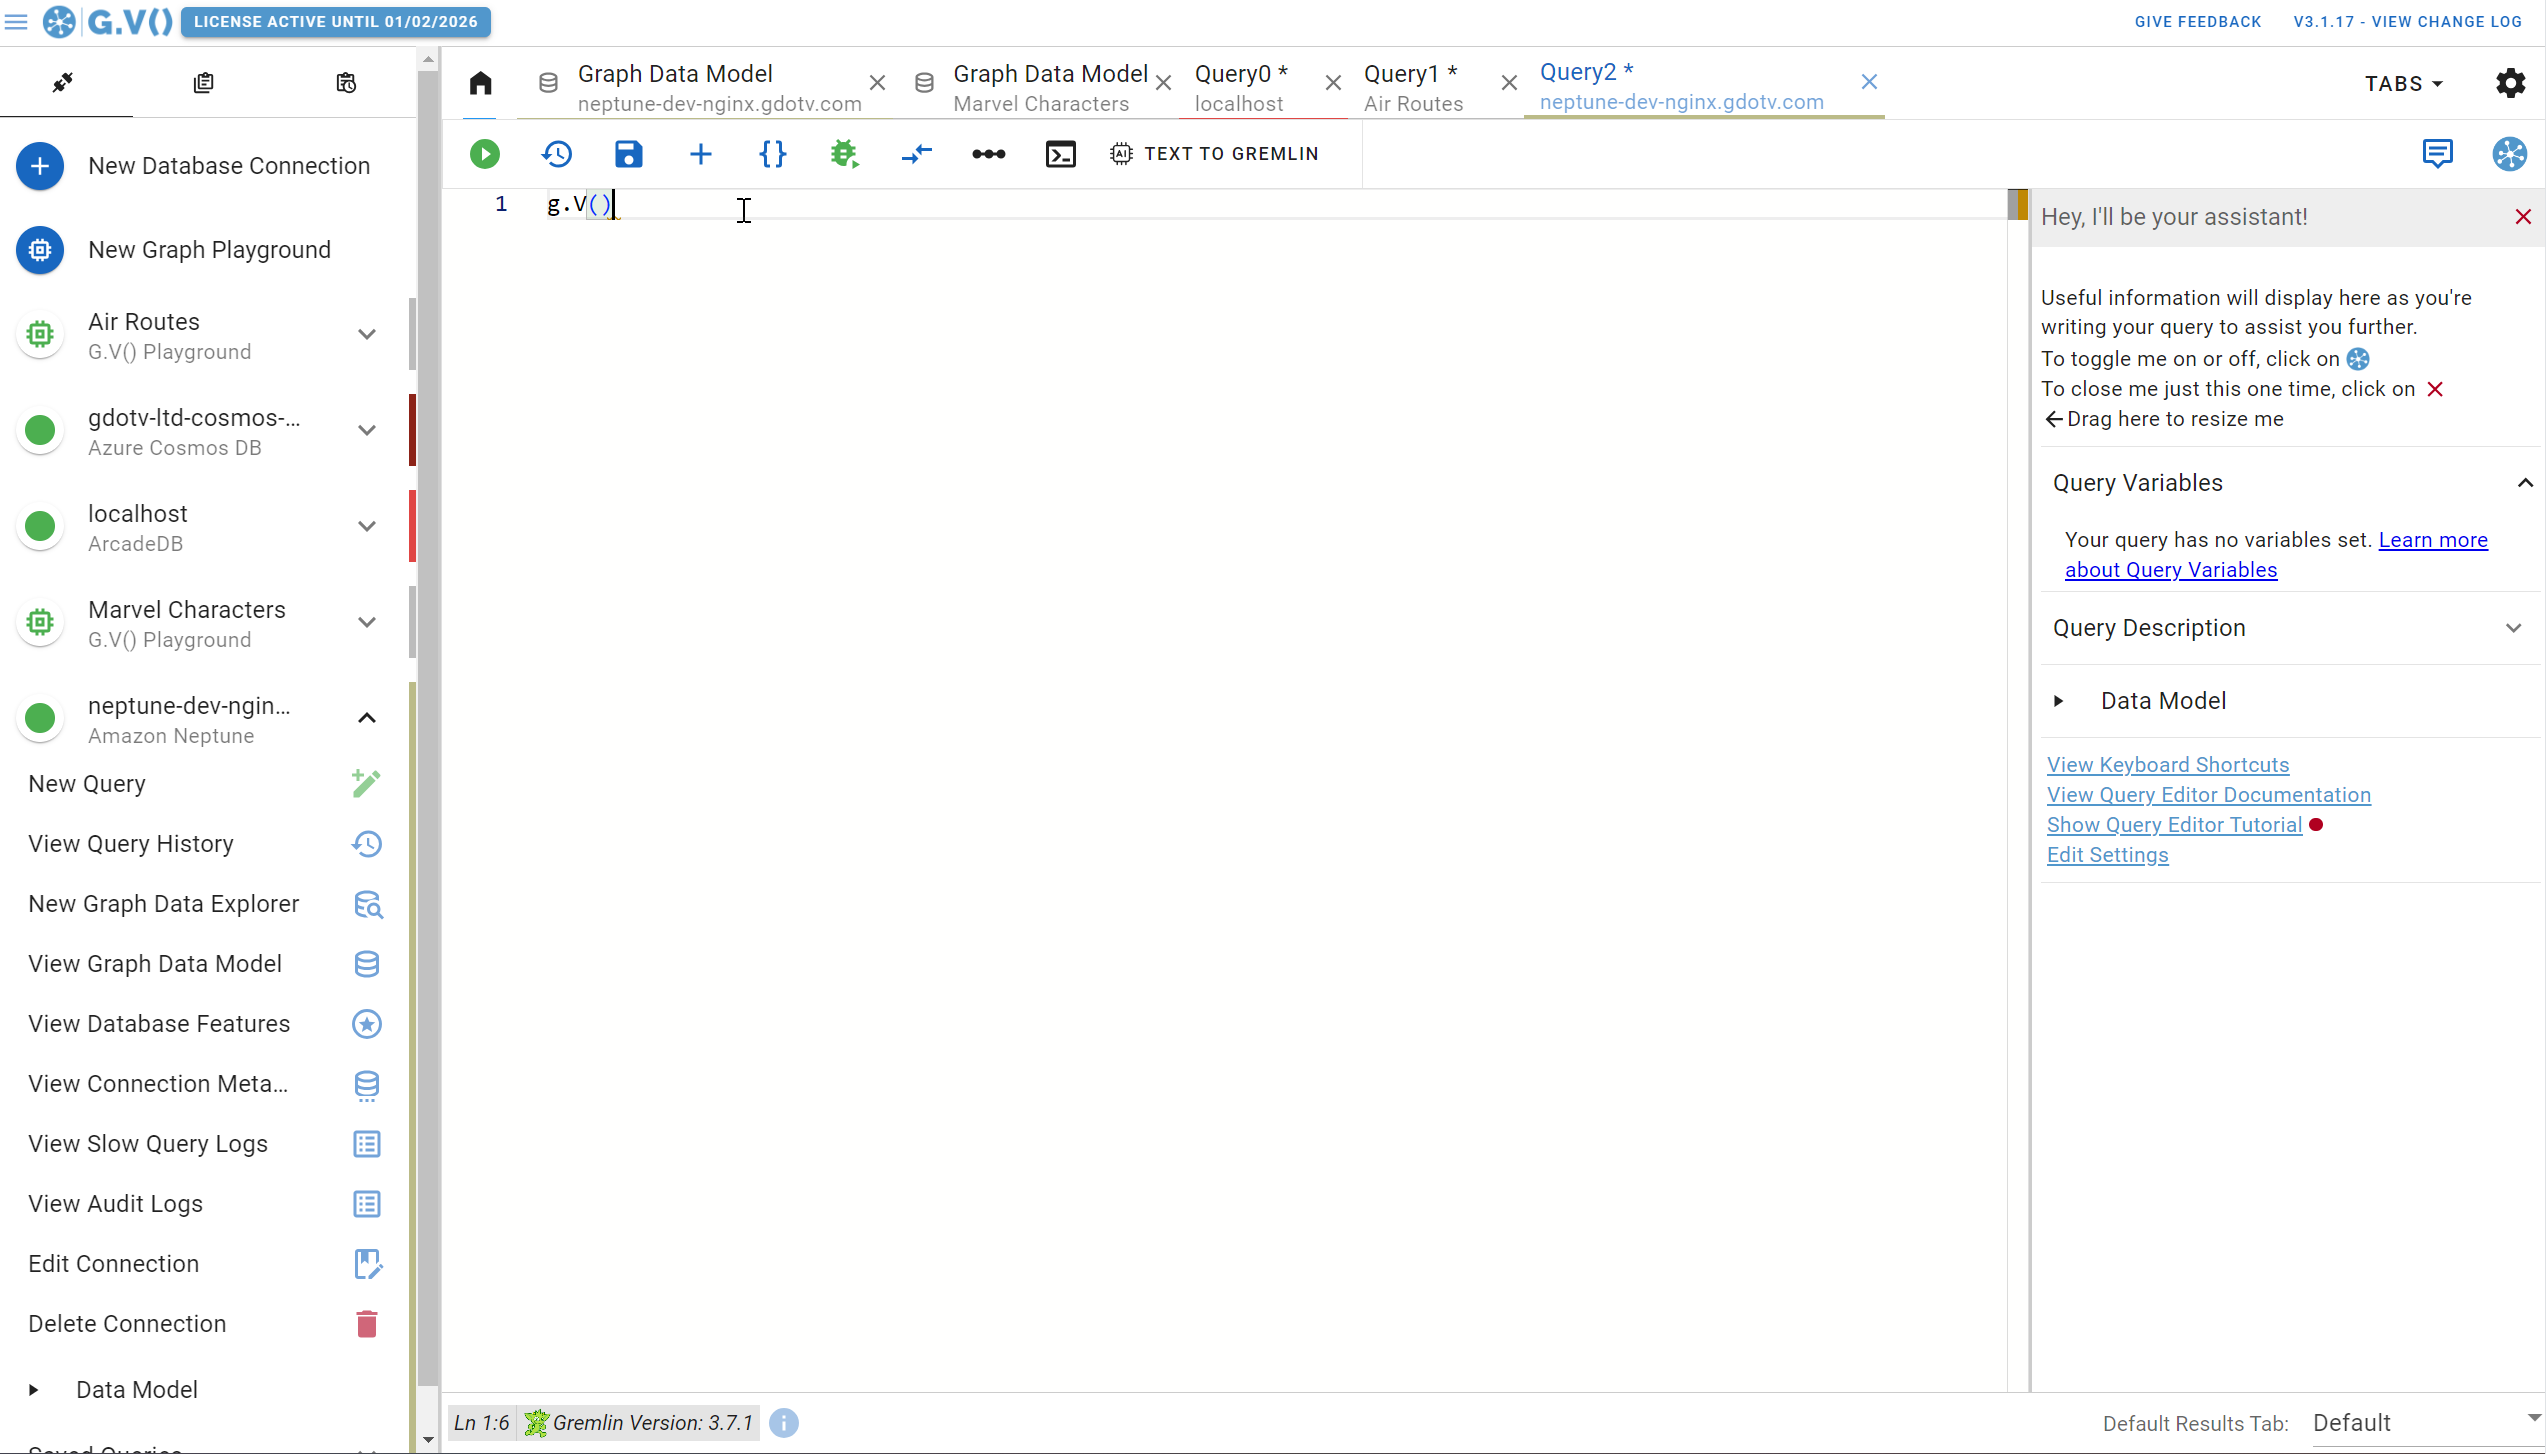
Syntax highlighting, autocomplete and other tools make writing Gremlin queries a breeze
Access a Market-Leading
Code Editor
Our text editor detects errors and provides code suggestions based on the structure of your database schema. The smart code completion engine streamlines the process of writing and editing queries. As you type, useful suggestions appear to complete your query.
Our syntax highlighting feature displays syntax errors in real-time and improves readability of your query with intuitive code coloring. One click code formatting is available to keep your code tidy and easy to navigate.
Embedded Gremlin
language documentation
Our IDE also displays the embedded Gremlin documentation on the right-hand side of the screen for easy learning and quick referencing. Our query assistant panel is a learning center for those unfamiliar with the Gremlin language, giving you all the information you need on one screen.

Using the G.V() Gremlin documentation to simplify coding
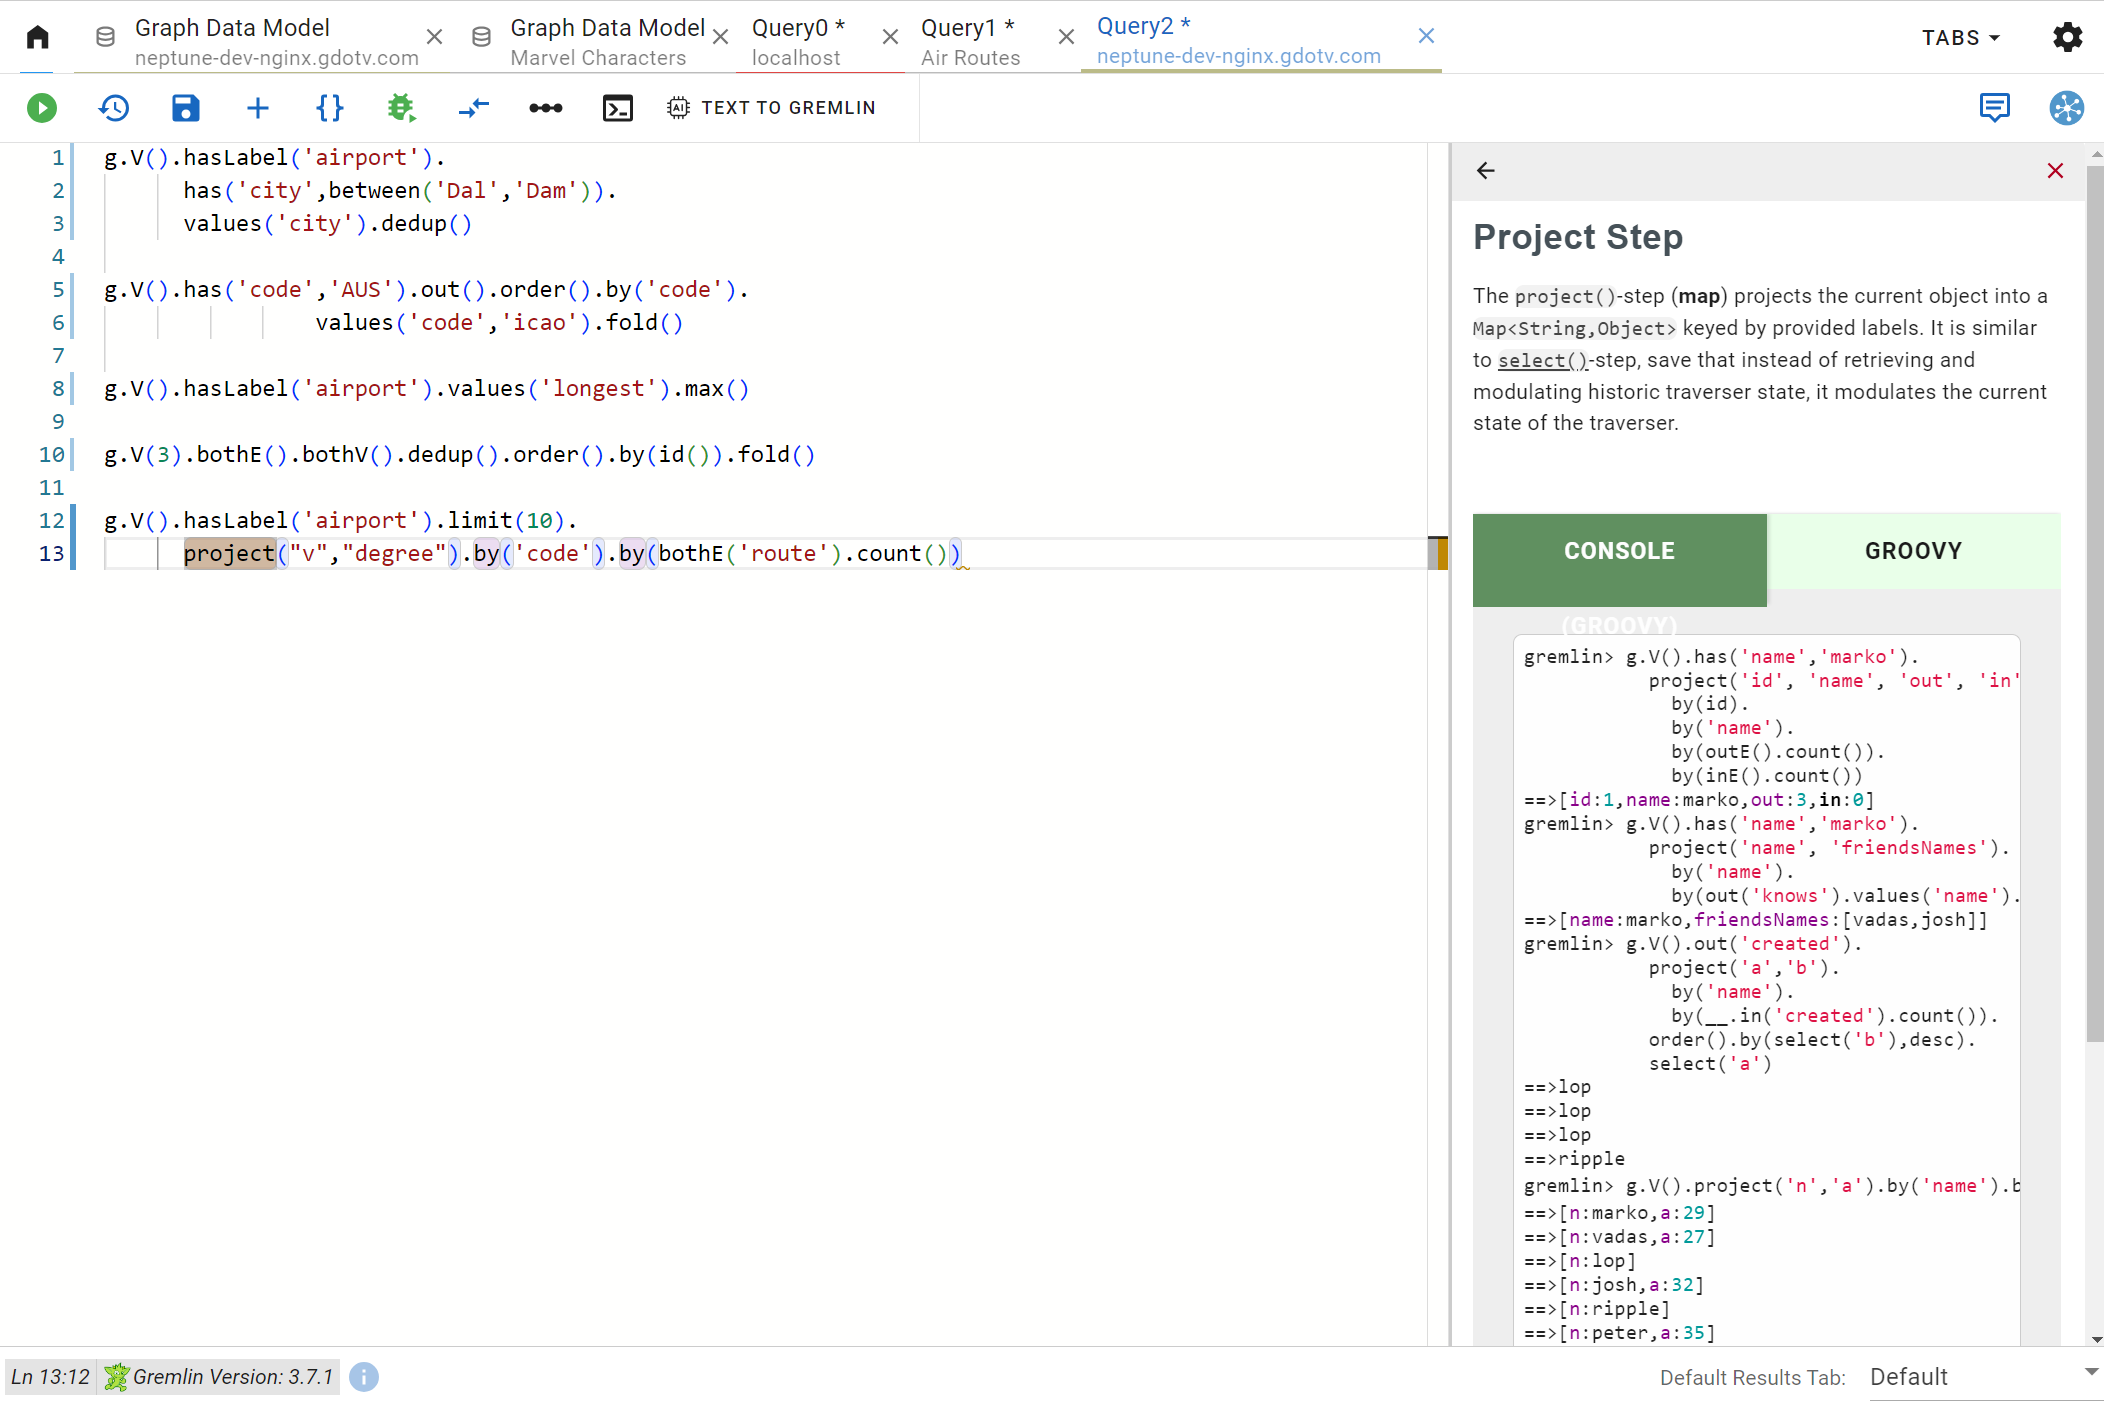
Managing multiple queries in a single tab makes development and querying easier.
Seamlessly switch between queries
Our easy-to-navigate tabs system lets you interact with multiple databases simultaneously. It’s especially helpful for testing and comparing query performance or output. You can also write and run multiple Gremlin queries from a single tab to easily manage multiple variations of your query.
Powerful Query Debugging Tool
Our Gremlin client is able to simulate your graph traversal step-by-step, and record-by-record. This gives you unprecedented control over the execution of your query, and leads to a better understanding of how the query works.
During a debugging session, G.V() shows you what results you can expect at each step of your Gremlin query. With our record-by-record breakdown, you have full control to inspect the behavior of your data traversal. It also makes it easier to debug and troubleshoot any issues if your query is not performing or behaving as expected.
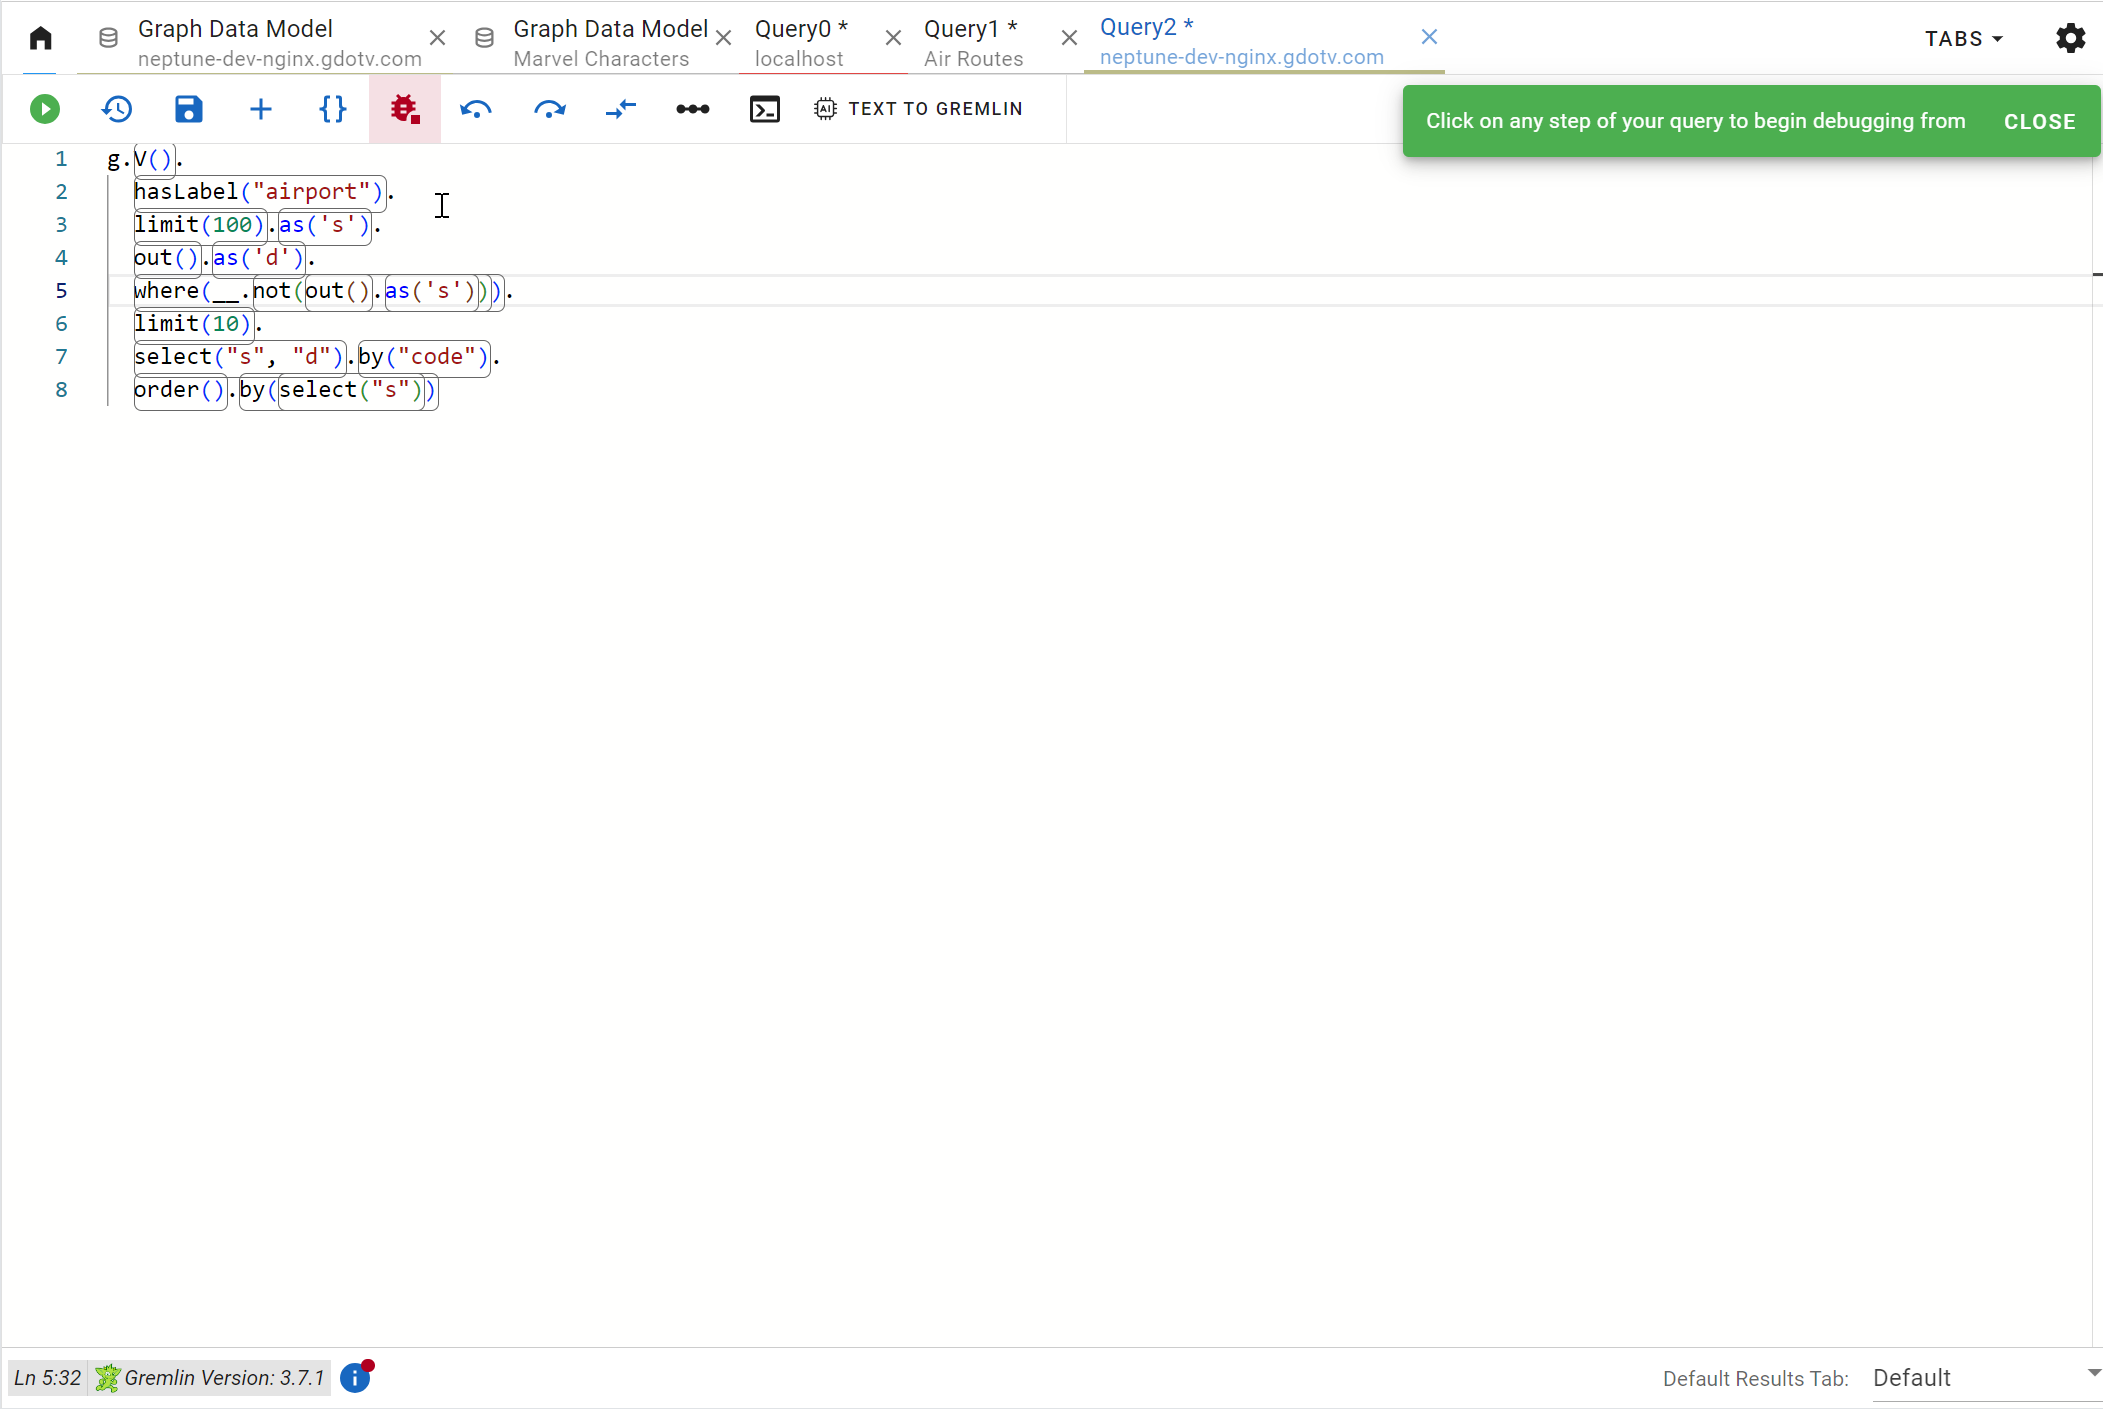
Query analysis with various visualizations using G.V()'s Gremlin debugger
Learn Gremlin with our in-memory graph, G.V() Playground
We know that adopting new data technology can be challenging. To support developers, we offer a free version of the software, G.V() Lite, in which you can create an unlimited amount of in-memory graphs to experiment with graph data handling and querying.
G.V() Playground comes with preset data created by the Gremlin community for learning purposes, and helps you follow open source guides such as PRACTICAL GREMLIN: An Apache TinkerPop Tutorial or Apache TinkerPop’s own Getting Started with ease.
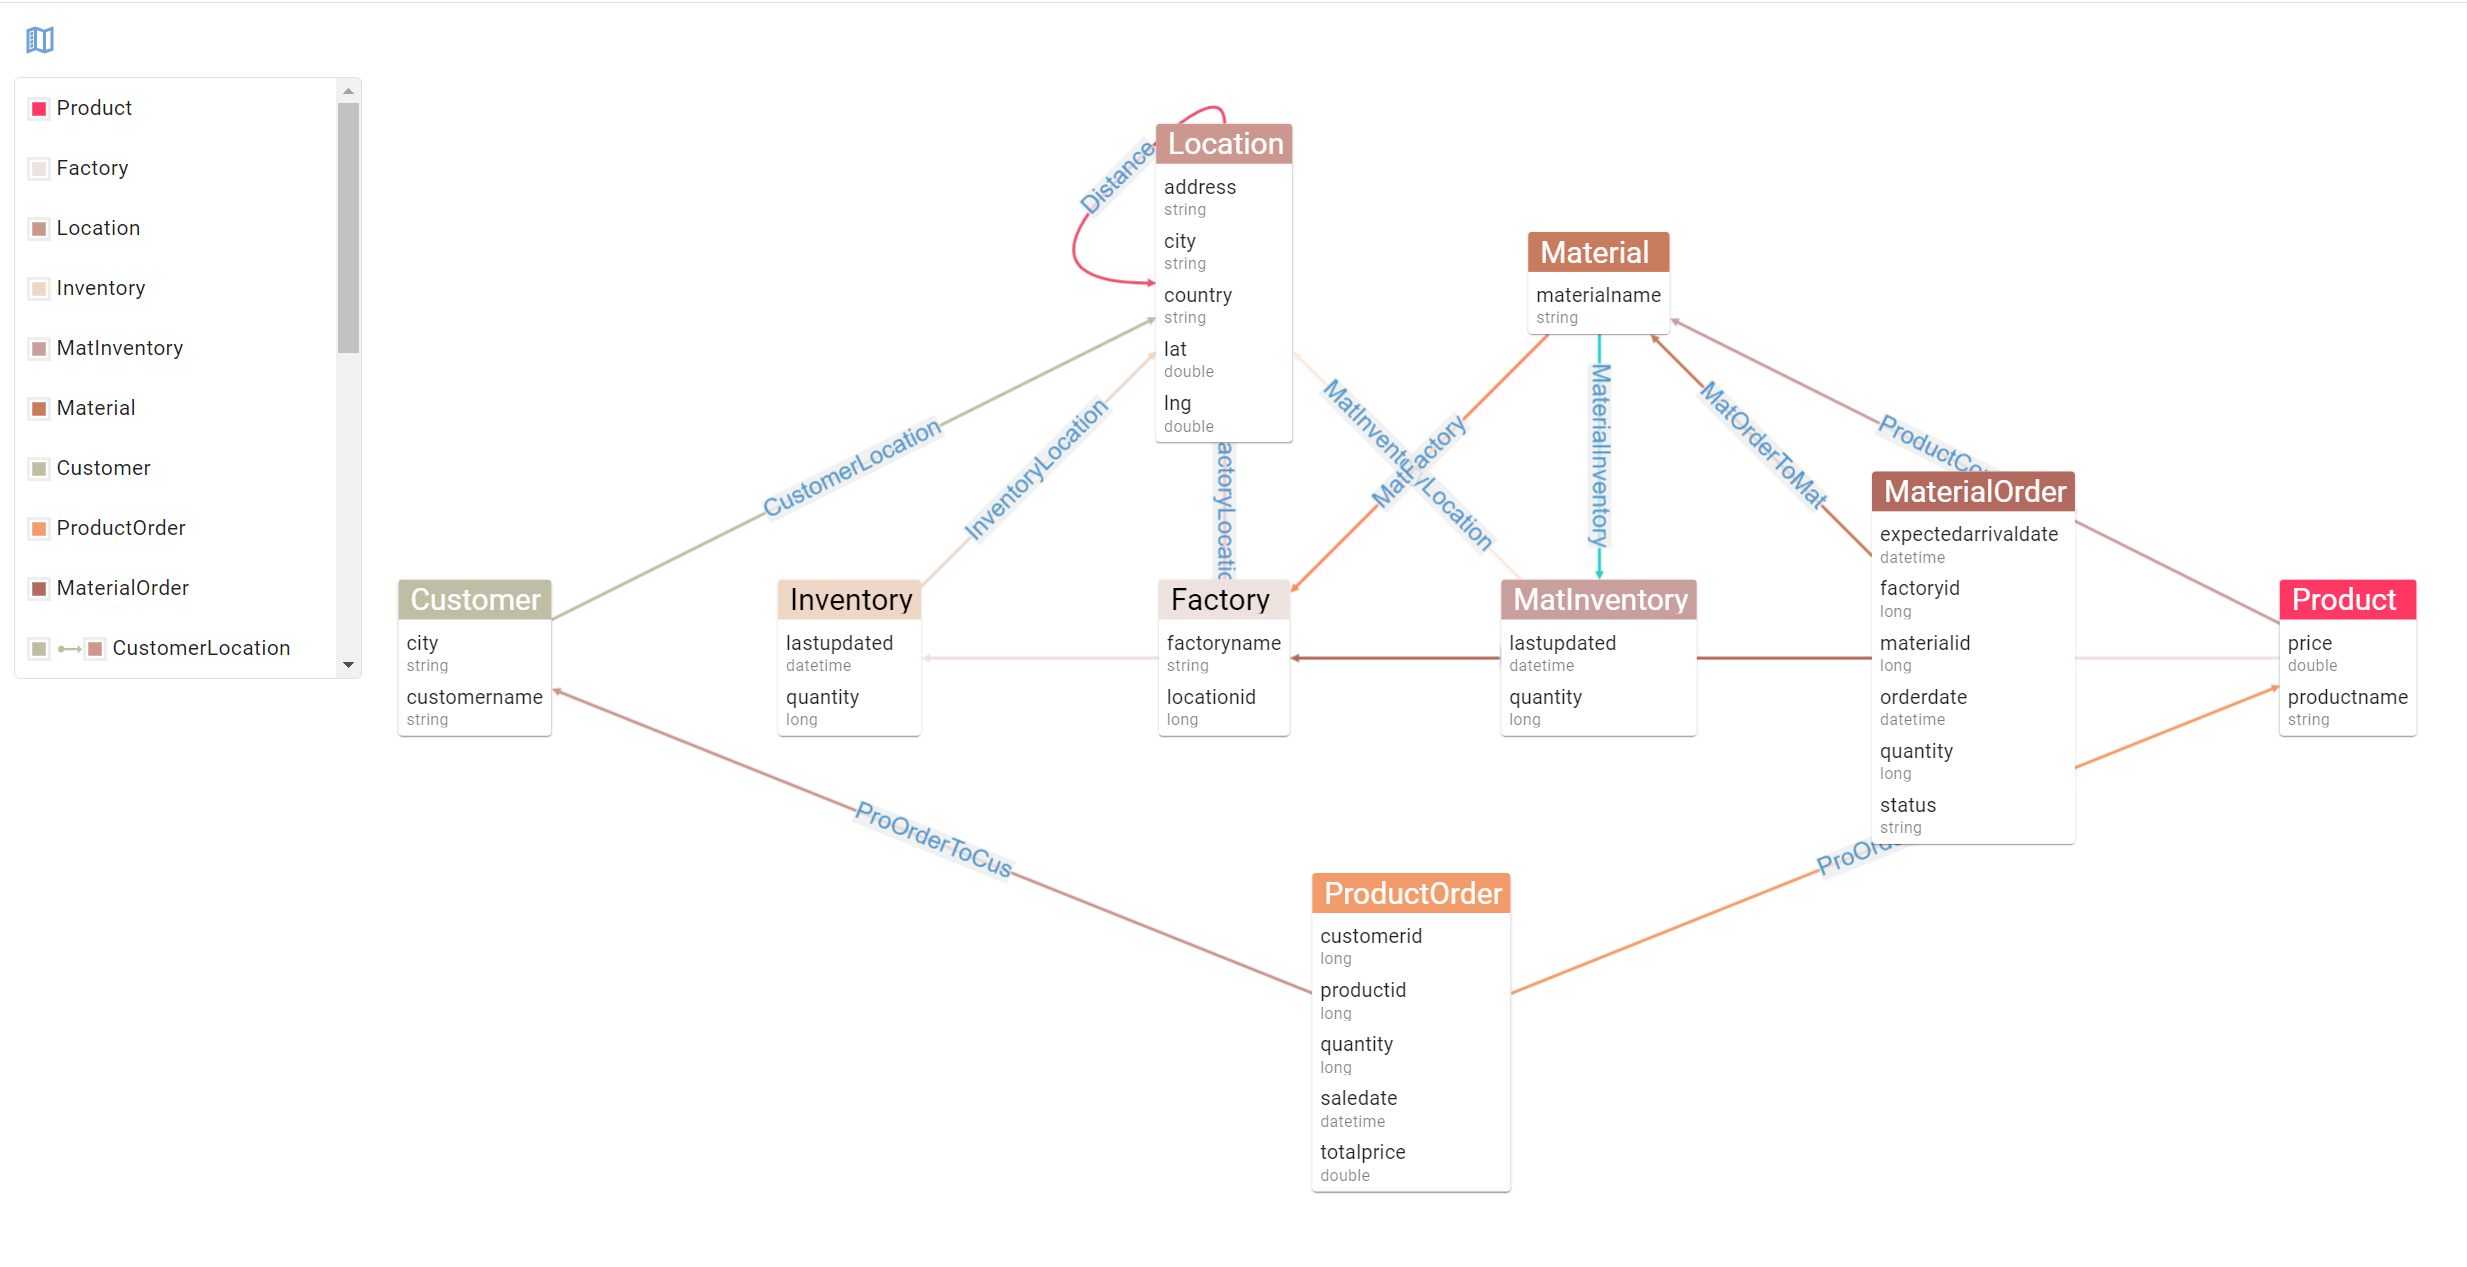
Visualize relationships between nodes easily with our graph data model viewer
Real-time Data Model Visualization
Once you’re set up, our software automatically detects the data schema of your database. You can then visualize your data schema as an entity relationship diagram, providing you with a concise and effective view of your database structure.
This crucial feature simplifies collaboration on your graph project by providing a consistent view for all its users.
Advanced Profiling and Traversal Explanations
Our profiling and explanation traversal features enables users to write better performing queries. It is compatible with provider specific implementations such as Amazon Neptune’s own profile and explain APIs. Our interface gives you instant access to performance optimization insights.
The query profile tab breaks down the full computation cost of your query step by step, highlighting potential bottlenecks and inefficiencies in your graph traversal.
The traversal explanation tab shows you how your database interprets the traversal and how it optimizes it. This lets developers ensure that provider specific optimizations such as indexes or caches are fully leveraged in their query.
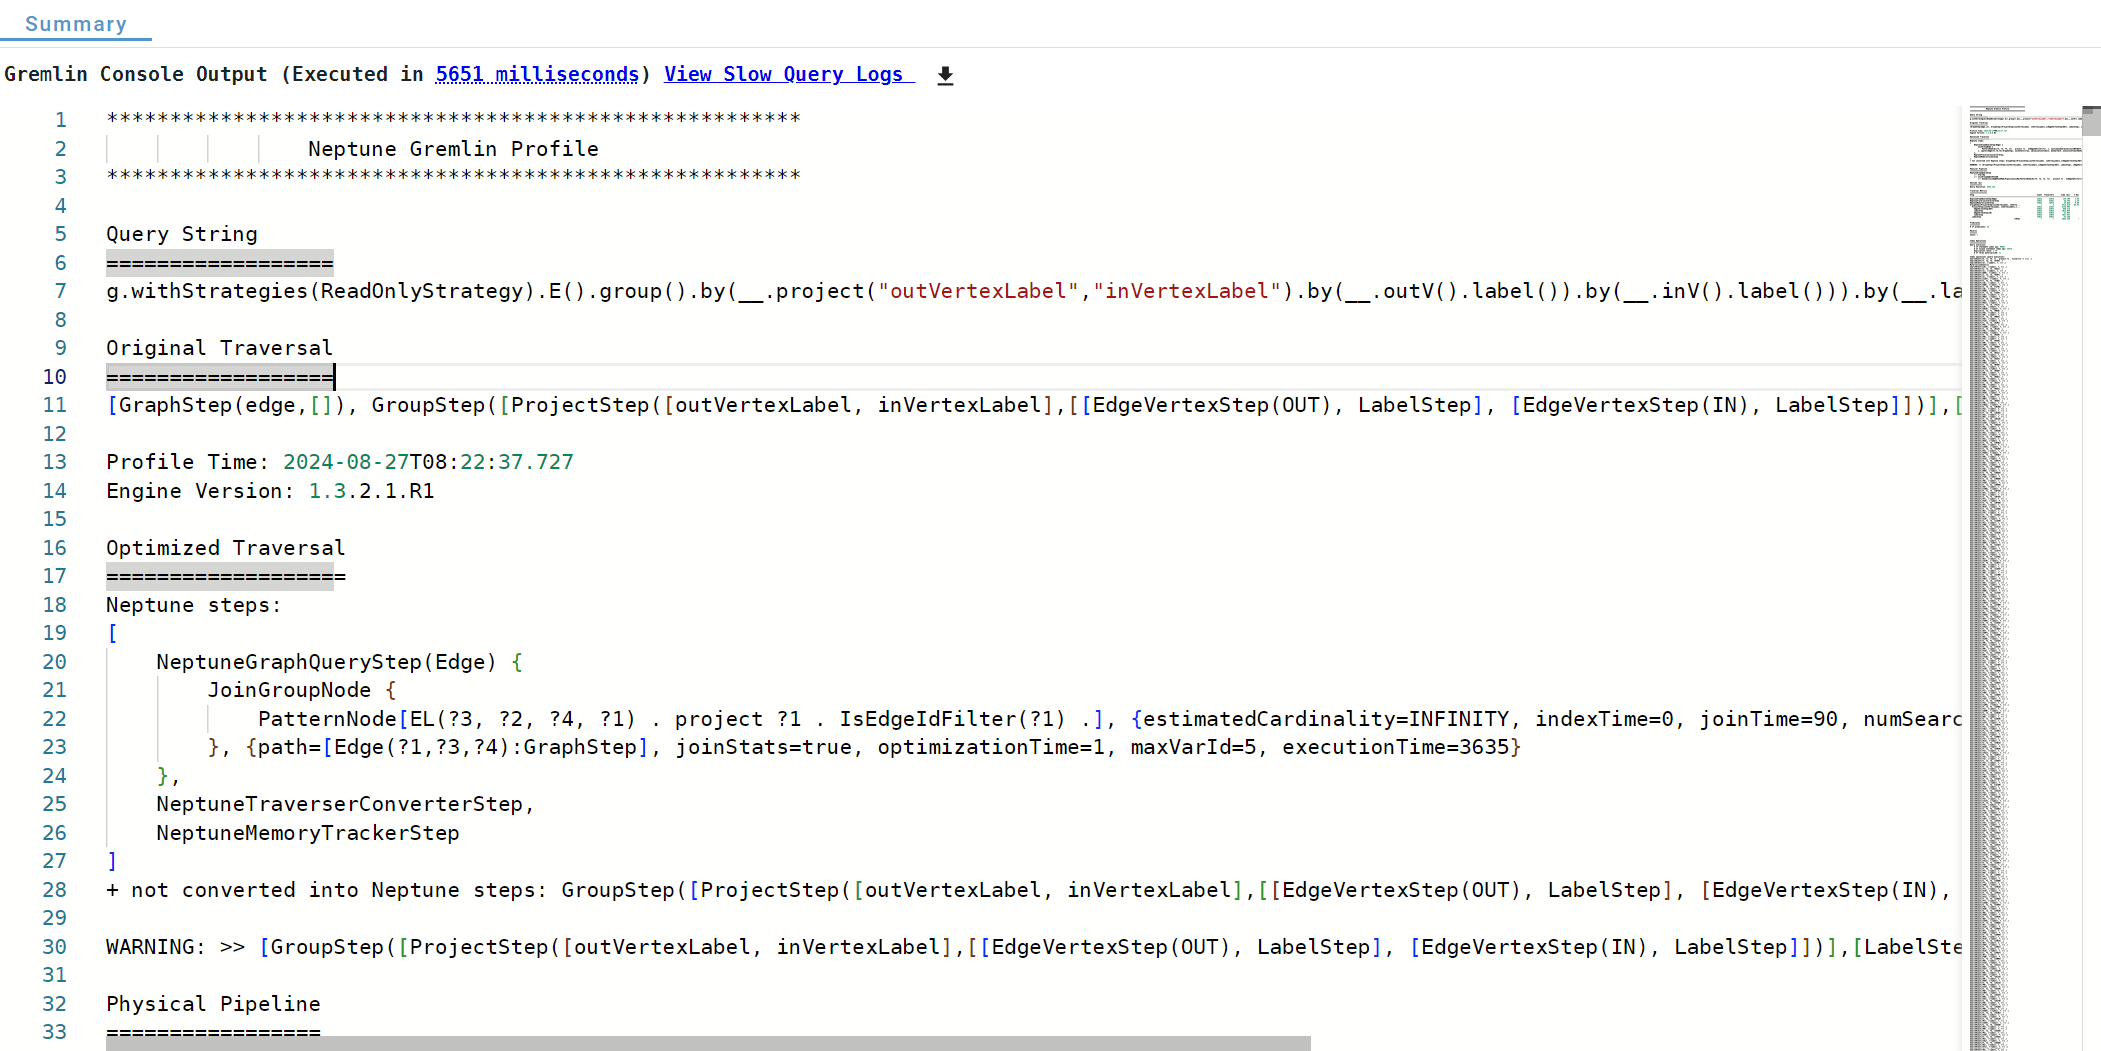
Get instant access to profiling information leveraging provider specific APIs
Save time and streamline development with our IDE. Sign up for a free trial now to get.
The Benefits of a Gremlin IDE for Graph Data handling
G.V()’s Gremlin IDE supports all the crucial aspects of your graph project. You’ll enjoy:
-
Enhanced productivity thanks to our leading Gremlin query language editor
-
Better collaboration capability with consistent graph data schema modeling and reporting
-
Streamlined problem solving with our debugging tools
-
Hassle-free query performance optimization with our provider specific tools
-
Seamless integration to your graph databases with our plug-and-play connection design
-
Tailored reporting and collaborative capabilities with our many analysis and data visualization
Query and analyze interconnected data effortlessly with our graph database visualization tools. Download and install G.V() today.
G.V() – Easily Visualize & Manage Graph Databases
G.V() is a user-friendly graph visualization client tailored for developers and analysts alike. It’s a must-have to support development on Apache TinkerPop graph databases.
From our developers to yours
G.V() was created by a small team of passionate developers to simplify day-to-day data handling and development efforts, both on early stage and mature, large projects.
Our aim is to improve to provide the ultimate tool for graph database developers. We continuously update our offerings based on your feedback, and regularly add new tools to our IDE suite . Feel free to reach out via email (support@gdotv.com) or on Twitter (X) and send us a message outlining your use cases or suggestions.
Use our Gremlin IDE to improve your development process. Sign up for a 1-month free trial now.
