JanusGraph Visualization Tool
Query, visualize and analyze your JanusGraph data with our interactive graph database visualization tool, G.V()
Overview
JanusGraph is an open-source graph database engine built under the Linux Foundation that offers high scalability and flexible storage/indexing configuration options. Its internal implementation branches from the Apache TinkerPop framework, with the goal to be optimized for storing and querying vast amounts of graph data.
It’s a transactional database meaning it supports concurrent users performing write operations, and is typically deployed using a multi machine cluster to perform analytic graph queries over large datasets. It’s a popular choice for enterprises and many organizations have deployed JanusGraph successfully, such as eBay and Netflix.
Our JanusGraph UI, G.V(), supports day-to-day operations from querying the data to visualizing and analyzing it, with the ability to interactively edit vertices and edges, as well as render large graphs for investigation purposes.
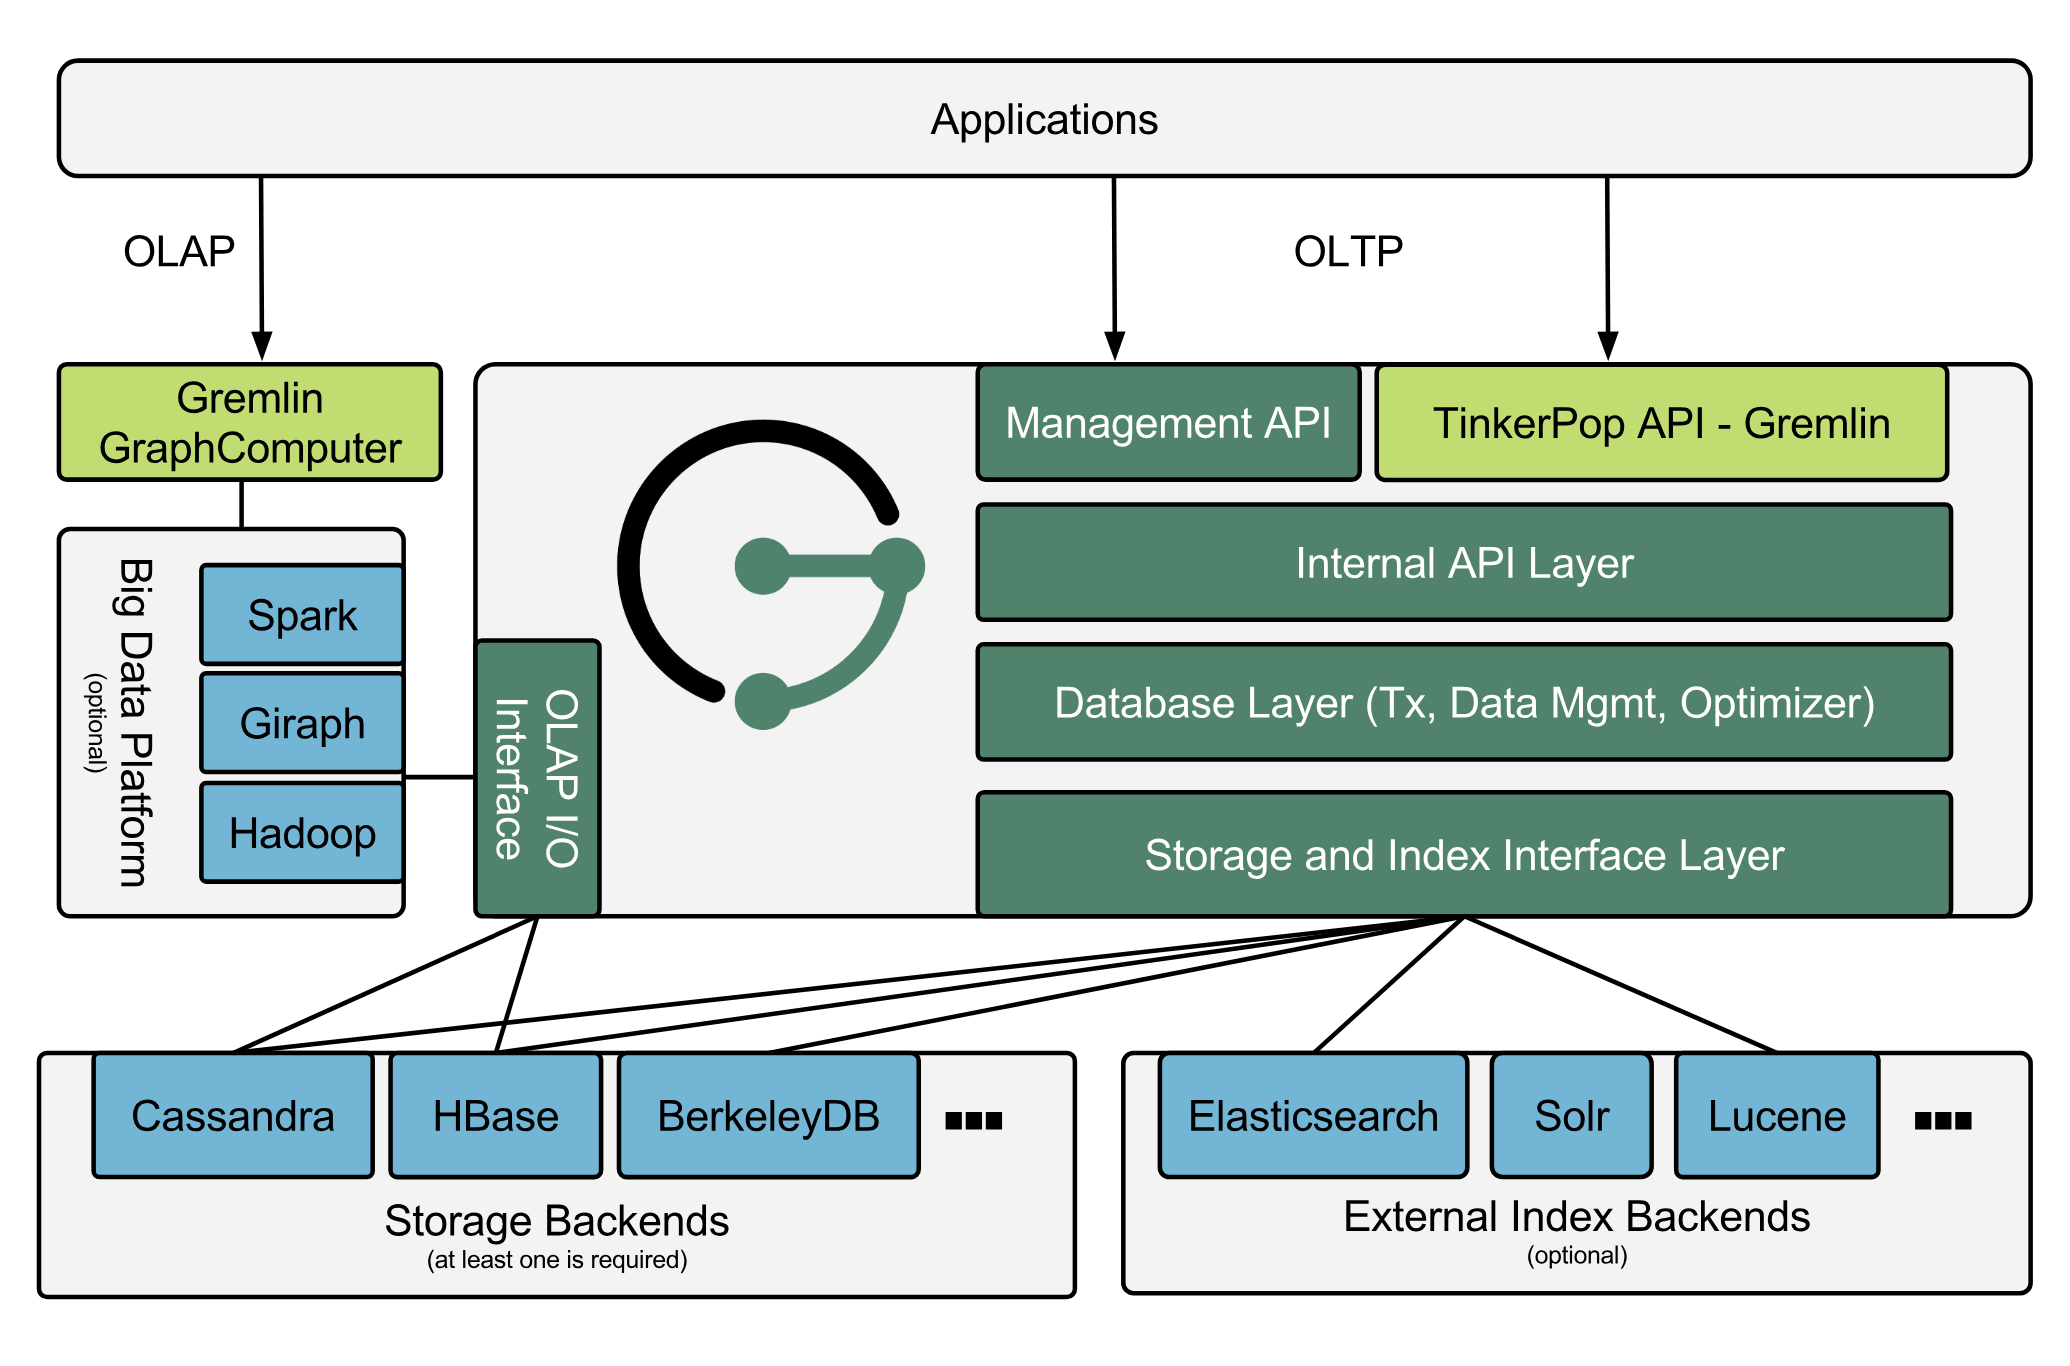
A sample enterprise deployment architecture highlighting the versatility of JanusGraph
Built for the JanusGraph Database
G.V() is purpose-built to support JanusGraph users – our software’s functionality is optimized for JanusGraph’s behavior and APIs.
Instant Graph Data Schema Loading via Schema Management API
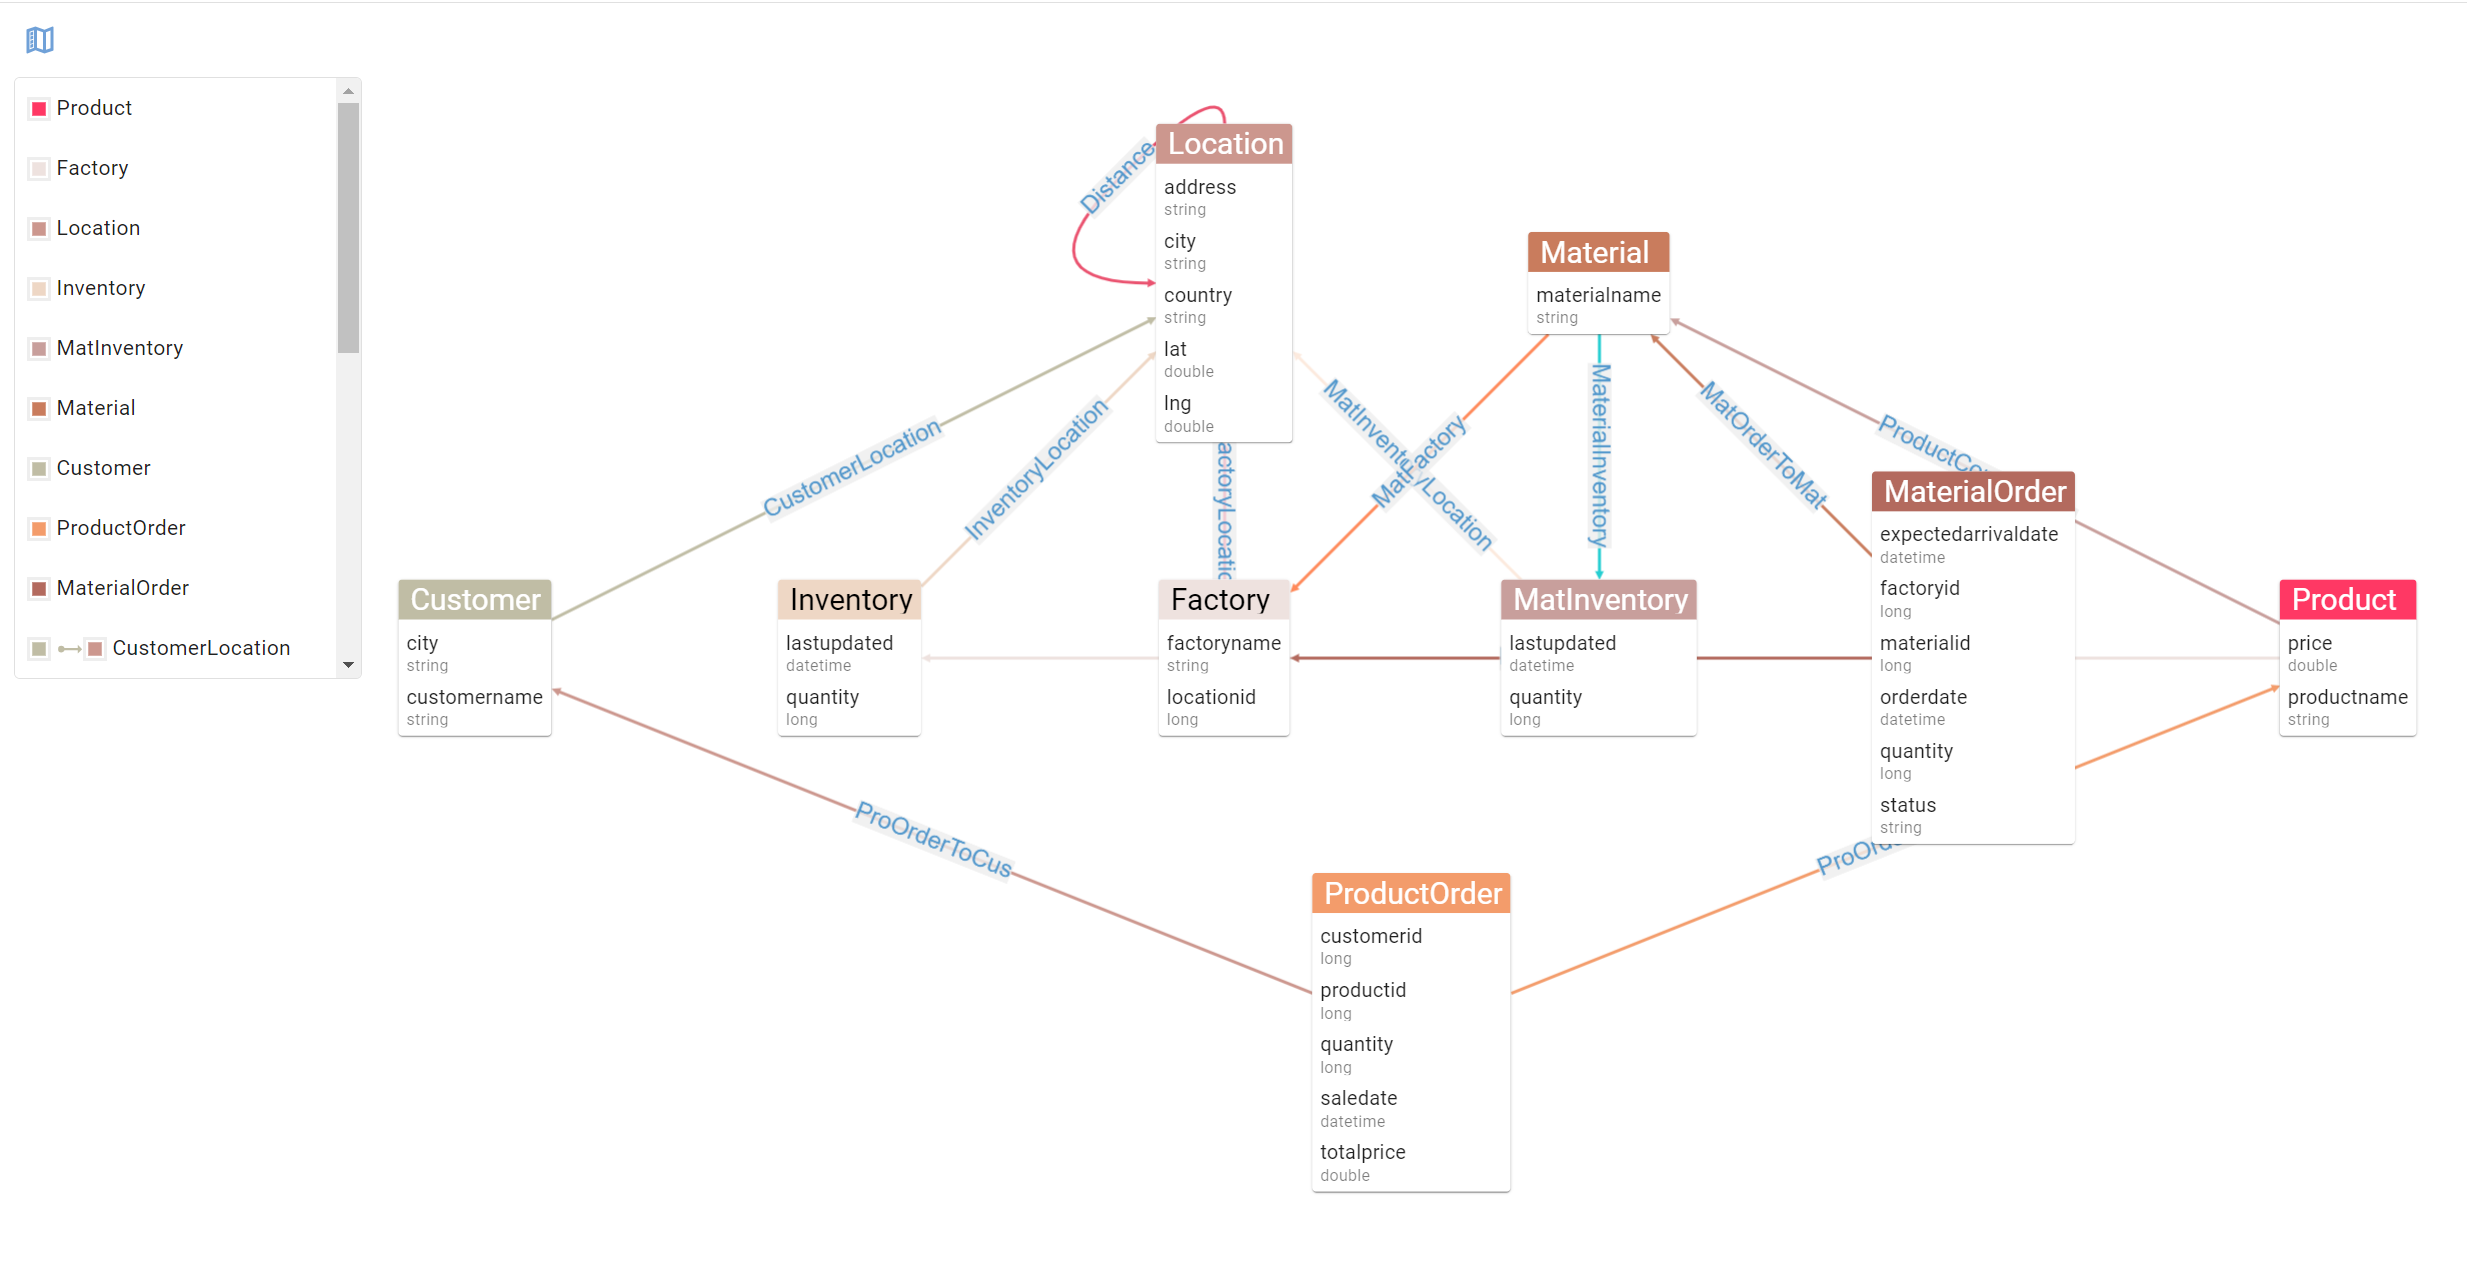
G.V() leverages JanusGraph’s schema management features to deliver an instant view of your graph database’s structure, without the need to scan for its vertices and edges.
By building an understanding of the JanusGraph data model, G.V() can deliver accurate autocomplete suggestions as you write Gremlin queries, and tailor its many features to be fully aware of your schema.
Automatic Code Completion
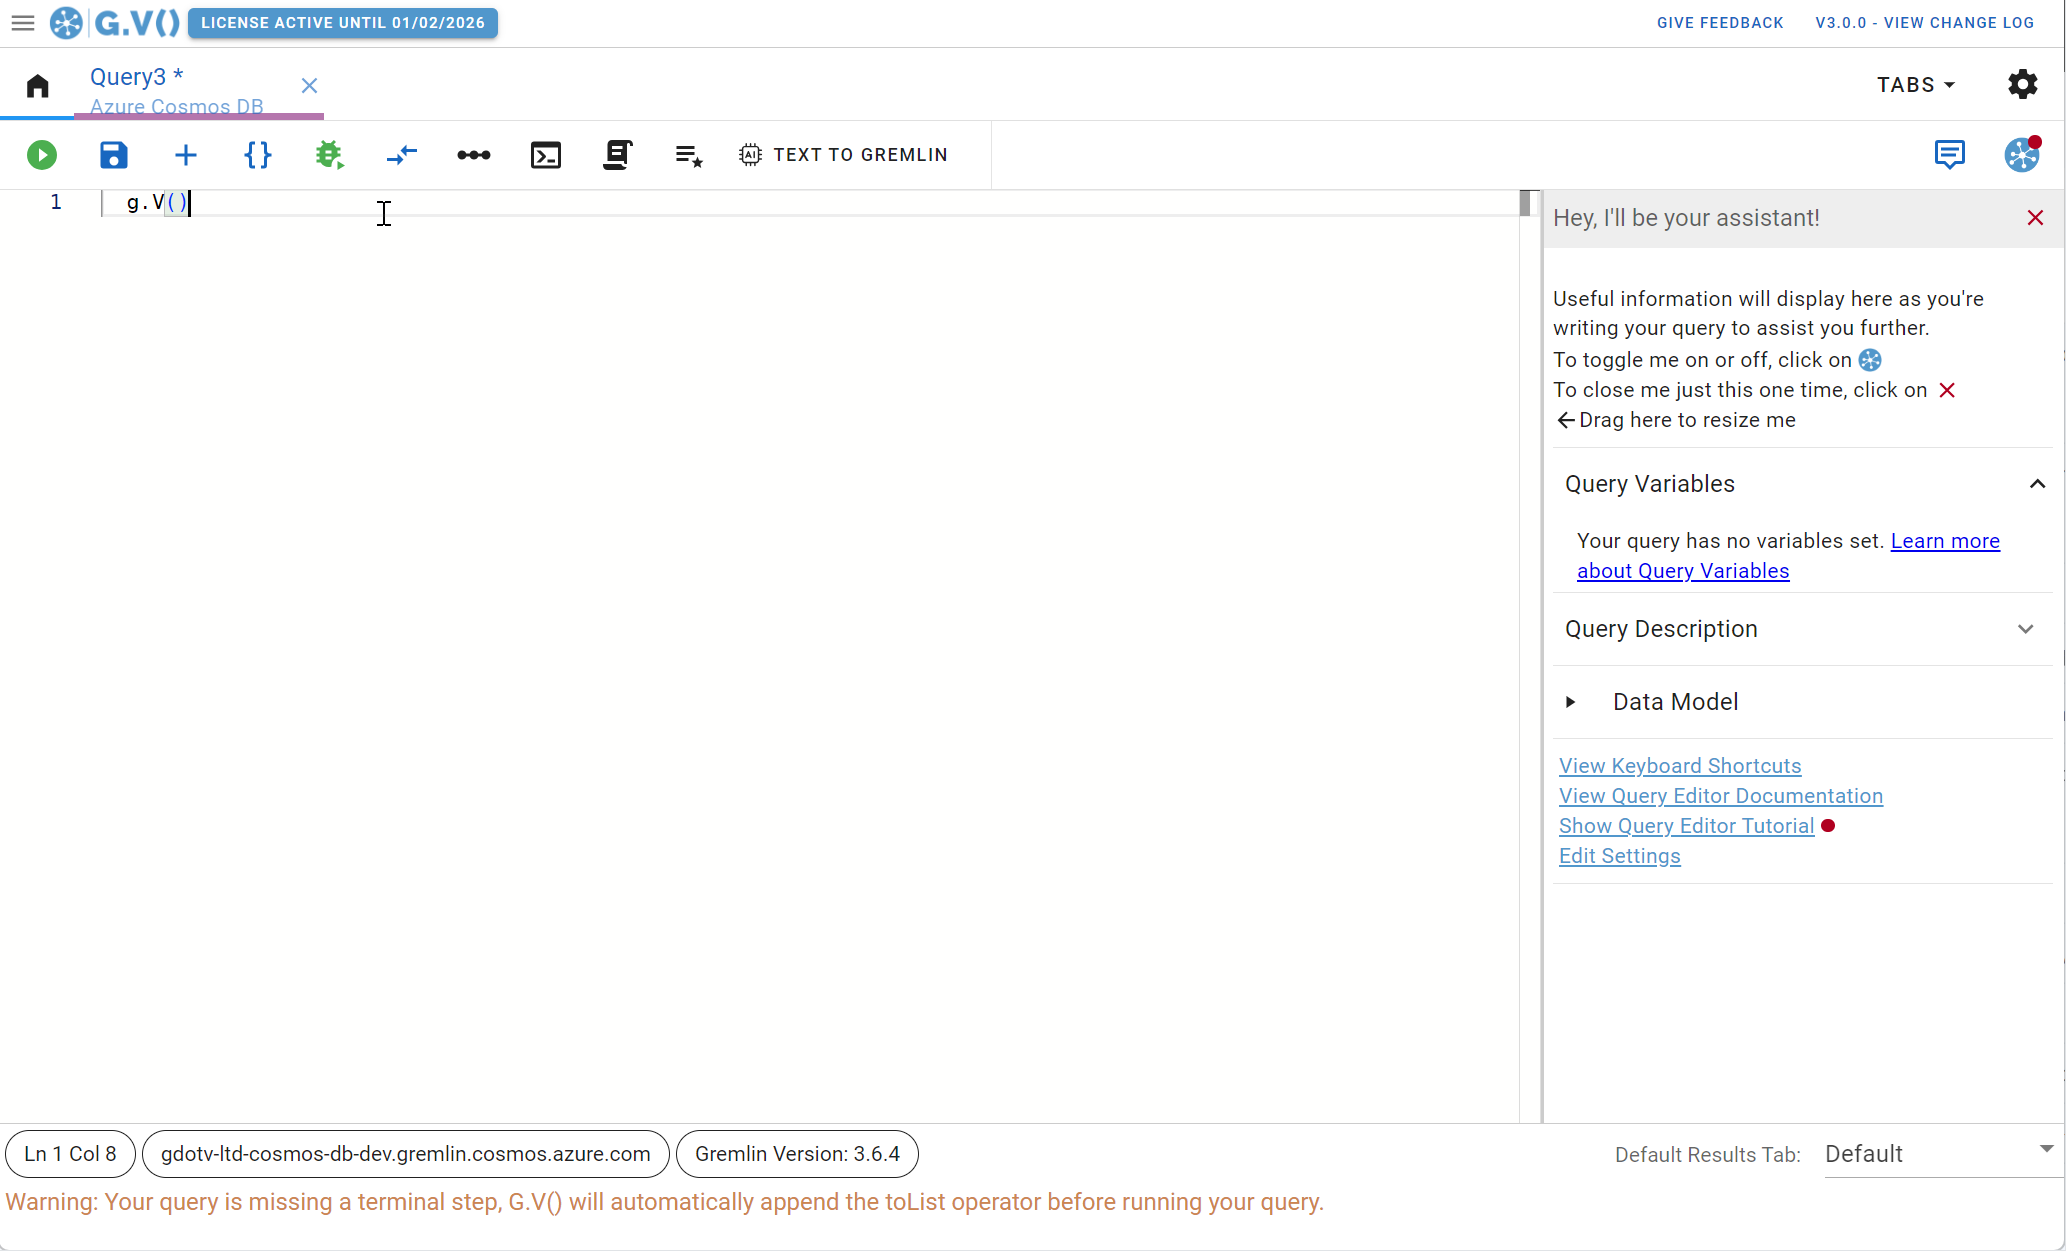
G.V() offers the most feature complete Gremlin query editing functionality in the market. With our query editor, you can access graph data model accurate autocomplete suggestions, embedded official Gremlin documentation, syntax highlighting/validation, and much more.
Our query editor can also be used to customize your data model via JanusGraph’s schema management API.
Customizable Data Visualization
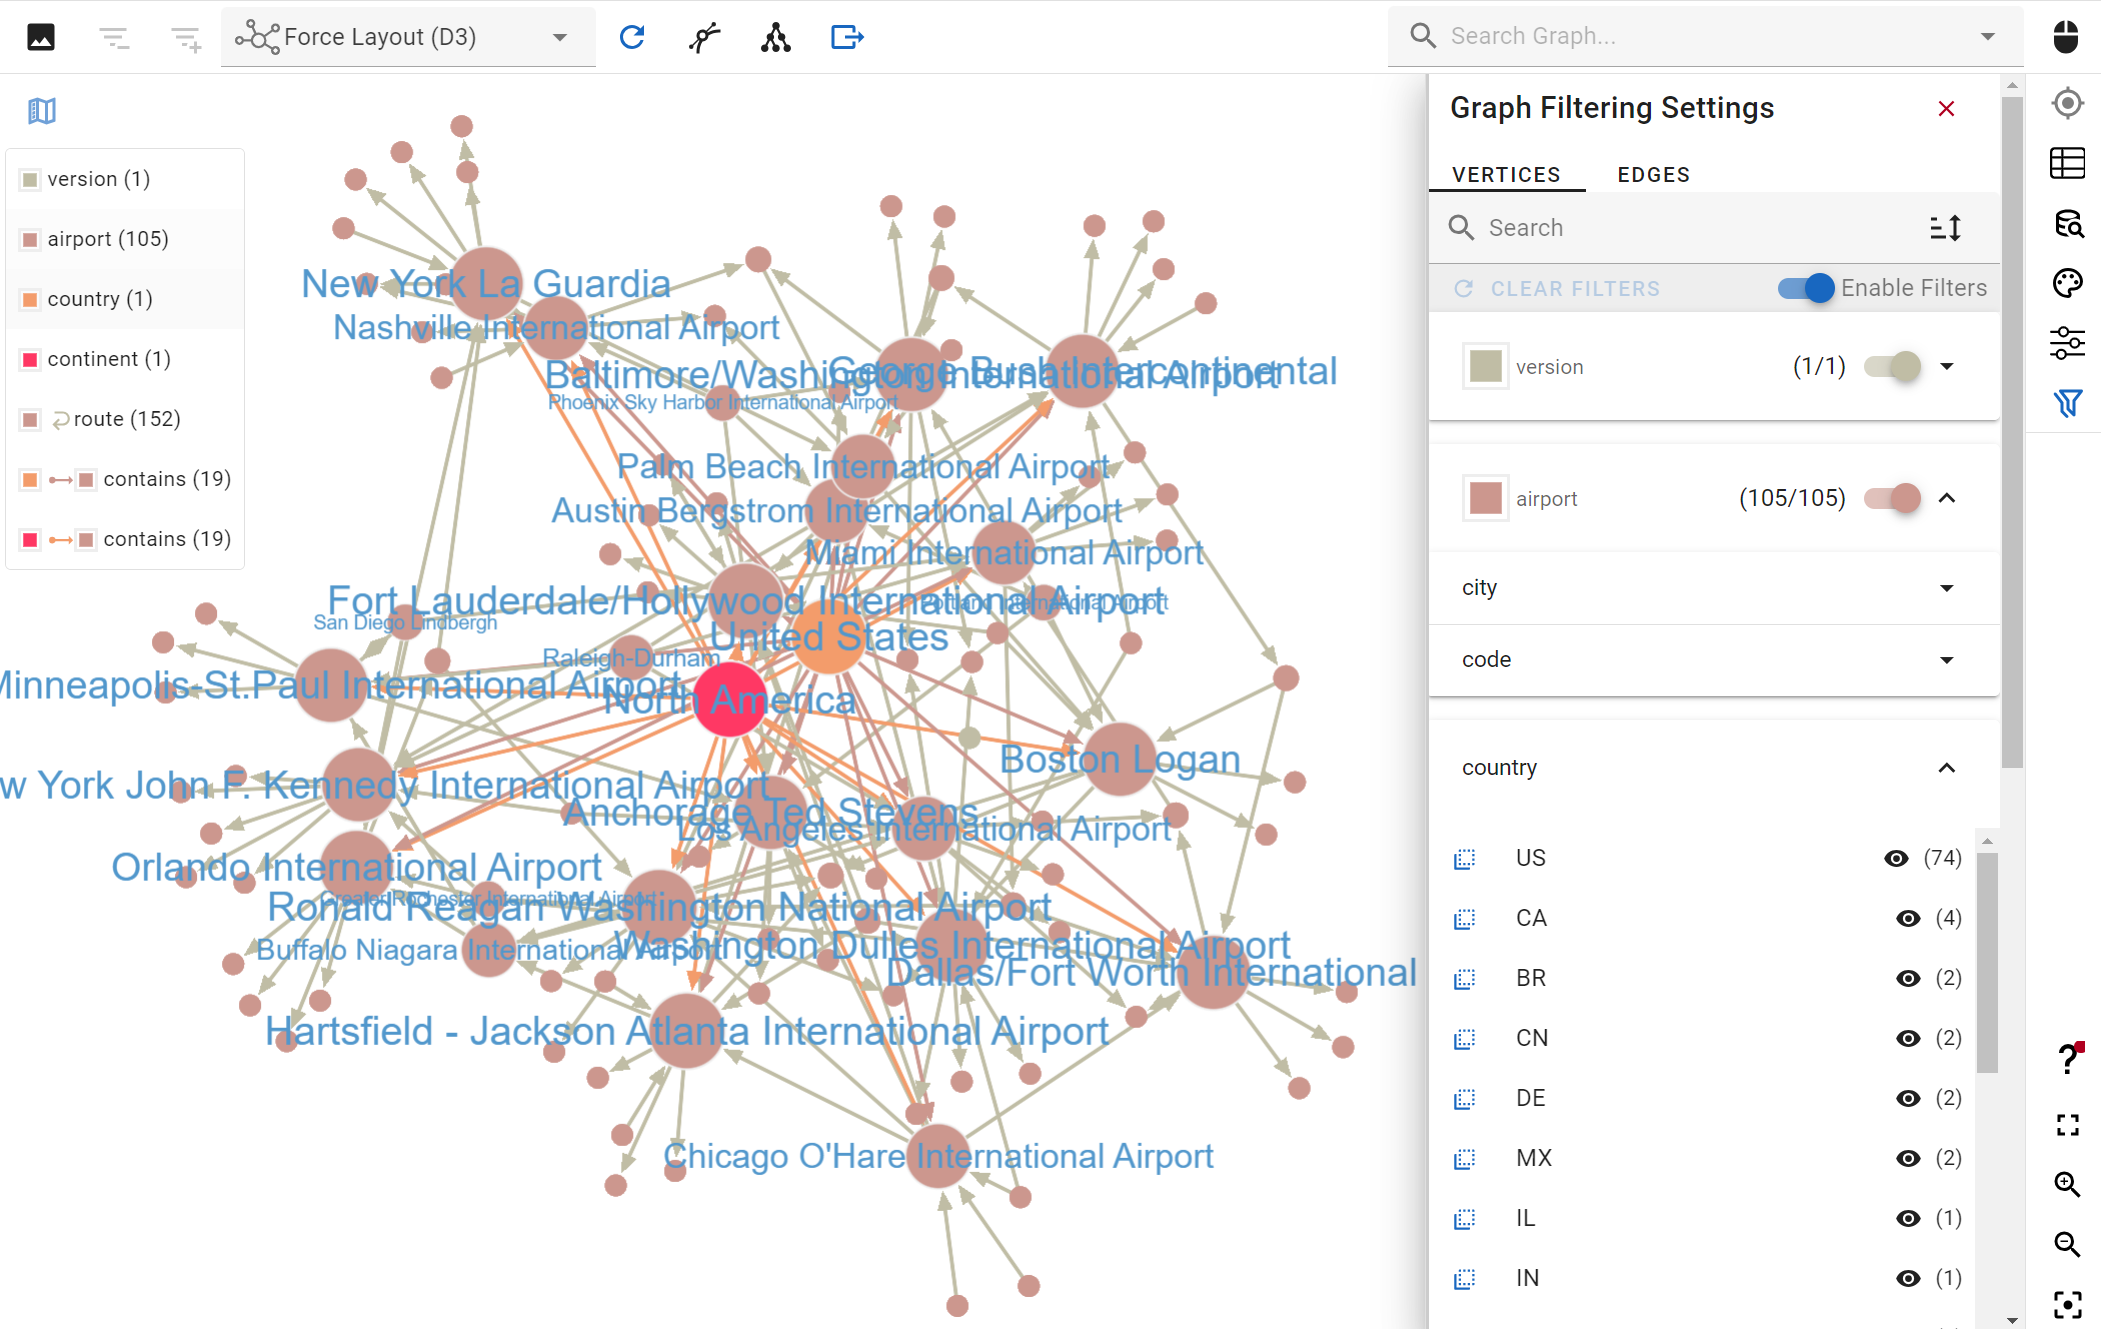
Our database visualization tools offer various data reporting formats (table, graph, JSON) and customization options.

Viewing retrieved node data in a tabular format for easy comparison
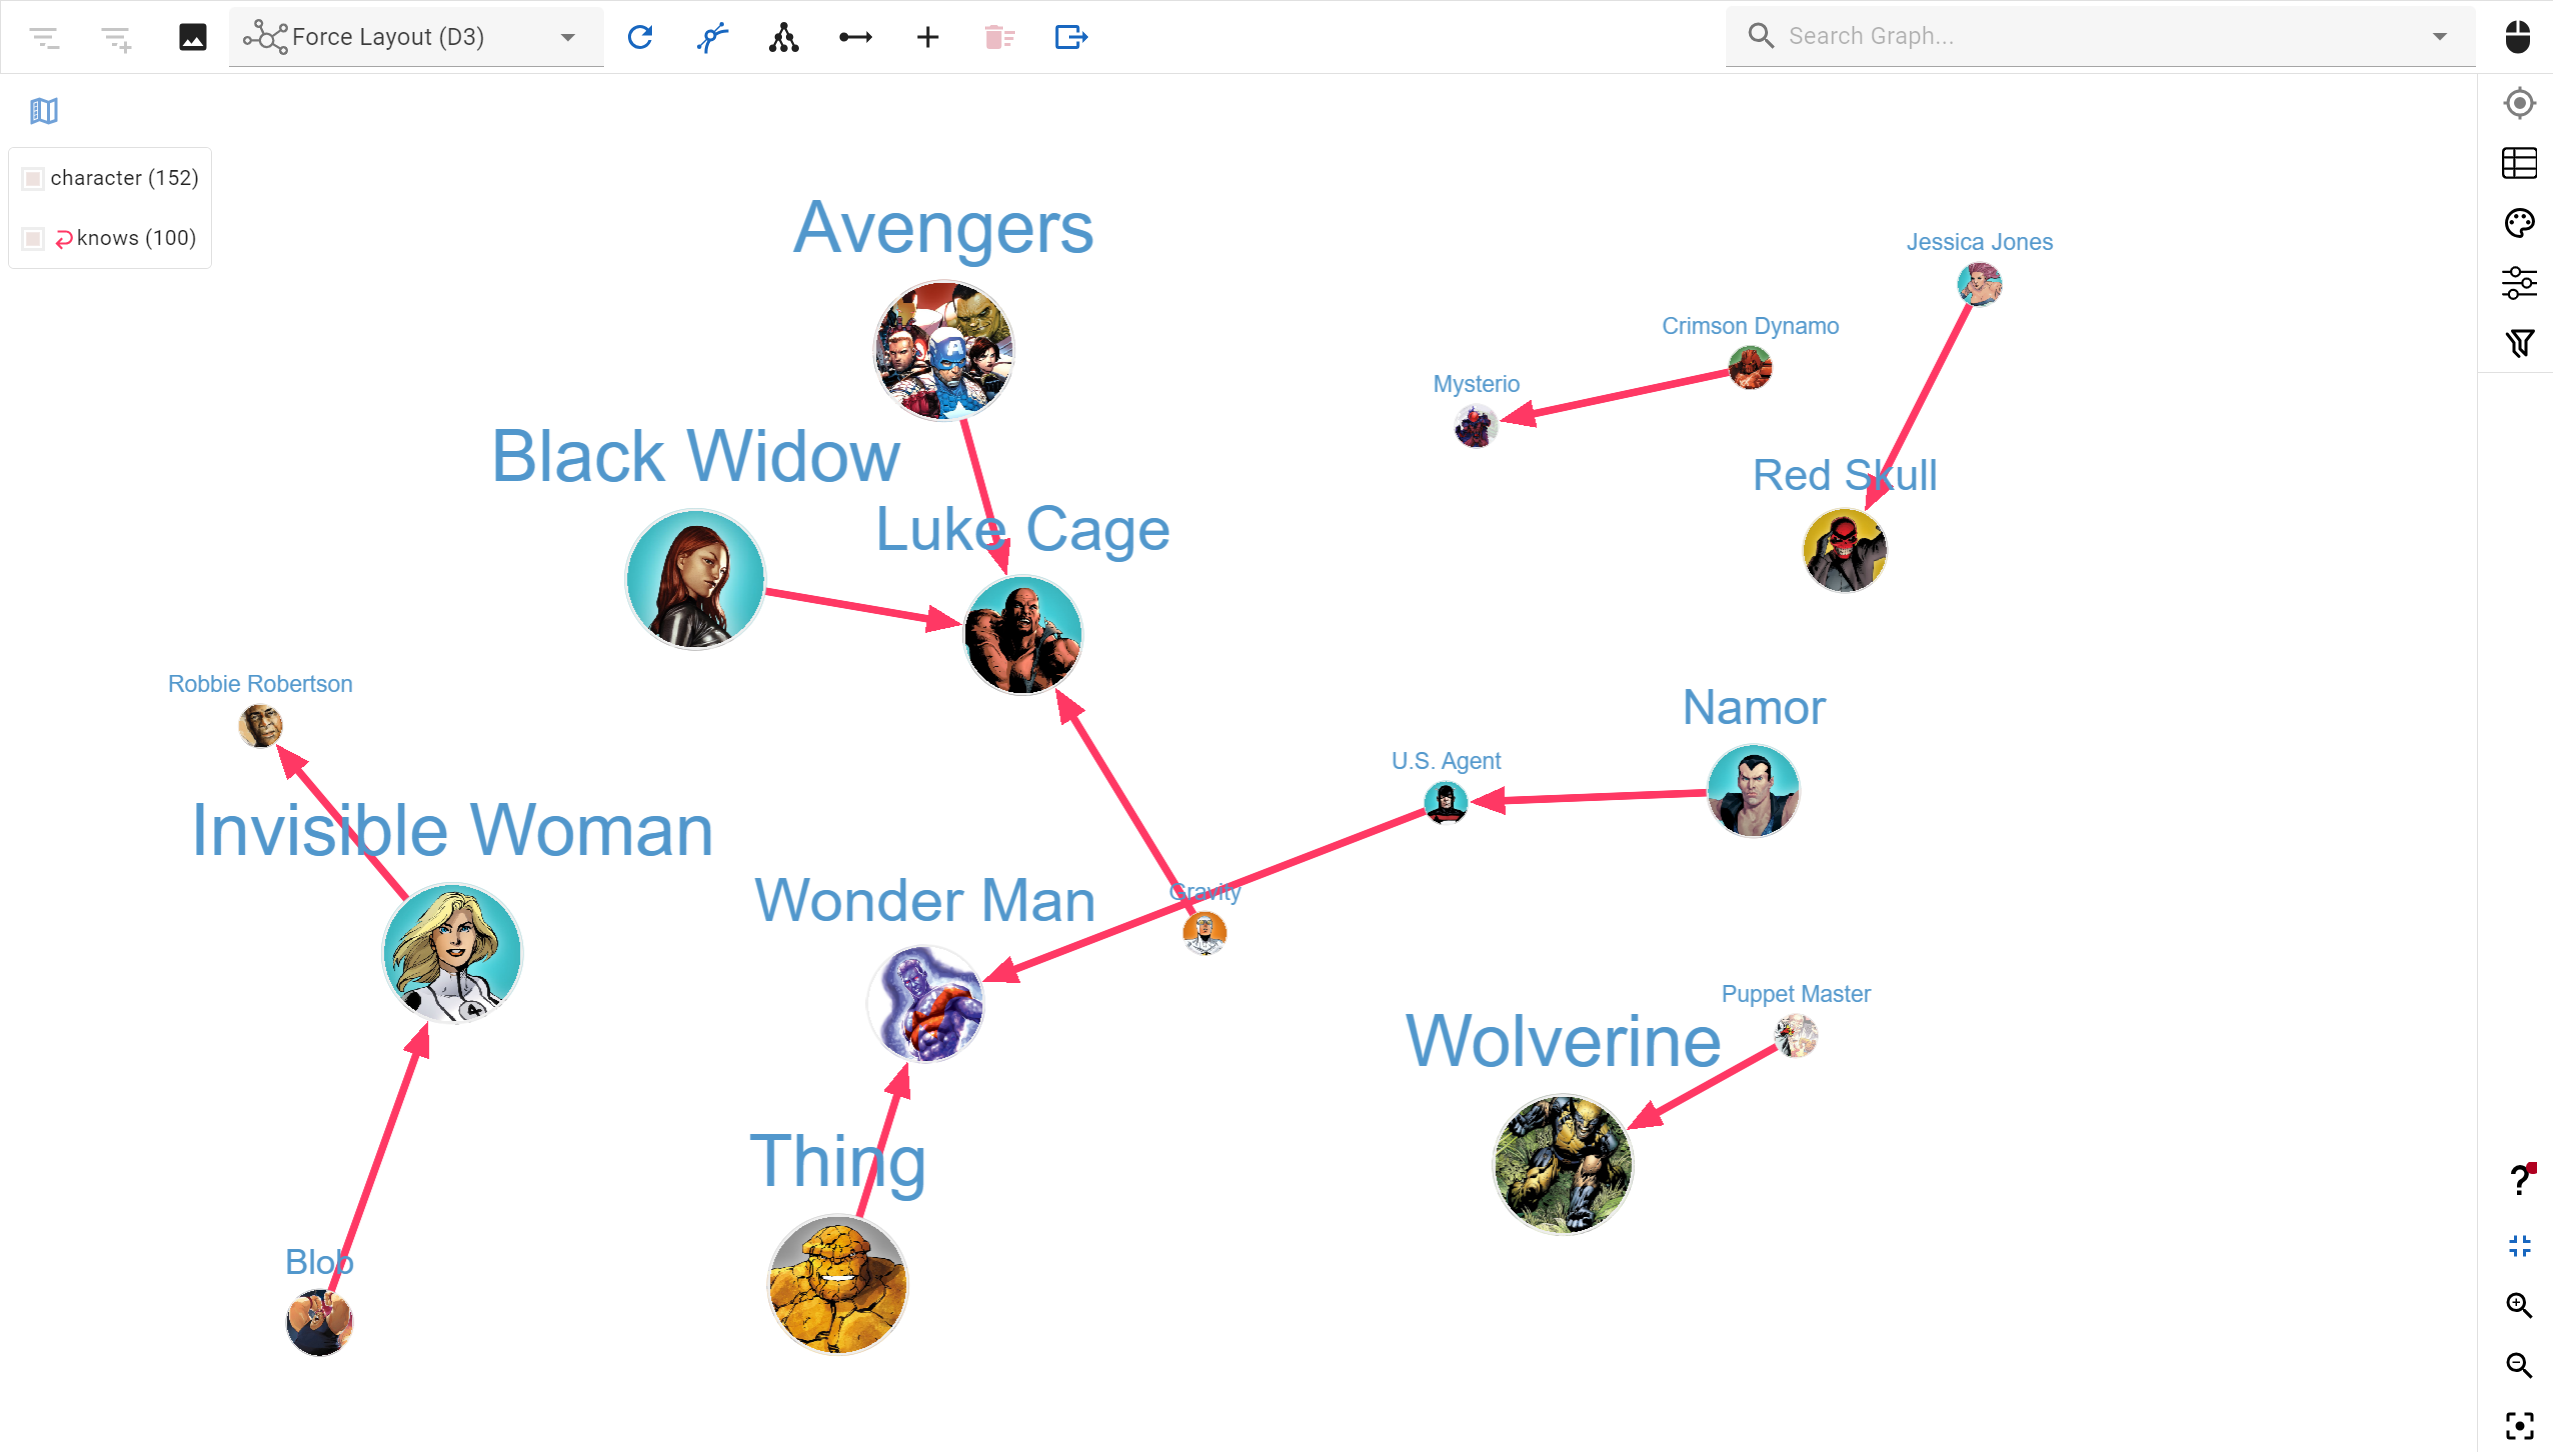
A sample graph display using images loaded directly from the graph data
You can stylize vertex or edge displays based on their labels and properties. This allows you to render them with custom sizes, colors, background images, shapes and labels.
Advanced Authentication support
Enterprise implementations of JanusGraph often include custom authentication and authorization capabilities that can be difficult to integrate with third-party solutions due to their bespoke nature.
G.V() offers both basic authentication capabilities for username/password via standard Gremlin driver functionality as well as advanced configurations, such as Kerberos authentication or execution of a custom script to generate or retrieve credentials on the fly.
This is ideally suited to JanusGraph based enterprise knowledge graphs that are either fully integrated to the enterprise’s internal user directory or that implement their own authentication and authorization module with specific requirements.
To find out more, check out our documentation.
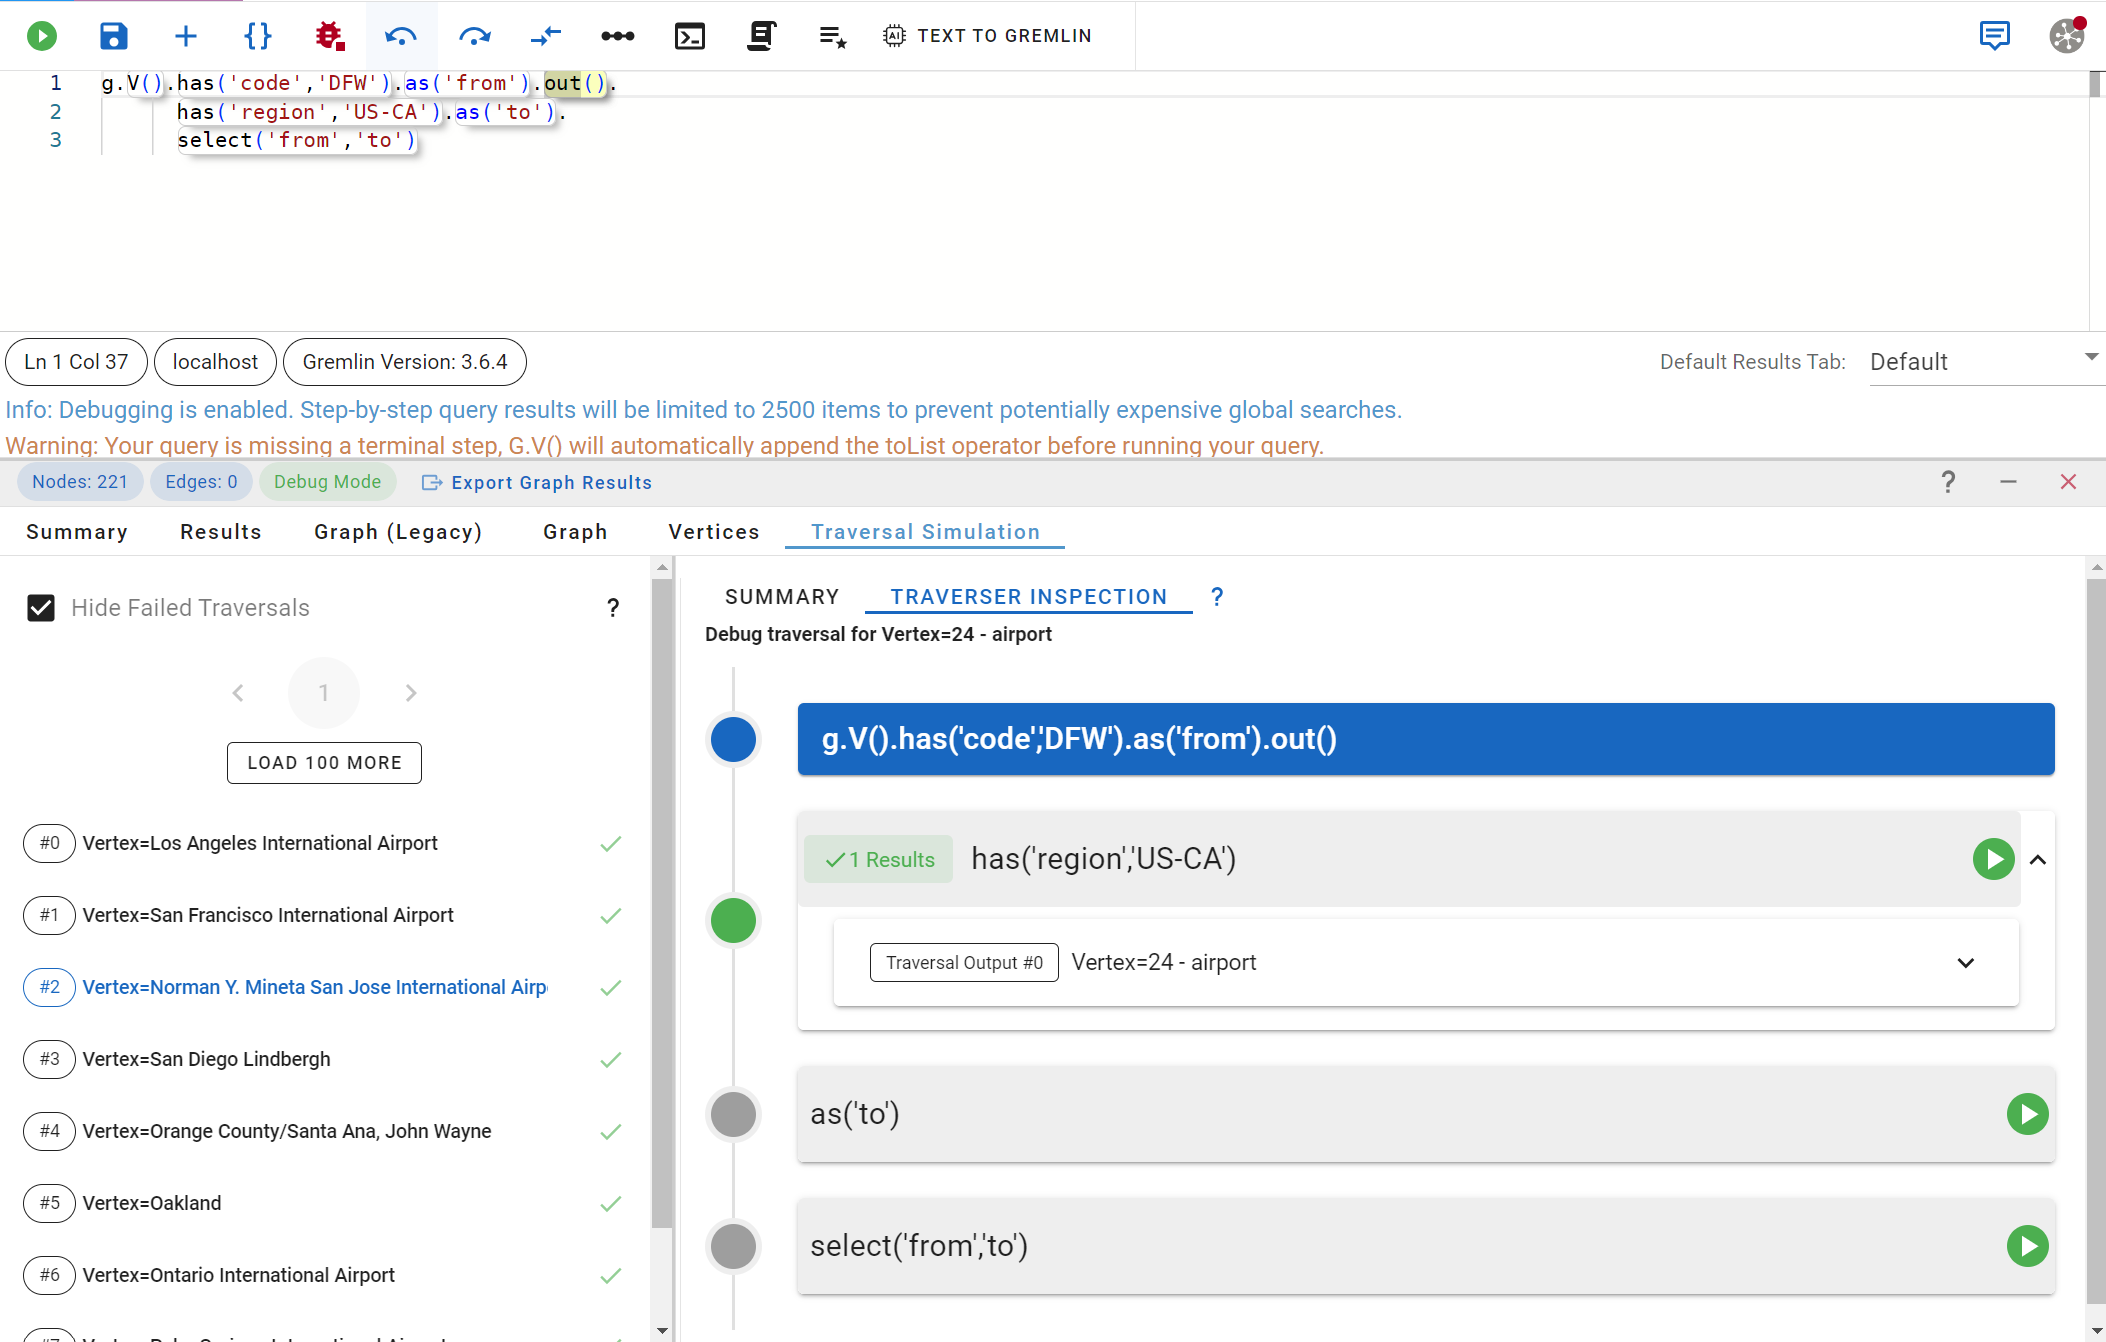
A sample query debugging screen simulating an individual graph traversal for a Gremlin query.
Gremlin Query Debugging
Querying large graphs efficiently can be challenging – to assist with querying your data, G.V() offers unique debugging and profiling features that can simulate complex traversals of your graph to inspect and troubleshoot the behavior of your query.
Our debugging tools can display the data at each step of the querying process so you can identify the exact point where your Gremlin query failed or ran into a bottleneck.
Effortlessly visualize graphs stored in JanusGraph
With our no-code graph database browser makes querying graphs simpler by eliminating the need to write Gremlin queries. Our interactive graph visualization tools can be used to navigate and edit vertices, edges and their properties in just a few clicks.
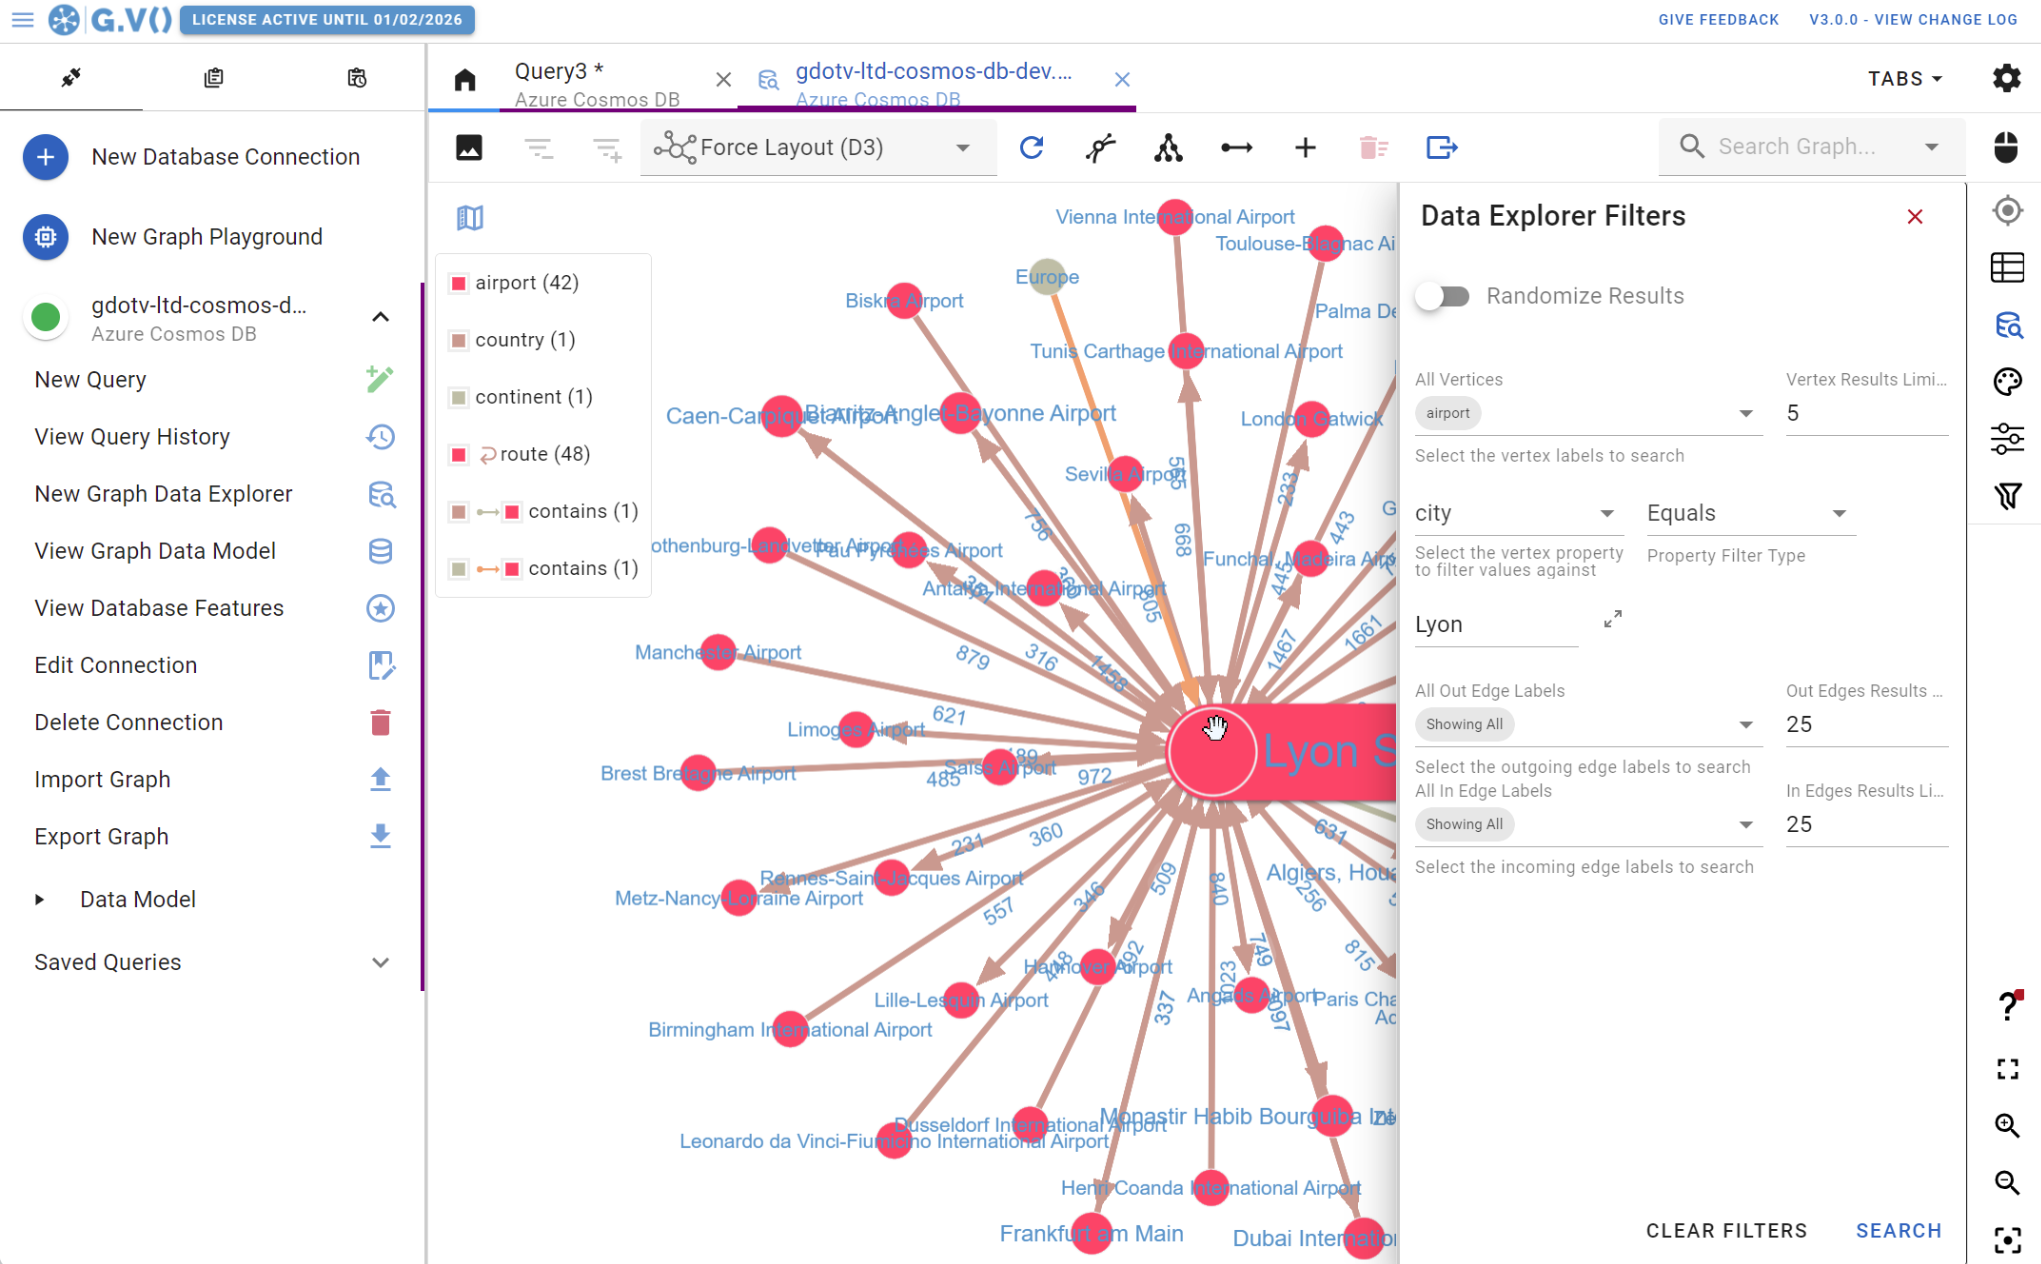
Search, visualize and explore your data interactively using our no-code Graph Database Browser
A sample query debugging screen simulating an individual graph traversal for a Gremlin query.
Use G.V()’s tailored features to streamline JanusGraph database operations.
Stay updated with our new releases and feature updates by following us on LinkedIn.
A Powerful Database Client for Graph Visualization with JanusGraph
Change the way you analyze graphs with G.V()’s plug-and-play facilities paired with a dynamic and user-friendly interface. Our graph database client can assist users in querying large sets of data with ease. It also enables users to understand complex graph data in a simplified way to speedily identify trends, patterns and relationships.
We work directly with the JanusGraph team and other enterprise-level graph database technologies such as Amazon Neptune, PuppyGraph, Gremlin Server and more. You can find us and other JanusGraph users on the official JanusGraph Discord server.
The G.V() software is compatible with Windows, MacOS, and Linux. It is secure by design and unlike solutions deployed over a network, G.V() is only accessible locally on your device. All of your data is processed locally on your device and within the perimeter of your enterprise network.
Developed by Graph Database Experts
G.V() is a user-friendly graph database client built by a dedicated team of developers. Our graph visualization tool is cost-effective and gives you first-class support to perform day to day graph database operations.
We aim to continuously improve our offers by collaborating with our clients and taking on helpful user feedback on the overall experience and feature improvements.
Experience powerful JanusGraph visualization capabilities by integrating our intuitive G.V() software.
Download G.V() today and enjoy a free trial for up to a month.

