What Went Down at Connected Data London 2025 [Recap & Reflections]
![What Went Down at Connected Data London 2025 [Recap & Reflections]](https://gdotv.com/wp-content/uploads/2025/12/gdotv-recap-connected-data-london-conference-2025.png "What Went Down at Connected Data London 2025 [Recap & Reflections]")
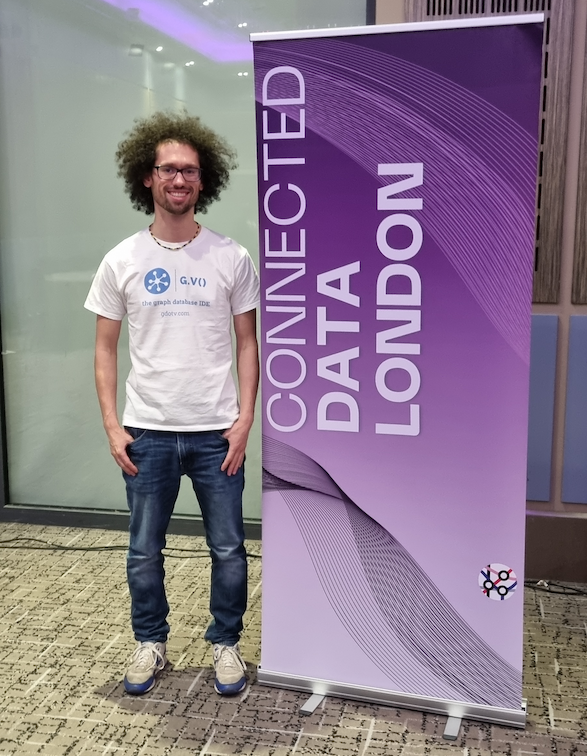
Despite a delayed train down from Glasgow, I had a great experience attending the Connected Data London conference this year. It was my first time going to an industry event like this on my own, after travelling with Arthur to New York City for the Knowledge Graph Conference last May.
It was different being an attendee rather than a sponsor (like we were at KGC), as I was able to take in as many of the fascinating talks as the aforementioned train trip allowed me to. I only wish I’d been able to attend the Thursday talks as well.
I had imagined that not standing in front of a booth all day might have also made it more difficult to strike up conversations, but I was pleasantly surprised. During the breaks, there was almost no time to breathe in between all the lovely faces approaching me and getting down to some serious graph talk!
Here are a few of my reflections and takeaways from attending Connected Data London.
Key Talks & Presentations from Connected Data London
With my role as software developer for G.V() being my first in the world of graph technology, it is almost intimidating how vast the scope of knowledge graphs appears to be, but also quite refreshing how relatively small and tight-knit the community around it is.
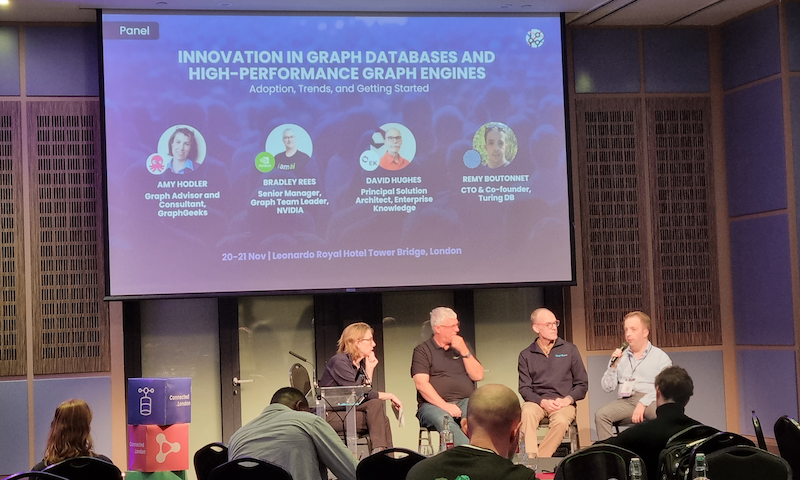
So it was pretty cool that while watching the panel discussion about ‘Innovation in Graph Databases and High-Performance Graph Engines’, I realised I had already met or had some sort of contact with three out of the four panel members – David Hughes, Rémy Boutonnet, and Amy Hodler – in my short graph journey so far. Actually, you could technically count it as all four because I had even chatted to Bradley Rees about his talk on Benchmarking GraphRAG earlier in the day.
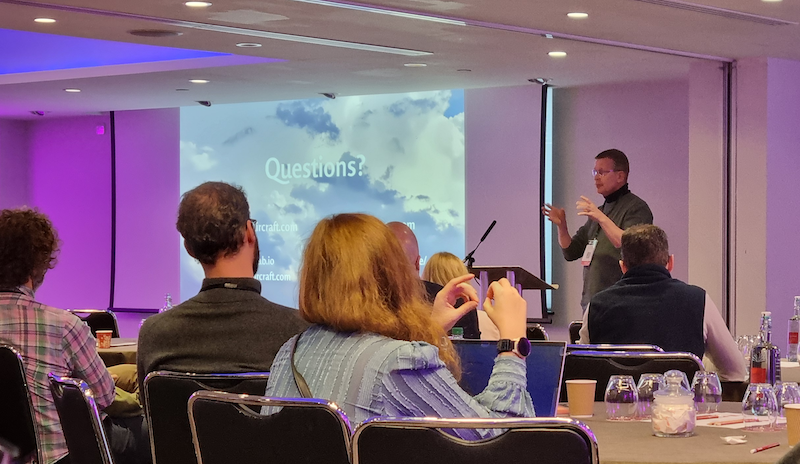
There were a few more talks I found particularly interesting and relevant to my work. Ora Lassila’s talk on ‘Generating Knowledge Graphs from Legacy Data’ gave me some insight into how RDF graphs can be mapped from various sources. G.V() only recently added RDF support, with Amir doing the bulk of the work, meaning my understanding of it is still fairly basic. So being able to see how it relates to the likes of relational databases and JSON in this way really helped provide a good deal of context.
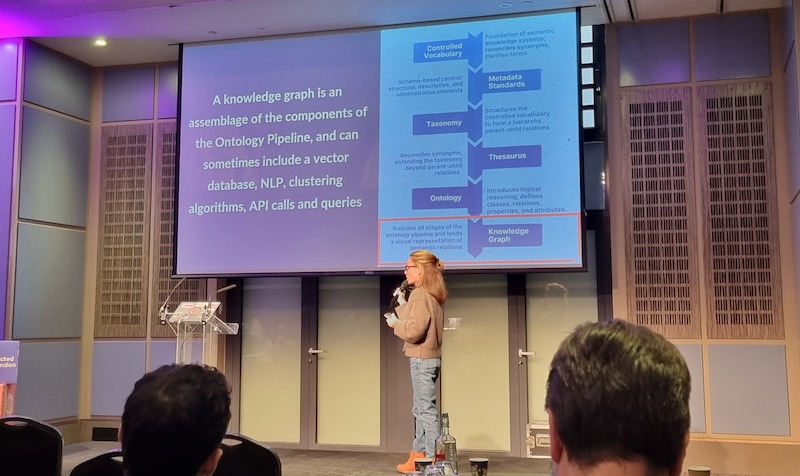
I especially enjoyed Jessica Talisman’s presentation on ‘Knowledge Infrastructures and the Ontology Pipeline for AI Systems’ (extra props to Jessica for rescheduling on what seemed like very short notice). It was very much appreciated after my brain was trying to catch up from what felt like an all-nighter on my way down!
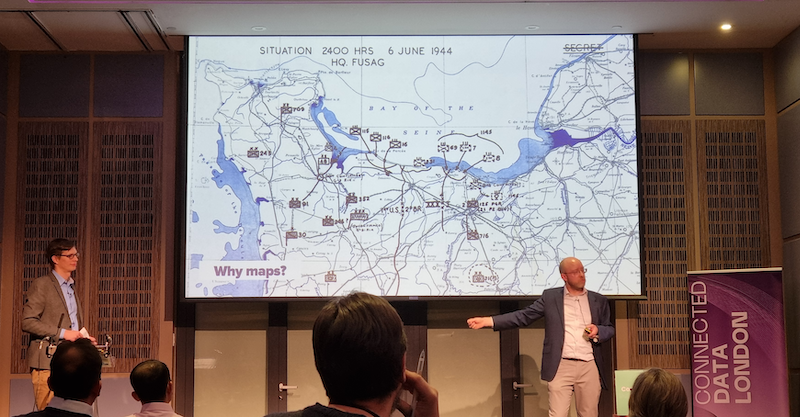
And lastly, Steve Whitla and Gergely Raccuja’s talk on ‘How National Highways is using knowledge graphs to achieve shared meaning’ was fantastic for not only getting to visualise a real-life, everyday use of knowledge graphs, but also in understanding how to bridge the gaps when it comes to communicating between technical and non-technical workers.
The GraphGeeks Afterparty
At 5:30 p.m., Connected Data London was wrapping up, but my day was only halfway over. After a quick glass of wine and some last-minute hellos and goodbyes, I grabbed my coat and headed off to the GraphGeeks mixer.


Many thanks to Amy Hodler and the rest of the GraphGeeks team for hosting such a fun and vibrant afterparty (of note, G.V() co-sponsored the event). I even had a non-attendee wander up and tell me how positive and electric the room felt from the outside, so high praise to everyone there!
Final Reflections
One side-effect of my job being mainly programming is that I don’t always get the wider context on certain subjects, so attending Connected Data London was a great opportunity to widen my knowledge on topics such as the thought process behind creating and populating graphs, along with schema and ontology design choices, as well as what they’re used for and how. (If you’re keen for more Connected Data London content, check out their YouTube channel.)
It was also really interesting to see and hear things from a business perspective as well as from the engineering side – knowledge that will almost certainly help my understanding towards the potential implementations of the upcoming enterprise version of G.V(). More on that to come soon!
If you’re building with graphs – or just graph curious – I encourage you to check out G.V(). It’s like a cup of coffee for your graph tasks: you’ll get more done and enjoy the experience.


