The Weekly Edge: Linkurious Gets Acquired, CDL Wraps, Graph Benchmarks for TinkerPop & More [5 December 2025]
![The Weekly Edge: Linkurious Gets Acquired, CDL Wraps, Graph Benchmarks for TinkerPop & More [5 December 2025]](https://gdotv.com/wp-content/uploads/2025/12/linkurious-acquisition-connected-data-london-tinkerpop-benchmark-weekly-edge-5-december-2025.png "The Weekly Edge: Linkurious Gets Acquired, CDL Wraps, Graph Benchmarks for TinkerPop & More [5 December 2025]")
Roll up! Roll up! It’s time for the greatest show on planet earth: the Weekly Edge!
That’s right folks, step right up for your chance to witness the amazing spectacle of all the world’s graph tech news, reads, and repos performing every Friday in this six-ring circus conducted by the daring team at G.V()! 🦁🤹🏽🎪
Here’s a glimpse into the big top of what you’ll see in this week’s lineup of the marvelous, the strange, and the fantastic from the around the world of graph technology:
- Flying trapeze jump: Linkurious gets scooped up by Nuix
- Trampoline boost: G.V() soars high on a pre-seed investment round
- Freestyle acrobatics: All the summaries, slides, and announcements from Connected Data London
- Juggling to amaze and astonish: Neptune experts demo graph data modeling via natural language
- Taming gremlins: 2 new graph benchmarks for Apache TinkerPop™ databases
- Hula hoops of fire: A new way to explore the flow of money via graph visualization
Now, step into the big top and prepare to be amazed!
[Hot:] Linkurious Gets Acquired by Nuix for $23M
In case you’ve been living under a rock inside a cave under the sea (or else you’re not perpetually on LinkedIn like me), then you might’ve missed the big news: Nuix has signed an agreement to acquire Linkurious.
Technically, the acquisition is expected to close in early 2026, but it’s easy to see why the deal is a natural fit for both firms: Nuix is an investigative analytics software company and Linkurious excels at graph visualization and decision intelligence. More financial info about the acquisition can be found in the long-form press release.
Congrats to Linkurious co-founders Sébastien Heymann, David Rapin, and Jean Villedieu and the rest of the team!
[News:] G.V() Grabs a £500,000 Pre-Seed Investment Round from Techstart Ventures
We don’t normally toot our own horn around here too much, but on Monday the G.V() team received a £500,000 (US$660,000) pre-seed investment round from VC firm Techstart Ventures.
It’s been a long road to arrive at this moment, and G.V() Supreme Leader Arthur Bigeard wrote up a summary about all the twists and turns of the story so far – as well as a credits reel for all the people who helped get us here today. Most notably of course is Mark Hogarth, Partner at Techstart Ventures, for putting his faith in the G.V() team, and the vision we have for the future of graph tech tooling. Thank you to all our users, customers, partners, and community members who helped G.V() achieve this first milestone of many!
(If you’re so inclined, check out the official press release and the G.V() media kit.)
[IRL:] Your Post-Connected Data London Recap
Connected Data London wrapped up two weeks ago and now all the hot takes, recaps, announcements, and slides are in. Here’s your one-stop shop for some of the best post-conference follow-ups we could find:
- Veronika Heimsbakk, author of SHACL for the Practitioner, wrote a tip-top blog post summarizing many of the expert talks and connections made.
- Ora Lassila – the Albus Dumbledore of RDF – shared the slides from his talk: Crafting RDF: Generating Knowledge Graphs from Legacy Data.
- Jessica Talisman, Indy Ontology Expert and Librarian of All Knowledge, summarized her presentation: Knowledge Infrastructures and The Ontology Pipeline for AI Systems.
- The Knowledge Graph Guy, Tony Seale, announced the launch of the Knowledge Graph Academy alongside Jessica Talisman and Katariina Kari.
- Juan Sequeda jumped in with his post-conference hot takes and analysis (and lots of great pictures).
- Knowledge Graph Scientist Giuseppe Futia published the slides from his talk GraphRAG for Exploring Heterogeneous Medical Knowledge.
- And our very own Joe Stainke wrote about his first-ever experience attending Connected Data London and his lessons learned.
Even if you didn’t get to attend the graph event of the season, I hope the links above help you feel like you sorta did. See you there next year!
[Watch:] Revolutionizing Graph Data Modeling with GenAI & Natural Language
In this episode of the “Let’s talk about Data” show, host Ibrahim Emara from AWS is joined by Brian O’Keefe and Kevin Phillips, both from Amazon Neptune, as they demo the Neptune Graph Modeling Assistant. The new tool turns graph data modeling into a natural-language conversation, making graph database design easier than ever for newbies and novices. (And yep, you guessed it: it’s powered by Gen AI and good-’ole natural language processing.)
But the show isn’t just a 57-minute sales pitch: The three of them also answer spicy questions from the audience and even accidentally slip into the RDF vs. LPG debate. Well worth a watch if you’d like to learn more about graph data modeling or if you’re just Neptune curious.
[Repos:] 2 New Benchmarks for TinkerPop Graph Databases
Graph databases that use Apache TinkerPop™ typically don’t get as much love when it comes to benchmarks – especially from the Graph Data Council (or, the Council Formerly Known as the LDBC) – but in the past month, the TinkerPop community has gotten two different benchmarks. It’s sort of like Gremlin Christmas.
First up is a benchmark from the YouTrackDB team at JetBrains. They produced a Gremlin-based implementation of the LDBC Social Network Benchmark (SNB) Interactive v1 workload for TinkerPop-compatible graph databases. (Read more about the SNB Interactive Workload from the GDC.) This project allows running the SNB benchmark for TinkerPop systems with a lot less effort than it might normally take – although users might still need some powerful hardware to make it happen. This new benchmark is also a strong signal of JetBrains’ involvement in the TinkerPop ecosystem.
The second benchmark got its v2.0 release earlier this quarter. TinkerBench is a benchmarking tool designed for graph databases based on Apache TinkerPop. It provides an efficient way to measure Gremlin query language performance in an easy and flexible manner. TinkerBench is created and maintained by Aerospike, a G.V() database partner.
[Fun:] Explore the Paths of Capital with MoneyTrail
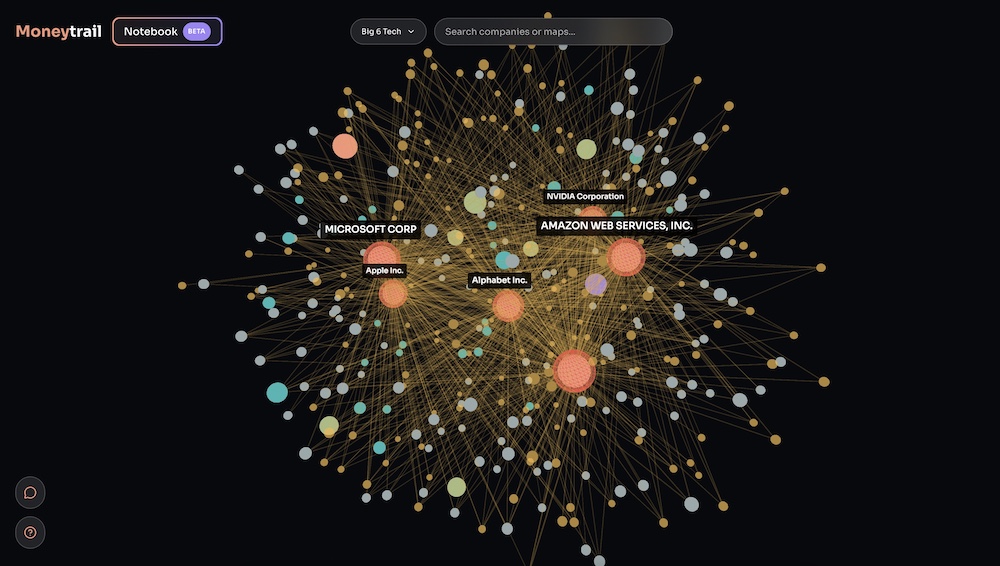
While I’m not a personal fan of 3D graph visualization – they look pretty but make it hard to get real work done, ya know? – this one is worth checking out.
MoneyTrail illustrates complex financial relationships in a clear, interactive visualization, showing you how money moves through the global economy by mapping connections between companies, governments, and institutions.
This three-dimensional graph tool helps you intuitively understand the connections between ownership structures, contract relationships, supply chains, and more. So as a Friday treat, explore the paths of networked capital and discover interesting connections – and then try not to think too much about it all over the weekend.
Got something you want to nominate for inclusion in a future edition of the Weekly Edge? Ping us on on X | Bluesky | LinkedIn or email weeklyedge@gdotv.com.


