The Weekly Edge: SanjMo on Context Graphs, Zero-ETL Graph Analytics & More

Dispel your post-holiday January blues: the Weekly Edge (and also February) have arrived. 💕
This weekly roundup of graph tech news is brought to you by the team at gdotv and delivers everything you need to read, watch, fork, or listen to from the past seven days (or so) from the world of connected data.
Here’s your tl;dr of what’s been happening in graph tech this past week:
- Apache AGE is evolving 🫨: Everything new in the 1.7.0 release of the graphs-on-Postgres extension
- Spanner in the works 🛠️: 2025 was a big year for Google Cloud Spanner Graph
- Async from Texas 🤠: Sanjeev Mohan shares on AI-driven data foundations
- Puppies in the lakehouse 🐶: A new approach to zero-ETL graph analytics from the ClickHouse team
With spring still (too) far away, it’s a good time to put our heads down and gain some more experience points with graphs. Let’s go!
/*
 * It’s time to level up your graph game:
 * Query, explore, edit, and visualize your connected data with the gdotv graph IDE
 * Try out the free dev tier or upgrade to a 1-month, no-fuss free trial.
 */
Now, where were we?
[Release:] What’s New in Apache AGE 1.7.0 on Postgres
This week’s release features the latest darling of the graph tech world: Apache AGE 1.7.0 is here with support for PG18. For those who don’t know, Apache AGE is a Postgres extension that allows you to use PostgreSQL as a graph database without moving any data.
AGE contributor Krishnakumar Ravi shared the release announcement on LinkedIn thanking the entire Apache AGE open source team for their hard work and giving special recognition to John Gemignani, Ashutosh Bapat, and Serdar Mumcu for their contributions.
For all the details, check out the Apache AGE 1.7.0 release notes.
Fun fact the first: You can use gdotv with Apache AGE to explore and analyze your Postgres data as a graph.
[Reflection:] A 2025 Year-in-Review of Google Cloud Spanner (Graph)
Google’s Spanner database turned 13 last year. Far from acting like an insubordinate and churlish teenager, the cloud database is remarkably mature, entrusted with a few boutique applications like Gmail, YouTube, and Google Photos (they’re small, you probably haven’t heard of them).
In this week’s first read, Shubhankar Chatterjee and Piyush Mathur on the Google Cloud team share some year-in-review reflections on how Spanner has evolved over the past decade and over the past year in particular, including some impressive customer stats and name drops.
Of keen interest to Weekly Edge readers, Chatterjee and Mathur review Spanner’s graph enhancements in 2025. Over the past year, Spanner Graph added support for schema-less data that enables iterative development and frequent updates without requiring schema changes. You can also now build graphs on named schema objects and on SQL views, organizing and encapsulating important aspects of your app.
Here’s to more graph tech innovations coming from the Google Cloud team in 2026!
Fun fact the second: You can also use gdotv and Google Spanner Graph to query, test, explore, and visualize your connected data.
/*
*/
[Watch:] SanjMo on Context Graphs, MCP, Skills, Agents, Governance & More
At Data Day Texas two weeks ago, Sanjeev Mohan (a.k.a. SanjMo, which I can only assume is where ScarJo got her inspo) presented his talk on “Building Enduring AI-Driven Data Foundations” covering a number of trends and topics up and down the data and AI stack. But the talk wasn’t recorded! 😱 (Calm down, it wasn’t supposed to be.)
Fortunately, SanjMo recorded and published his preso on his own It Depends podcast, complete with a link to the slides and everything. Here’s a quick rundown of what he covers:
- Context infrastructure is the new differentiator: Context graphs, knowledge graphs, and GraphRAG are becoming essential retrieval patterns alongside vector search.
- MCP and Skills redefine how agents access data: Together, they’re replacing bespoke agent-to-tool wiring.
- ETL is out; ECL (Extract, Context, Link) is in: Combined with zero-copy sharing and federation, the goal is less data movement, not more.
- Governance shifts from inputs to outcomes: The shift is toward continuous monitoring, guardrails, and outcome-based evaluation.
- Everything that rises must converge: Roles, tools, pipelines, operations – all the silos are collapsing.
And then right at the end, he drops this banger: “In the midst of all the talk about AI taking away jobs, there has never been a better time to build something disruptive.” Hell yeah! 💪🏽 ⚡
(Want more reflections and takeaways from the Final Edition of Data Day Texas? The gdotv team has got one coming for you next week!)
[Long Read:] Zero-Copy Graph Analytics: Getting Started with the Lakehouse Graph Approach
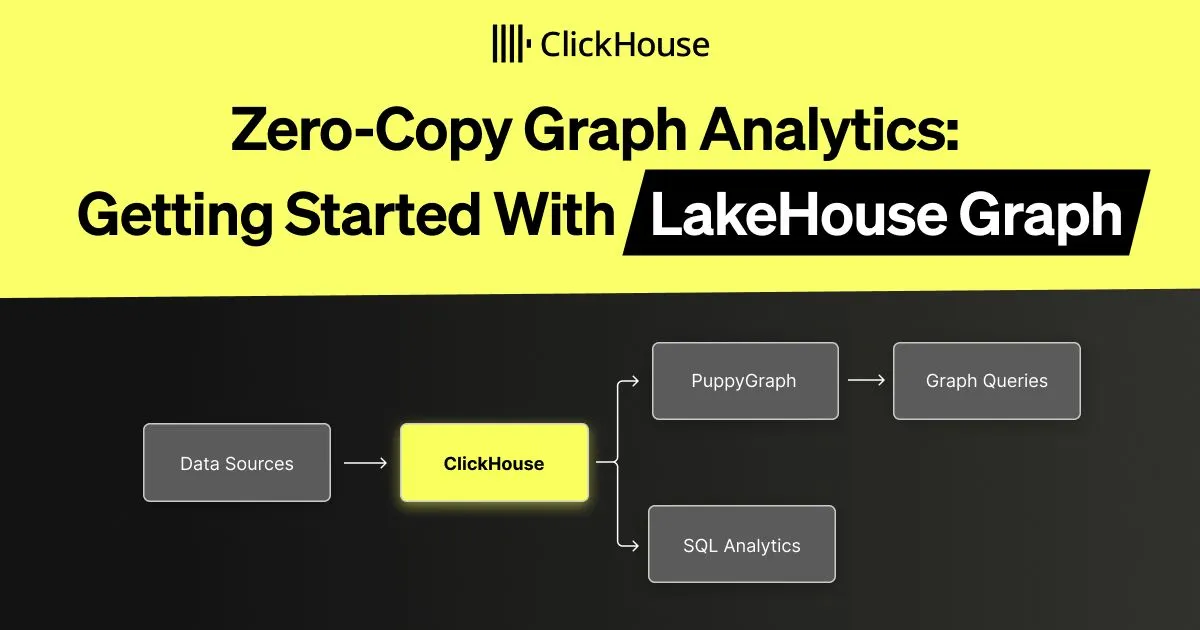
This week’s long read from Maruthi Lokanathan on the ClickHouse team opens with such a slapping intro that I finally gave up trying to summarize it myself and settled for the slightest of paraphrases:
If you’ve ever tried answering connected data questions with SQL, you know what happens. You write a recursive CTE: It times out at 3 hops. You try self-joins: The query plan explodes. So you think to yourself, maybe I need a graph database.
And that’s where things get complicated.
While there are plenty of solid graph database use cases out there, not every team needs one, nor does every task call for it. That’s where the Lakehouse Graph approach comes in. Using PuppyGraph, you get graph analytics without moving your data. Zero ETL, zero copying, zero syncing.
If you were looking for a rock-solid rationale for using a graph query engine, this is it.
Fun fact the third(?!): You can even use gdotv with PuppyGraph to put graph goggles on your relational data.
P.S. Check out our most recent dev preview of building dashboards in gdotv! Write queries like you do today, then pick the chart that fits the data. 📈
P.P.S. Got an item to nominate for the next edition of the Weekly Edge? Hit us up at weeklyedge@gdotv.com.


