The Weekly Edge: Apple Buys Kuzu, Graphs in Your S3 Data, Neo4j vs. Postgres, & More

Brace yourself: It’s Friday the 13th.
Tomorrow is Valentine’s Day, Sunday is Maha Shivaratri, and for those of you in the U.S., Monday is Presidents’ Day (so lots of cars go on sale for some reason?). And next week is a whole host of feasts and fasts, with Mardi Gras, Chinese New Year, Tết, Seollal, and Tsagaan Sar, and the beginning of both Lent and Ramadan. At this point, it’s probably best to watch out for new moon werewolves too. 🐺
Until then, you always have the Weekly Edge to keep you company. This graph tech tl;dr is curated by the gdotv team and rounds up everything happening in the world of connected data from the past week(ish).
Here’s a glance at this week’s headlines:
- Mystery shopper revealed: Apple Inc. acqui-hired Kuzu back in October 2025
- There’s a new (AWS) sheriff in town: Busting fraud rings with Neptune Analytics and more
- Graph analytics on your S3 data: Why, what, and how
- Geospatial analysis showdown: This Neo4j vs. Postgres matchup has a surprising winner
- Not your average Game of Life: Play graph evolution with some of the most stunning visualizations you’ve ever seen
// It’s time to level up your graph game: Query, explore, edit, and visualize your connected data with the gdotv graph IDE. Try out the free dev tier or upgrade to a 1-month, no-fuss free trial.
Now for this week’s graph tech happenings:
[News:] Kuzu Got Acquired by Apple Inc.
tl;dr: It was Apple who bought and acqui-hired Kuzu back on 10 October 2025.
The deets: Big news broke this week on Wednesday, 10 February, when the European Commission Directorate-General for Competition published a public regulatory filing that Apple Inc. (designated as a digital markets gatekeeper in the EU) purchased Kuzu Inc. back on 10 October 2025. The filings are typically published 4 months (or later) after such acquisitions take place, which is why we’re all only finding out about it now.
Within hours of the public acquisition listing, both AppleInsider and Patently Apple had covered the news above but with way more speculation (your correspondent restrains himself). Arun Sharma, the Founder of Kuzu-fork LadybugDB, also shared his hot take about the acquisition on LinkedIn.
What Apple plans to do with Kuzu’s embedded graph database technology, we may never know, but even four months later, we still mourn its loss. The upshot? We now have two great forks of Kuzu: LadybugDB and RyuGraph (both of which are compatible with gdotv!), and maybe the term “graph database” will work its way through the Apple Park until graph tech is considered mainstream. One can dream.
[Read:] Build Fraud Detection Systems with AWS Entity Resolution & Amazon Neptune Analytics
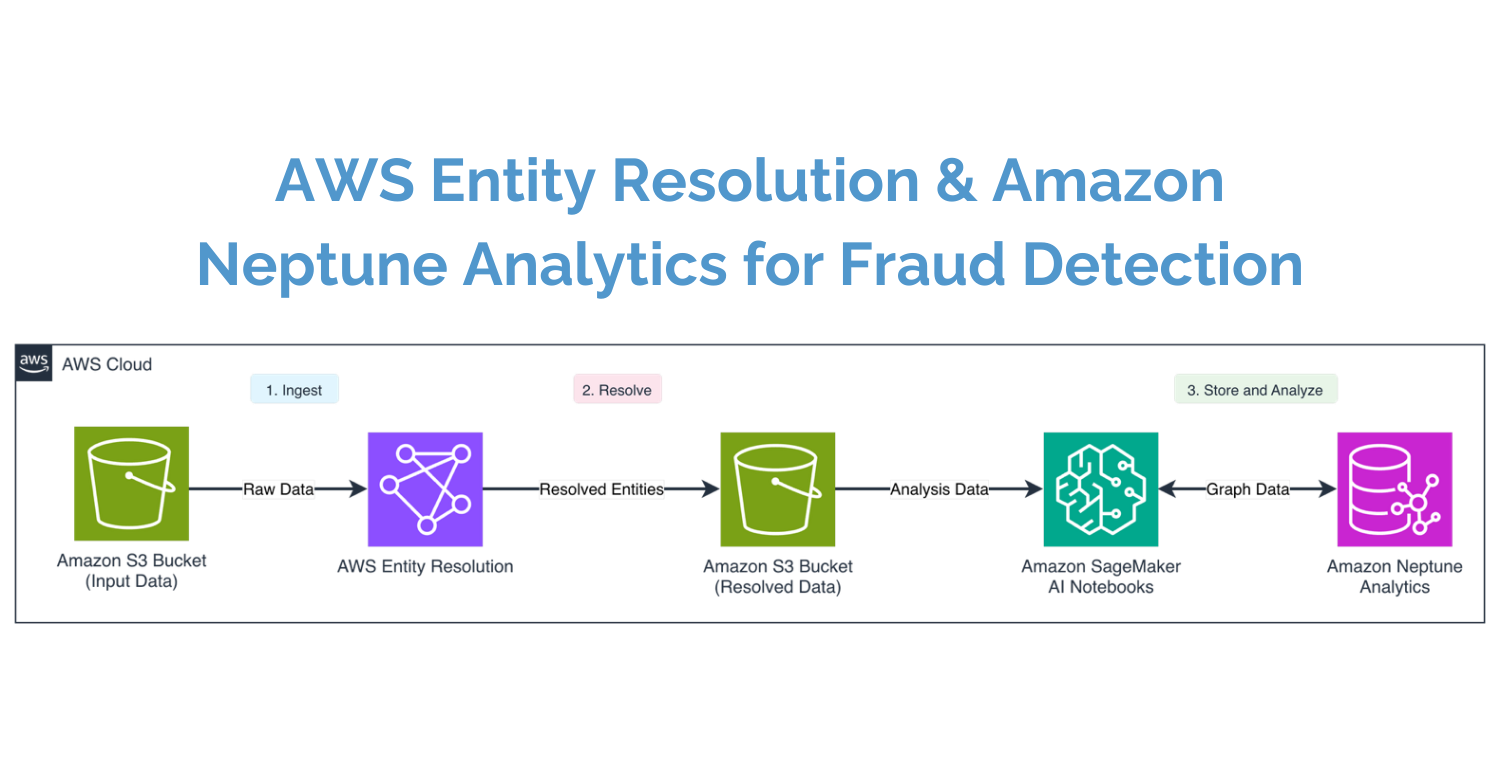
If you didn’t know already, fraud is big business! Of course it’s also bad business, and one of the best ways to find and catch the bad guys doing fraud is to use the full suite of graph technology: databases, algorithms, analytics, and visualization.
In this week’s long read, the Amazon team shows you how to use graph algorithms to analyze the results of AWS Entity Resolution and related transactions for an example fraud use case. The blog authors – Jessica Hung, Isaac Kwasi Owusu, and my former Neo4j colleague Ross Gabay (Hi, Ross!) – use a number of other AWS services, including Amazon Neptune Analytics, Amazon SageMaker notebooks, and Amazon Simple Storage Service (Amazon S3) in their demo. If you’re looking to catch the bad guys or level up your fraud detection game, this article is a great place to start.
Editor’s note: Amazon Neptune and Amazon Neptune Analytics are both supported by gdotv to help you query, explore, and visualize fraud detection data in your Neptune graph database.
//
[Watch:] How to Find Hidden Data Relationships in Your S3 Data
This edition of the Weekly Edge is an AWS double feature: That’s right, this week’s watch is also about Amazon Neptune.
In this episode of “Databases for AI,” host Trev Spires talks with Melissa Kwok from the Neptune team about how to uncover hidden data relationships in your S3 data lake using graph analytics – no ETL required. The duo cover why SQL struggles with connected data, how graph analytics expose new patterns that traditional queries miss, and how relationship-aware data makes your AI systems more context-aware and more explainable.
Follow along with their example queries using this Jupyter notebook as they examine the data in Neptune Analytics.
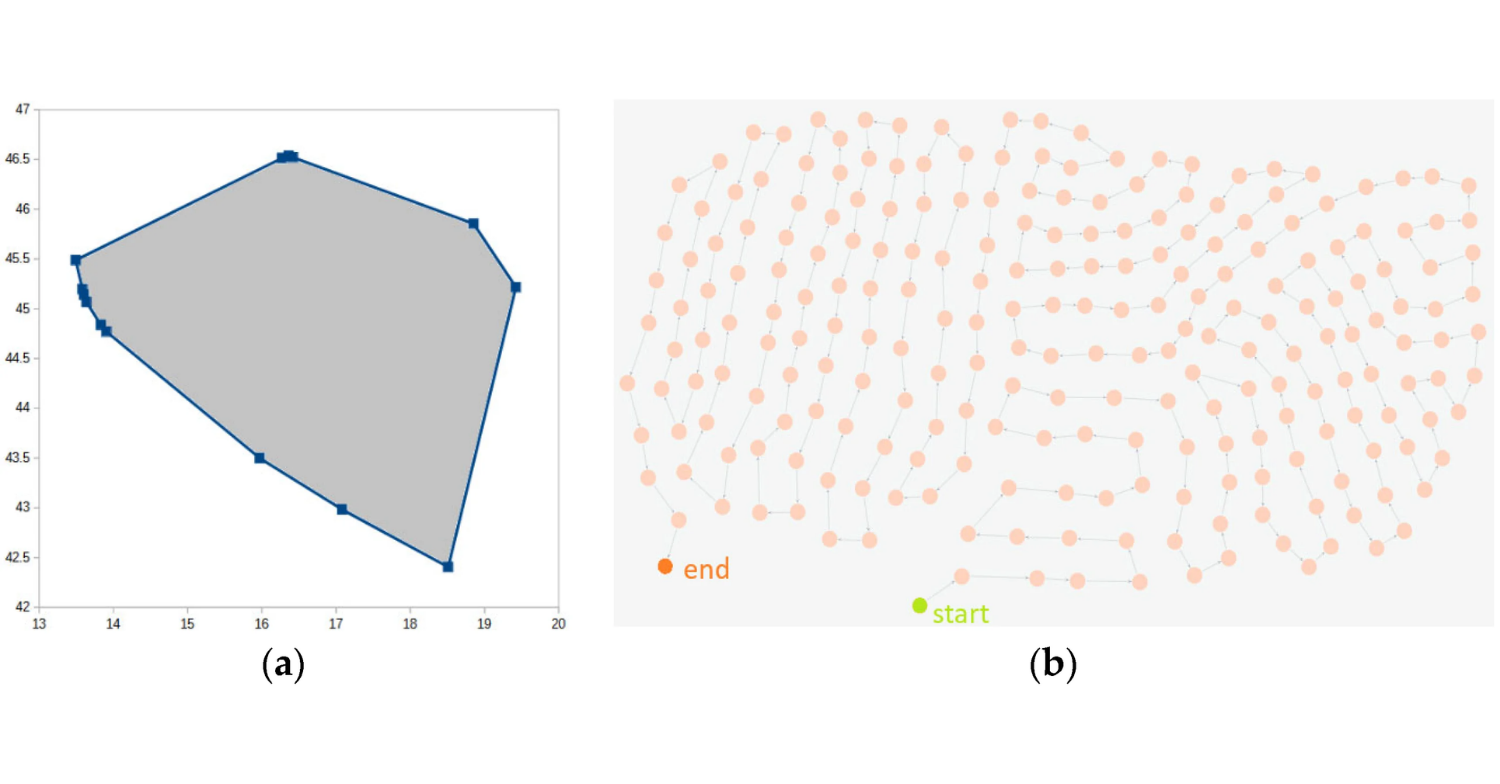
[Paper:] Graph vs. Relational for Geospatial Data Analysis
I don’t often share academic papers in the Weekly Edge, but when I do, it’s because the paper’s a banger.
A team of researchers from Croatia wanted to know which was better for geospatial data analysis: relational databases or graph databases? For their experiment, they chose Neo4j as the sample graph database (typical), and for the relational database, they selected PostgreSQL (of course). So you’re probably thinking it’s a classic RDBMS vs. graph database matchup, right? Nah. Just in time for Valentine’s Day, this paper takes that heated rivalry and turns it into, well, Heated Rivalry.
In this enemies-to-lovers plot for the database ages, the researchers argue for using both relational and graph approaches, taking into account the strengths and advantages of each. They use a city transport network as a concrete example for this proposed hybrid approach which…totally works! This isn’t Neo4j vs. Postgres; it’s Neo4j 💖😘 Postgres.
I’ll leave you alone now with this sizzling line from the abstract: “Although this kind of hybrid architecture has issues with data duplication, the performance gains achieved are significant, making this approach highly efficient.” Wowza. 😍
[For Fun:] Conway’s Game of Life…as a Graph!
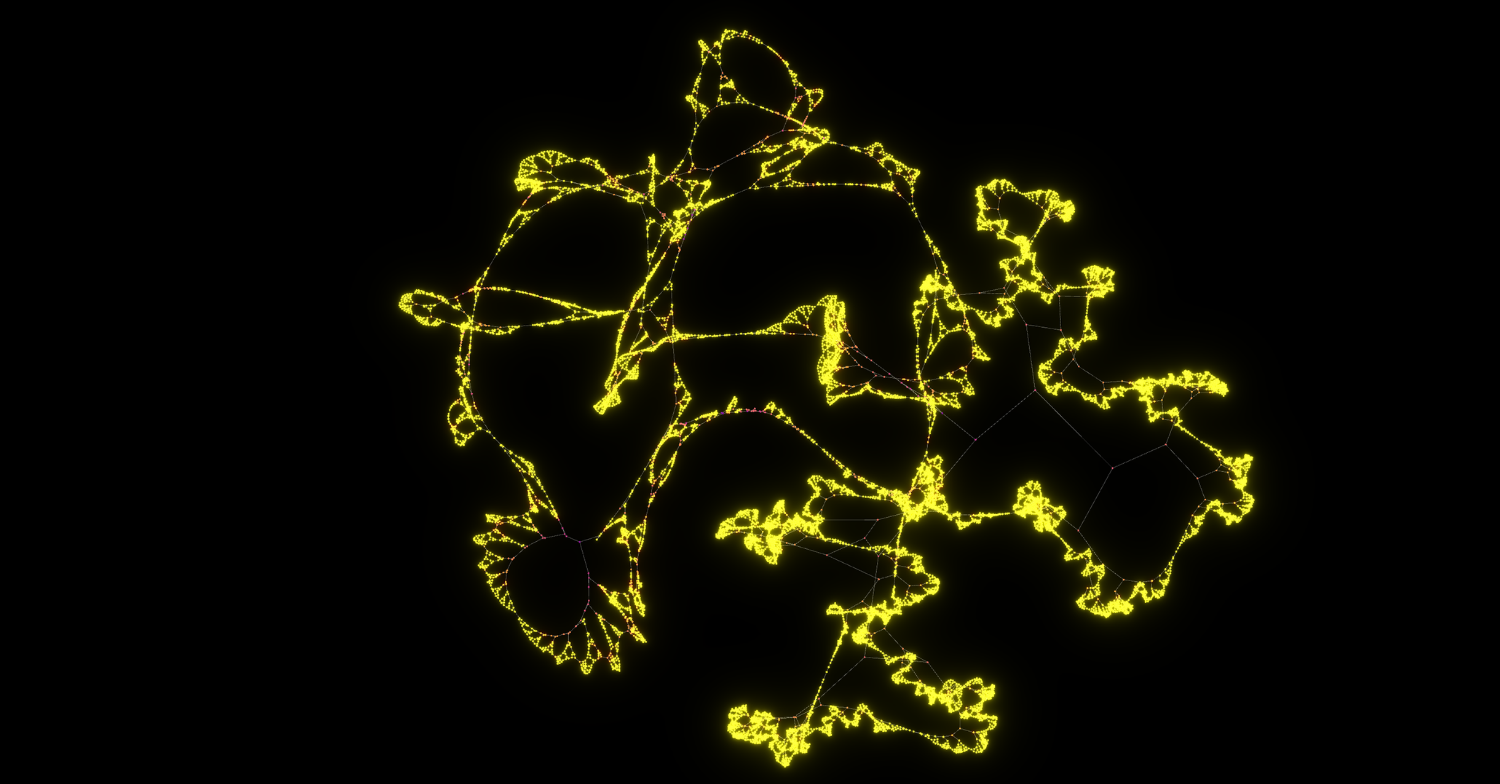
If you’ve ever played Conway’s Game of Life, you’re lying. You might have observed it though. It’s a zero-player game where you create an initial configuration and observe how that starting state evolves across discrete time steps called generations. As a game, it’s a little faster than watching rocks grow, but a little slower than Mario Kart.
Growing Graphs is an incarnation of Conway’s Game of Life that uses awe-inspiring graph visualization. You can play with the initial configurations yourself, watch an autonomous demo, or check out the code on GitHub. (Speaking of awe-inspiring, game creator Alexander Mordvintsev clearly knows how to inspire awe.) Make some popcorn, and enjoy the show! 🍿
P.S. Query guardrails are coming to SPARQL in gdotv later this month. Check out Amir’s walkthrough to help you keep the sparkle in your SPARQL! ✨
P.P.S. Got an item to nominate for the next edition of the Weekly Edge? Hit us up at weeklyedge@gdotv.com.


