Neo4j AuraDB Graph Visualization Tool
Query, visualize and investigate connected data interactively, with G.V()’s user
friendly graph visualization toolkit, purpose-built for Neo4j AuraDB.
Overview of Neo4j AuraDB
AuraDB is a fully managed high-performance, purpose-built native graph database by Neo4j. What makes it different from traditional relational databases is that instead of accessing related data by using JOINs, AuraDB uses native pointers to handle relationships, improving performance.
AuraDB ensures consistency and reliability with ACID transactions, promoting confidence in their customers’ data integrity, even in high-strain environments.
G.V() is a graph database client which can be used with AuraDB to provide you with full graph visualization features. You can write and execute Cypher queries, then view their results in a manner of different output formats.
With its wide range of Integrated Development Environment (IDE) features, there are many uses in which G.V() can streamline your everyday graph data work flow.

Always On, Zero Adminsitration
Designed for AuraDB
G.V() is a graph database client designed to enhance how you manage and interact with your AuraDB database. It’s easy to get up and running, and can instantly take your queries and visualize them as interactive graphs.
Used by a range of industry leaders and professionals, it comes with all the features you need to extract information from your data with ease.
Connect Instantly
With G.V()’s simple “plug and play” solution, you can connect to your AuraDB database in under a minute.
Just follow the on-screen instructions by entering your hostname, and your Neo4j username and password, then you’re good to go.
Our one click installer is available for Windows, macOS and Linux, so you’ll be ready to get started in a matter of minutes.
 to Neo4j AuraDB takes less than a minute")
Connecting G.V() to Neo4j AuraDB takes less than a minute
 uses your data schema to provide real-time autocomplete suggestions")
Full Code Completion
G.V() offers a full code completion engine for Cypher queries. Our IDE reads the schema from your graph data in order to offer relevant suggestions and autocompletion, making query editing a breeze.
By giving you real-time reminders of your nodes, edges and properties, you can say goodbye to the days of constantly having to check the structure of your graph.
Our code editor also features syntax and error checking, warning you of any mistakes in your query, along with the ability to format your code to improve readability in a single click.
Interactive Graph Data Exploration
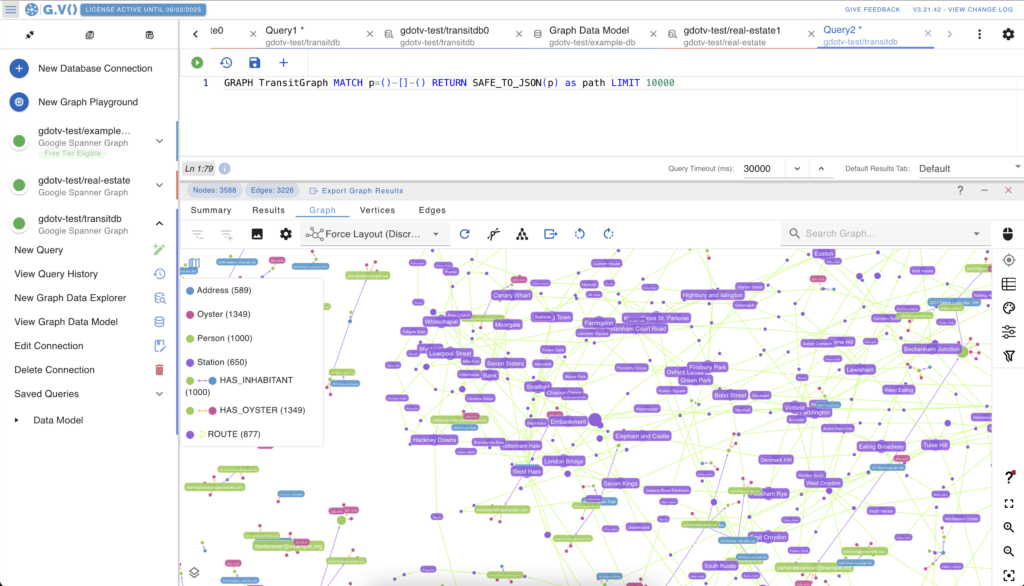
Our no-code graph data explorer means you can explore and interactively edit your AuraDB graph data with ease.
Whether you want to filter or navigate your data, edit the properties of your vertices and edges, or even create new ones, you are able to do so with just a few clicks.

Data loaded from AuraDB using filters and organised into various clusters

View your Graph Data Schema instantly
Graph Data Schema Visualization
G.V() uses the structure of your graph data schema to power its user interface, and provides an easy to understand entity-relationship view of the data model of each graph database you connect to G.V().
This provides collaboration benefits, with the whole team having a consistent view of the schema, as well as a handy reference guide for designing Cypher queries that is always there when you need it.
Manage Connections Centrally
G.V() is built to work with a multitude of database technologies, and can simultaneously connect with all your graph database instances.
All you need to do is follow the step-by-step guide to add each connection, then you’re able to seamlessly switch between querying and analyzing any of the databases you have running.

Work With Multiple Database Instances Alongside Each Other
FAQs
Turn data into insights with G.V().
Download our AuraDB IDE now to support and supplement your graph database project.
Free to start with
One more thing that sets G.V() apart from other industry solutions is the completely free tier for small databases (under 500 edges and 500 nodes). Full functionality is included, so you can work on graph projects while in their early stages with zero commitment to buying or signing up.
Should you wish to continue using G.V() after your project has increased beyond that size, you can access a free 1-month trial split into two 2-week periods. This is perfect for building a proof of concept with stunning graph visualizations to report to stakeholders.
Developed by Graph Database Experts, Tailored to Suit Your Requirements
Built by a small but dedicated team of developers, G.V() is here to assist you with your graph project. We invite you to get in touch if you have any questions, feedback, or useful suggestions. Keep up to date with all the news about G.V() and related products by following us on LinkedIn.
Revolutionize the way you interact with graph data using our AuraDB client. Sign up for a 1-month free trial today.