The Weekly Edge: Misinformation & Knowledge Graphs, Stripe’s Graph-Based Recovery, Zero-ETL, & More
Happy Thursday!
Disaster! This edition of the Weekly Edge is about when things go wrong. Misinformation propagates, systems break, and all meaning is lost. How do we recover? Follow along as we explore some of this week’s most newsworthy items, from dead celebrities to biomedical science.
Headlines this week:
- Who died? Erroneous reports of Jim Carrey’s death in Google’s knowledge systems spark a reflection on the propagation of misinformation.
- I’ll be back on my feet in no time! Graph-based remediation systems at Stripe dramatically improve system recovery.
- Gotta get that protein: Learn how scientists track the effects of pharmaceuticals with an introduction to knowledge graphs in biomedical research.
- But what does it mean? The Semantic Units Framework by Lars Vogt is a deep-dive into how we might capture the semantic meaning of natural language in knowledge graphs.
- Extract! Transform! Load! (Or not…) – Follow along with Sa Wang at PuppyGraph for an introduction to Zero-ETL pipelines.
If you’re new here, the Weekly Edge is your weekly tl;dr of graph technology news curated by the team at gdotv, giving you all the reads, repos, vids, and walkthroughs worth exploring from the past seven-ish days (or so).
/*
 * It’s time to level up your graph game:
 * Query, explore, edit, and visualize your connected data with the gdotv graph IDE
 * Try out the free dev tier or upgrade to a 1-month, no-fuss free trial.
 */
/*
*/
[Blog]: The Reports of Jim Carrey’s Death Are a Failure Mode
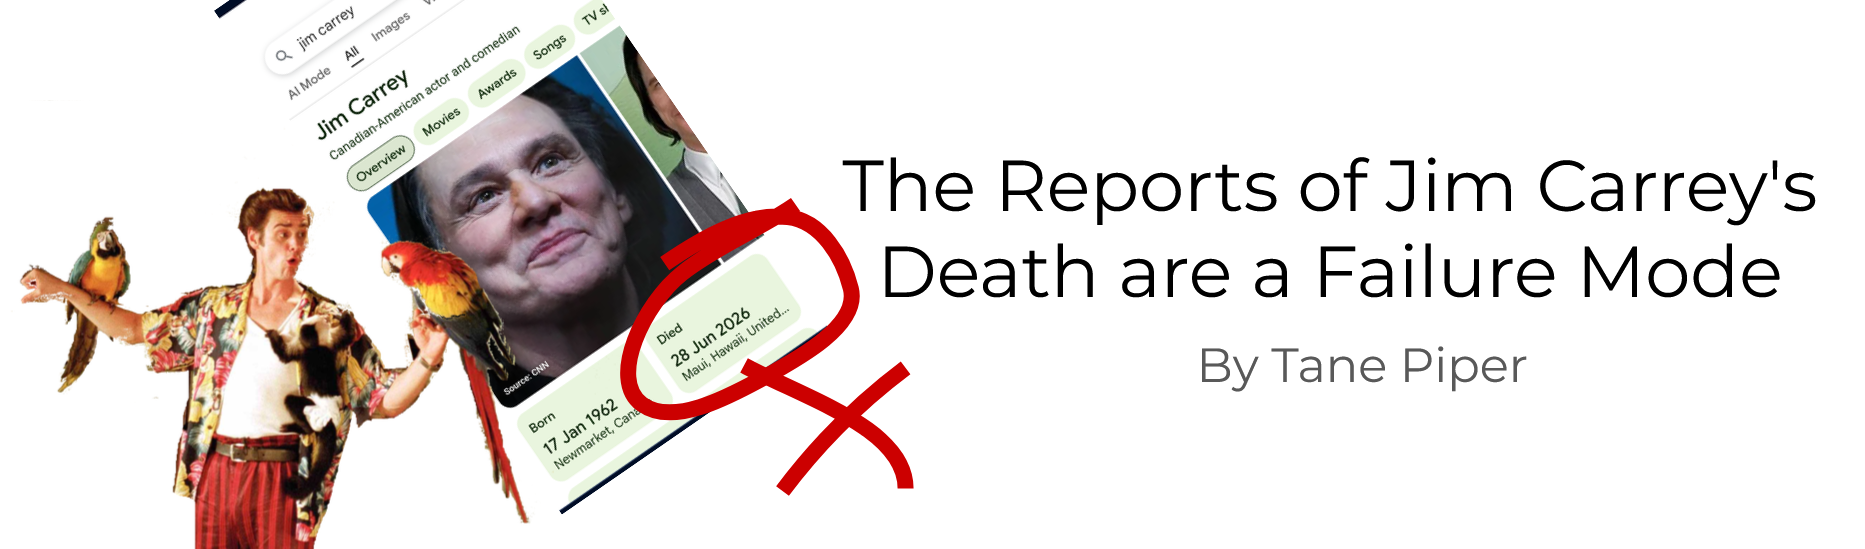
A recent blog post by Tane Piper, part of a broader conversation on the information veracity crisis that has become increasingly pressing in the wake of LLMs.
The framing device is one simple piece of misinformation. On the 29th of June, Google’s Knowledge Panel seemingly indicated Jim Carrey had died the day before. That a knowledge system should have an error is not, in itself, surprising. But, as Piper points out, the more concerning element is the proliferation of opaque information systems that don’t allow users of those systems (or perhaps even the inventors themselves) to trace errors to their source.
Piper points out that since the creation of mass media, accurate information dissemination is a kind of infrastructure challenge. Widely distributed claims can easily become widely believed truths, regardless of their original validity. This issue is not entirely new, traditional print journalism has wrangled with it for a long time. Classically, the response has been to introduce friction into the system, editors, reviews, corrections, and laws around publication. Piper points out that, while these procedures don’t prevent misinformation, they do create a level of robustness and accountability that every new claim must pass through.
But in the internet era, where online corporations are largely unregulated and anyone can publish on social media, there’s little friction to reign in the now unprecedented volume of content produced by LLMs. How do we navigate this new space? Piper has some ideas, referring to the video assistant referee used in football and stressing the importance of provenance. As he says, misreporting the death of a celebrity is harmless, but it “becomes far more serious when it touches emergency information, medical guidance, public safety, legal rights, product safety, financial markets or democratic institutions.“
[Blog]: I’m Getting Better! Automatic System Recovery with Stripe Dot Dev
If you like stories of new graph adoption, this is one for you.
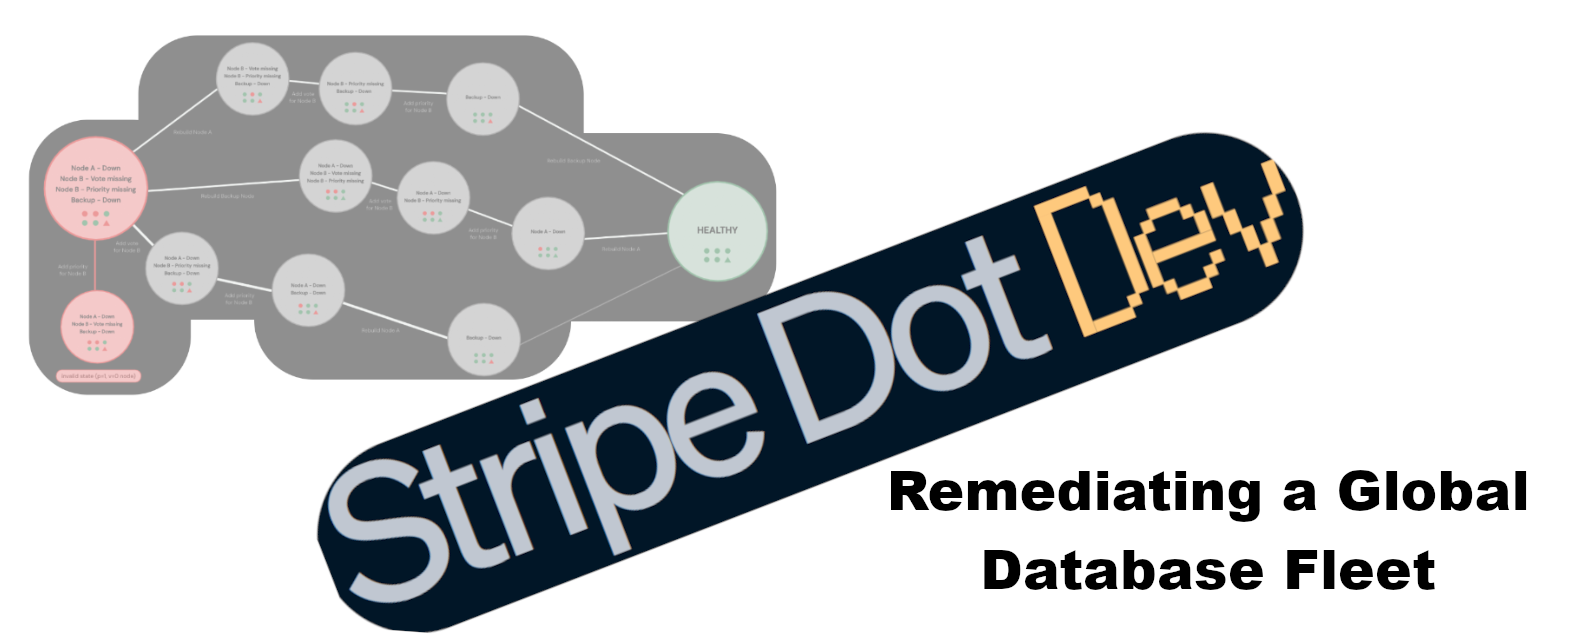
We’ll be covering How Stripe uses graph search and state machines to auto-remediate a global database fleet. This is a blog post by Stripe Dot Dev, the developer branch of payment company Stripe.
Written by Pragya Mehta and Sai Samant, the blog post discusses how Stripe recovers from cluster state degradation, i.e. mis-shapen or mis-configured entities managing the system. In particular, the post focuses on the weaknesses of their original brittle, hard-coded recovery system. In this older system, potential issues were treated as a finite list of discrete possibilities. Remediation is performed by individual plugins designed to treat one problem at a time. Because of this, the recovery procedure for engineers is to systematically queue, trigger and monitor a sequence of operations. The order of these operations was determined according to hard-coded procedures, or their own judgement.
While one might suppose that such a procedure could be automated without additional infrastructure, they state that the inherent complexity of their system allows for “combinatorial explosion of failure modes. i.e. there are too many different possible scenarios where things “go wrong” for all possible recovery procedures to be hard-coded in advance. This does not mean that the order cannot be predicted, however. As many of our readers may have already suspected, the procedure amounts to a branching pathways of conditional statements that can be well approximated by a graph.
They use a simulation of the environment, and implement a breadth-first search and Dijkstra’s algorithm into a graph-based system that dynamically enacts recovery plans. This dynamically predicts the order of operations for recovery. The blog post details their solution and results, citing a 30% reduction in digital alerts regarding failures after the implementation of the new system. They present this as evidence that the new system works not only to solve the most immediate problems, but to build a healthier ecosystem overall.
[Quick Read]: Diagnosing the Problem: Knowledge Graphs in Drug Discovery
Ever wondered how the biomedical industry uses knowledge graphs? Here’s a general introductory guide from Drug Discovery News.
Did you know that the vast majority of modern pharmaceuticals conceptually do the exact same thing? Nearly all prescribed drugs are just chemicals designed to modulate the behavior of proteins. In many ways, “thing that modulates a protein” is a good approximate definition of the word “drug”.
If that makes biomedical research sound simple however, you’re out of luck. The problem is the sheer size of the parameter space. There are estimated ~20,000 protein-coding genes in the human body, and an even higher number of possible diseases, drugs, phenotypes and pathways. Keeping on top of all the different possible combinations and relationships between them by hand would be impossible, but is fortunately the kind of thing that a graph database can do very well.
As this introduction mentions, though, reality is even more complicated than that. Even “the graph is a simplification of biology.” Just because we give an entry and a name (perhaps even a chemical formula) to a protein, drug or disease, that doesn’t mean that its properties and behaviours can be fully predicted from base principles or existing data. Biomedical research has many strongly supported relationships, but also relationships that are merely suggested, inferred, or perhaps even pure hypothesis. This incompleteness or uncertainty in knowledge also has to be captured.
This article refers to major biomedical knowledge graphs: PrimeKG, Open Targets, Hetionet, STRING, and mentions how neural networks can be used look for patterns in the complicated space of biomedical processes.
[Long Read]: Say What? Quantifying Meaning with the Semantic Units Framework
This one is actually a follow up to the previous Rosetta Statements paper that we covered in a previous Weekly Edge!
The Semantic Units Framework by Lars Vogt is a spiritual follow-up to Rosetta Statements, and a far more detailed exploration of the wider idea. To recap, Rosetta Statements were more of a tool for converting simple English language statements (“n-ary” statements, you might recall) into RDF triples. The idea was to encode some basic rules of English syntax into RDF to make knowledge graph construction easier.
The broader Semantic Units Framework, however, is broader in scope, and more abstract. Vogt refers to it as ‘conceptual in nature’ and more of a philosophical approach to knowledge graph creation, rather than a proposal for any specific technology or standard. It can be applied to RDF (and indeed they use an RDF framing within the paper) but it is not specific to RDF. In fact, a lack of universal meaning to the term ‘graph technology’ is cited as one of the many motivations for the paper.
Rather, the paper talks more generally about how natural language can be used to construct FAIR knowledge graphs, and various challenges that may be encountered. There is a particular emphasis on how to expand the notion of knowledge and information beyond that of ‘individual facts’, which is how a single graph entity (or RDF triple) is often constructed. How do we handle statements that may be only mostly or partially true? How do we handle abstract, existential claims, or context?
Vogt proposes a two fold approach: (1) the quantification of ‘semantic units’ as first-class objects, and (2) the introduction of a set of logical resource categories to model difference types of claim. The discussion is lengthy, with an extensive list of examples. It will be interesting to if his suggestions are widely adopted as an increasing number of systems struggle to keep up with the volume of natural language data now available.
[Blog]: Abolish ETL! A PuppyGraph Walkthrough of Zero-ETL Systems

You wanna turn your relational database into a graph database? Simple, build an ETL pipeline.
But what about a no-ETL pipeline? That’s the premise of a recent blog post by Sa Wang at PuppyGraph, talking through the basics of “Zero-ETL.”
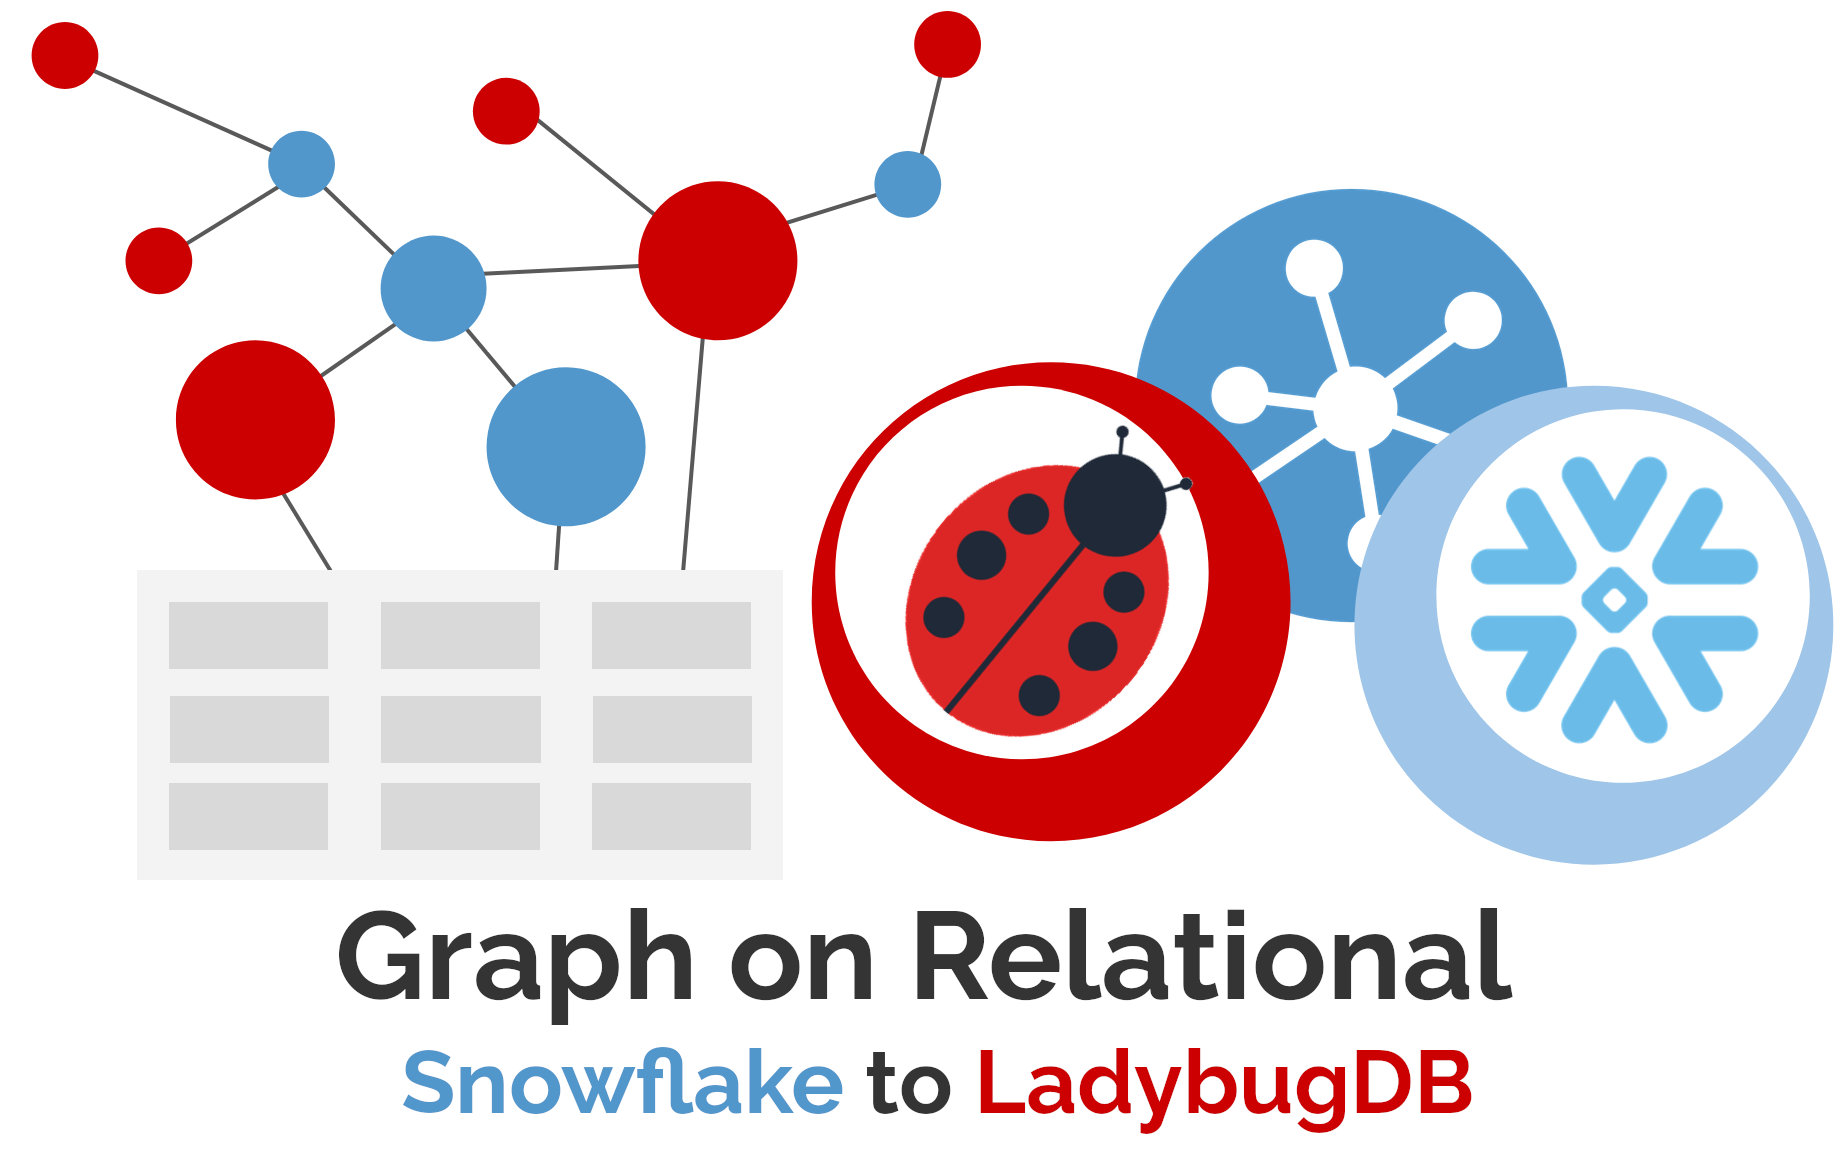
Of course, the name is a little misleading. It’s a marketing term devised by Amazon. Zero-ETL doesn’t literally mean no ETL, rather it refers to no user-built ETL, with the idea that data is instead maneuvered “under the hood,” so to speak. Most graph-on-relational services are a kind of zero-ETL. Sa identifies two main approaches to zero-ETL, managed replication and direct access. He also points out the various advantages of zero-ETL, which can largely be credited to the simpler, more streamlined workflow that arises from a fully integrated environment. The one major downside of zero-ETL is that it doesn’t afford the same freedom to control the shape of your data as a bespoke ETL pipeline does. Whether the tradeoff is worth it likely depends on the nature of your data, and your project goals.
Either way, Wang’s introduction is a helpful overview for those who want to better understand the distinction.
P.S. Want to get better at solving graph problems in interviews? Check out this advice for Leetcode graphs.
P.P.S. In this week’s Graph Pulse, we checked in with Keith Corbett at Intuitive.ai to discuss knowledge graph integration and the role of learning in the post-LLM world.
P.P.P.S. Got an item to nominate for the next edition of the Weekly Edge? Hit me up at weeklyedge@gdotv.com or hit reply! ✍🏽

![gdotv Adds Multi-Graph Connections & Automatic Data Models [v3.74.142 Release Notes]](https://gdotv.com/wp-content/uploads/2026/08/multi-graph-connections-automatic-data-models-gdotv-v3-74-142-release-notes-banner.webp "gdotv Adds Multi-Graph Connections & Automatic Data Models [v3.74.142 Release Notes]")