gdotv Adds Multi-Graph Connections & Automatic Data Models [v3.74.142 Release Notes]
Discover multi-graph connections in gdotv v3.74.142: move between graphs, datasets and repositories on one connection, with data models that load themselves.

![gdotv Adds Multi-Graph Connections & Automatic Data Models [v3.74.142 Release Notes]](https://gdotv.com/wp-content/uploads/2026/08/multi-graph-connections-automatic-data-models-gdotv-v3-74-142-release-notes-banner-1024x768.webp "gdotv Adds Multi-Graph Connections & Automatic Data Models [v3.74.142 Release Notes]")
Discover multi-graph connections in gdotv v3.74.142: move between graphs, datasets and repositories on one connection, with data models that load themselves.
![Introducing pgGraph Support, Node Icons & Language-Aware Terminology [gdotv v3.63.137 Release Notes]](https://gdotv.com/wp-content/uploads/2026/06/pggraph-lang-tag-grouping-node-icons-gdotv-v3-63-137-release-notes-banner-1024x535.png "Introducing pgGraph Support, Node Icons & Language-Aware Terminology [gdotv v3.63.137 Release Notes]")
Discover gdotv v3.63.137: pgGraph support brings graph queries to PostgreSQL, plus node icons, language-aware vertex & edge terminology, RDF lang-tag grouping.
![Introducing AI Query Generation and Cypher Dialect specific autocomplete [gdotv v3.61.129 Release Notes]](https://gdotv.com/wp-content/uploads/2026/05/gdotv-release-llm-chat-cypher-autocomplete-1024x569.png "Introducing AI Query Generation and Cypher Dialect specific autocomplete [gdotv v3.61.129 Release Notes]")
Explore the latest release of gdotv, featuring a brand new LLM chat interface, dialect aware Cypher autocomplete, and more
![Introducing Support for Apache HugeGraph, GoogleSQL, SHACL Constraints, & More [gdotv v3.59.116 Release Notes]](https://gdotv.com/wp-content/uploads/2026/04/shacl-constraints-ontology-apache-hugegraph-google-sql-gdotv-release-1024x535.jpg "Introducing Support for Apache HugeGraph, GoogleSQL, SHACL Constraints, & More [gdotv v3.59.116 Release Notes]")
Discover what’s new in this release of gdotv with support for Apache HugeGraph, GoogleSQL autocomplete, SHACL ontology constraints, graph viz updates & more!
![Announcing SPARQL Query Guardrails, Dashboarding, Query Editor Upgrades, & More [v3.53.111 Release Notes]](https://gdotv.com/wp-content/uploads/2026/03/rdf-sparql-query-guardrails-interactive-graph-dashboarding-gdotv-release-1024x535.jpg "Announcing SPARQL Query Guardrails, Dashboarding, Query Editor Upgrades, & More [v3.53.111 Release Notes]")
Discover what’s new in the latest release of gdotv with SPARQL query guardrails, dashboards for visual graph analytics, query editor upgrades and much more!
![Announcing Ontology Support, Improved Data Model Visualization, Entra ID auth Support & More [v3.51.108 Release Notes]](https://gdotv.com/wp-content/uploads/2026/01/apache-age-entraid-auth-support-ontology-data-model-viz-gdotv-release-1024x535.png "Announcing Ontology Support, Improved Data Model Visualization, Entra ID auth Support & More [v3.51.108 Release Notes]")
Dive into the latest release of G.V() graph database IDE including new features for ontology support, improved data model visualization, EntraID, and more.
![Announcing Apache AGE Support, RDF Expansion, a Brand-New Interface, Updated Labels & More [v3.48.105 Release Notes]](https://gdotv.com/wp-content/uploads/2025/12/apache-age-graph-extension-support-rdf-expansion-gdotv-release-1024x535.png "Announcing Apache AGE Support, RDF Expansion, a Brand-New Interface, Updated Labels & More [v3.48.105 Release Notes]")
Discover what’s new in the latest release of G.V() with support for Apache AGE on Postgres, expanded support for RDF triplestores, a brand-new UI, and more.
![RDF Support Is Now Available in G.V() [v3.41.99 Release Notes]](https://gdotv.com/wp-content/uploads/2025/11/rdf-triplestore-sparql-support-gdotv-graph-database-IDE-1024x535.png "RDF Support Is Now Available in G.V() [v3.41.99 Release Notes]")
Learn more about how the latest release of G.V() now supports RDF triplestores and the SPARQL query language with autocomplete, visualization, and more.
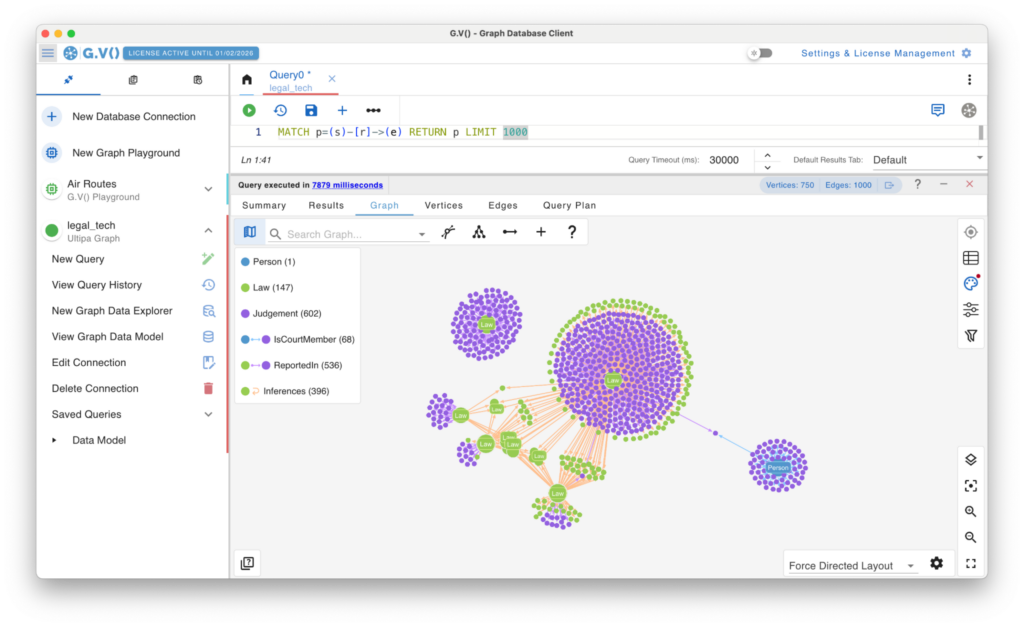
Today marks the release of G.V() 3.40.94. Some significant additions this time around – we now support ISO GQL (Graph Query Language), starting with Ultipa Graph Database!
We’ve also extended our embedded documentation feature, previously only available for the Gremlin query language, to work with Cypher and its many database-specific variants.
And finally, we’ve introduced further user experience improvements, most notably to the settings menu.
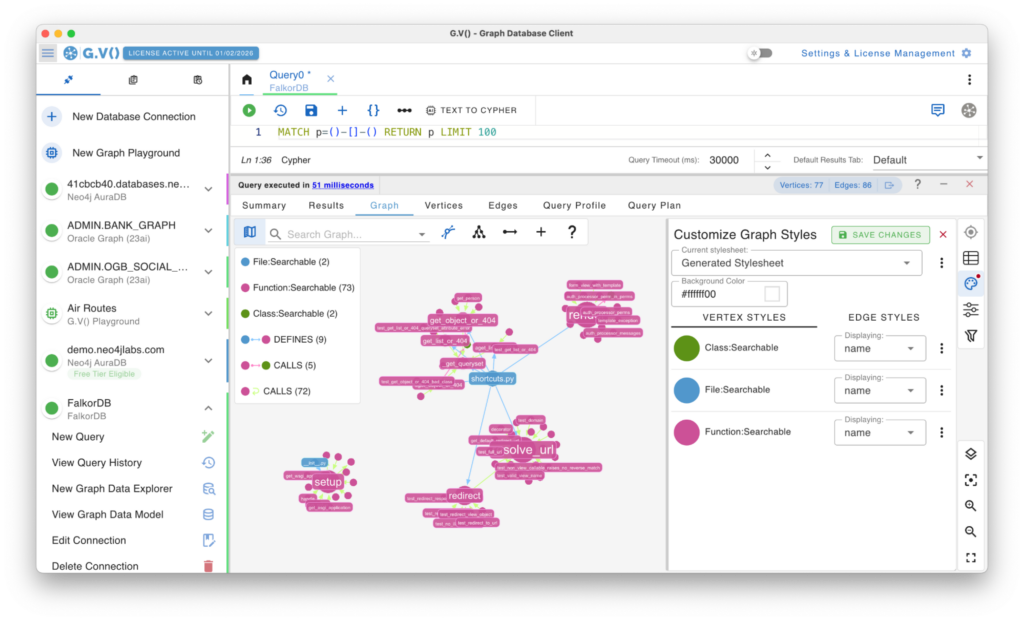
G.V() 3.38.90 is out now! This newest version includes a number of exciting updates – most notably we have added full FalkorDB support. We’ve also added several new quality-of-life features and fixes, including an improved stylesheet interface that makes customizing your graph visualization easier than ever!