gdotv 3.9.32 Release Notes: New Free Tier, Map View, and more!

Introduction
gdotv 3.9.32 shipped with a more accessible free tier and new data visualization features. We had listened to community feedback and implemented a free version of the software for all graph databases, and we introduced new ways to visualize and explore your graph data.
The New Free Tier of gdotv
Updated on 21st September 2026: the free tier described here is no longer offered. See pricing for current terms.
gdotv is often used in new graph projects and proofs of concepts, where scale is not yet fully of concern, but graph database technology adoption is a central challenge for teams. We’ve heard many stories from our customers over the years of how they’ve successfully delivered a graph database project using our software to learn how to query their database, as well as demonstrate the results of their work to stakeholders. We were very proud to hear how gdotv played an important role in graph database adoption, and wanted to do more.
We often discuss ways to improve graph database adoption with our technology partners, and find that learning to shift from constrained, relational data to interconnected graph data is a major change for many. It is certainly one that requires time to learn and practice. gdotv offers many learning and assistance features designed to soften the learning curve of query languages like Gremlin.
But with a time-limited free trial, and the many conflicting priorities of day-to-day development, users could find themselves needing to decide on adoption of tooling like gdotv too early in their proof of concept. To address this, 3.9.32 introduced a no sign-up free tier of gdotv, automatically available for any graph database with fewer than 500 vertices and 500 edges. Alongside the already free in-memory graph feature, it gave early-stage graph database projects a feature-rich tool.
The free tier was applied automatically on connecting to your graph database – if it was eligible, gdotv showed the following message:
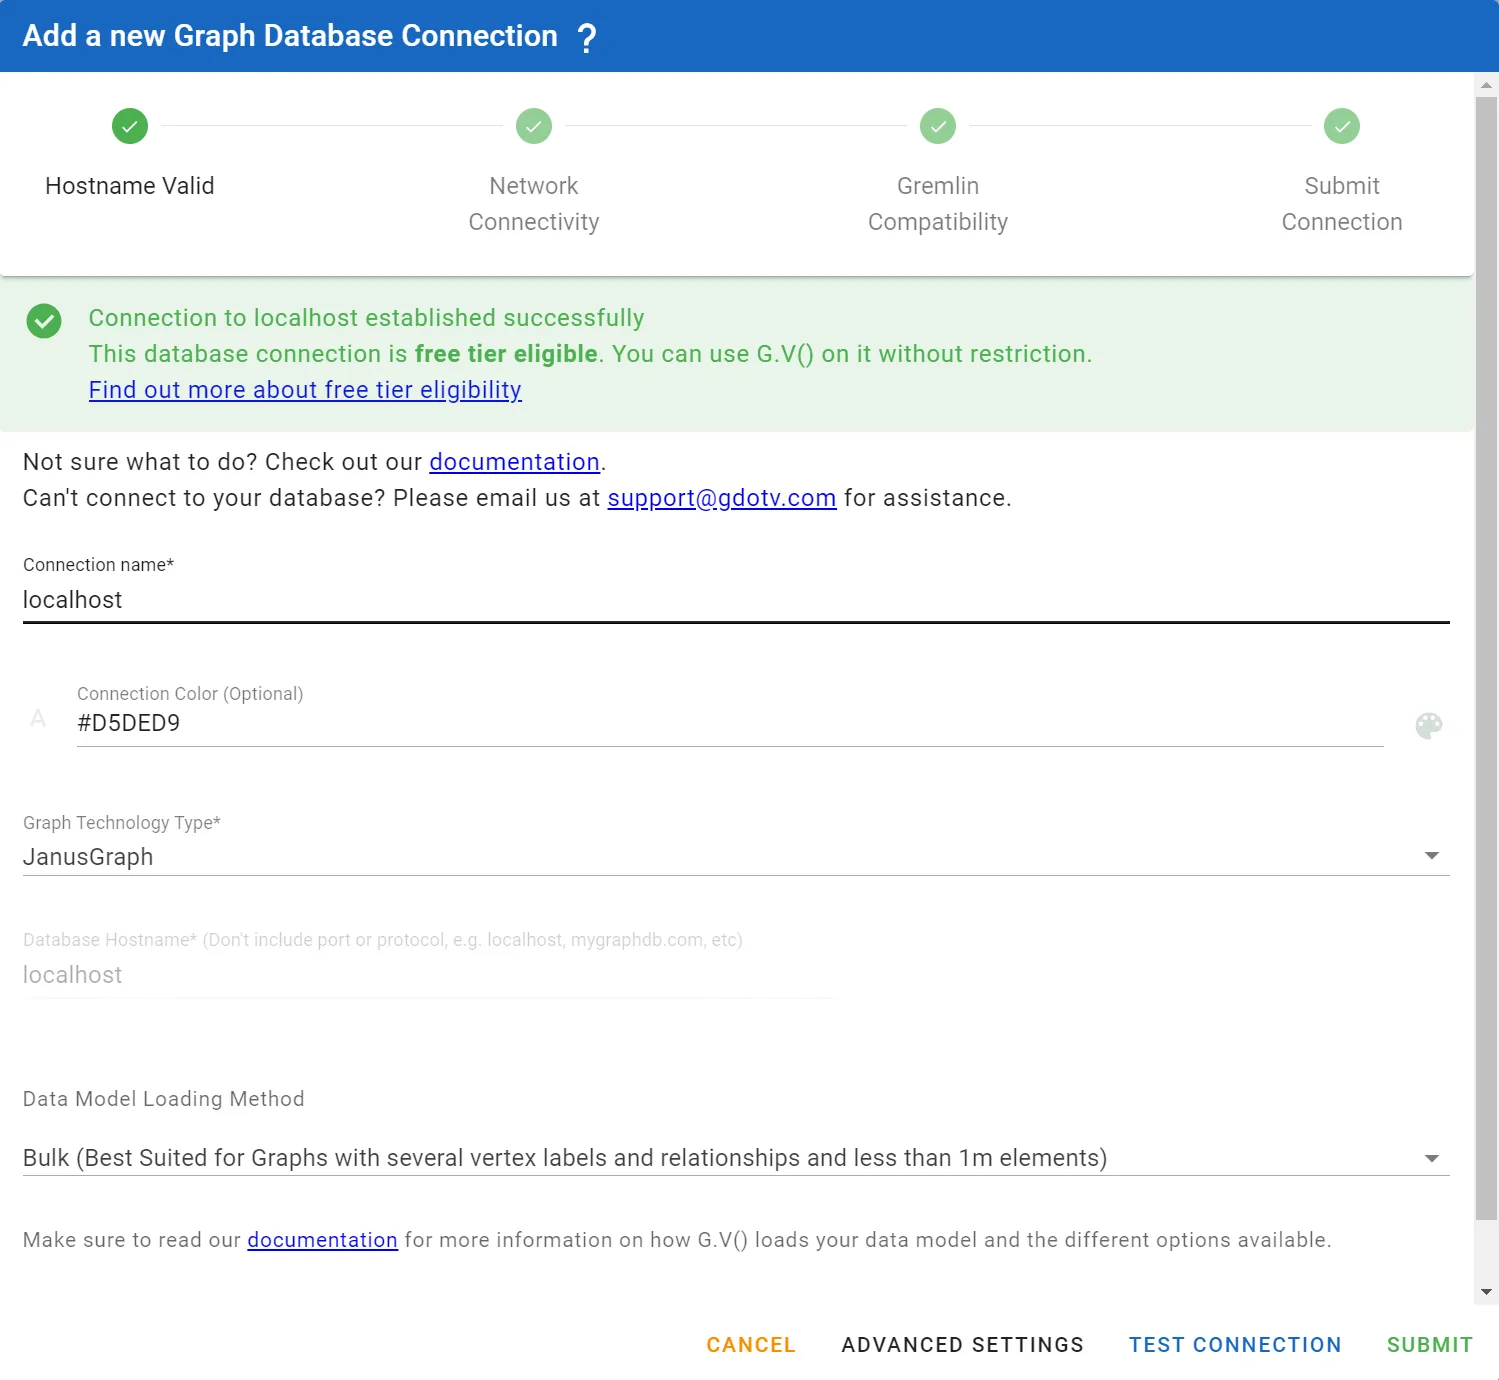
Using the free tier did not affect your ability to sign up for a free trial later on – so once your graph database started to scale, you could still trial the full product before buying.
Visualize your Graph Data with a Map Overlay
Often times, graph data stores properties that represent the geographical location of an entity. Analyzing geographical data is a common use case that gdotv 3.9.32 now supports with an optional map overlay layer on the graph view.
This feature lays out your graph data according to latitude and longitude values extracted from vertex properties, with an interactive map display underneath. It’s easily configurable and can be toggled in one-click, with the ability to save a configuration of the properties to be used for lat/lon values.
As always a demo speaks a thousands words so here’s a quick snipped showing this feature:
New Graph Layout Configuration Options
gdotv comes packed with standard graph layout algorithms optimized for a variety of graph structure archetypes (hierarchical, dense, sparse. clustered). These algorithms are automatically configured on gdotv with sensible settings based on the structure of your graph, that provide an optimized output on the graph.
However some of these algorithms provide useful options for users that can now be configured manually. In addition to that, we’ve added a new algorithm, Circlepack. which is optimized for cluster layout. Circlepack simply requires specifying one or more property identifying the community a vertex belongs to, and the layout will do the rest. Check it out:
We’ve also tuned default algorithm settings and graph camera handling for an overall better user experience.
Improved Results Display User Experience
One of our data visualization option, the “Results” tab, offers a convenient way to browse data regardless of its structure. It’s filterable and efficient, meaning you can navigate complex object results with ease. In previous versions however the overall display was just…not pretty. We’ve reworked the display to not just look better but convey essential information of the records you’re browsing in just a glance. See for yourself:
Everything Else in this New Version
As with every new release of gdotv, additional minor changes and bug fixes are part of this update. Apart from a few user experience bug fixes, we’ve also changed/added the following:
- Improved UI of the graph stylesheet sidebar
- Added ability to change and save the graph viewport’s background color
- Updated documentation look and feel
- Graph data explorer search can now be canceled
- Elements in the graph data explorer can now be retained in the viewport between searches
- Added ability to specify a default Gremlin/Cypher query when opening a new query editor
Conclusion
This release marks the end of 2024 for us – as the holiday season nears this will be our last feature release of the year. We’re working hard on the January 2025 update which will feature a new set of major upgrades for gdotv as a solution. 2025 will be the year we expand the horizon of our product beyond the Apache TinkerPop ecosystem, and offer new ways to deploy and use gdotv in organizations.
To keep track of all the latest news on our product make sure to follow us on LinkedIn where we regularly post developer previews, announcements and other news, such as our attendance of the Knowledge Graph Conference next year in New York!
Until next time.
About the author

Arthur Bigeard
Founder & CEO
Hey! I'm Arthur Bigeard, the CEO and Founder of gdotv. I've discovered and grown a passion for graph databases in my previous jobs, which I've channeled into the making of gdotv. My mission is to create a universal, plug-and-play graph database client to simplify and accelerate the day-to-day tasks of graph data professionals.