For teams in a shared environment
Cloud Workbench For Graph Data Teams
gdotv Team is the ultimate graph database workbench for developers, knowledge engineers and analysts. Write, debug and run queries, discover and track graph schemas, visualise and explore graph data.
It is the most widely compatible graph data studio, working across property graph and RDF technologies without compromise.
Available on AWS, Azure, Google Cloud Platform or self-hosted.
Why gdotv Team?
<15 minutes
from marketplace to a running deployment
30+ databases
property graph and RDF, unlimited parallel connections
7+ query languages
Gremlin, Cypher, SPARQL, GQL, GoogleSQL, SQL/PGQ and DQL
1
premium graph workbench to replace scattered native tools
Getting started
From deployment to first report
Also available to self-host on Kubernetes or Docker Compose.
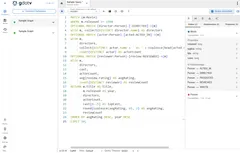
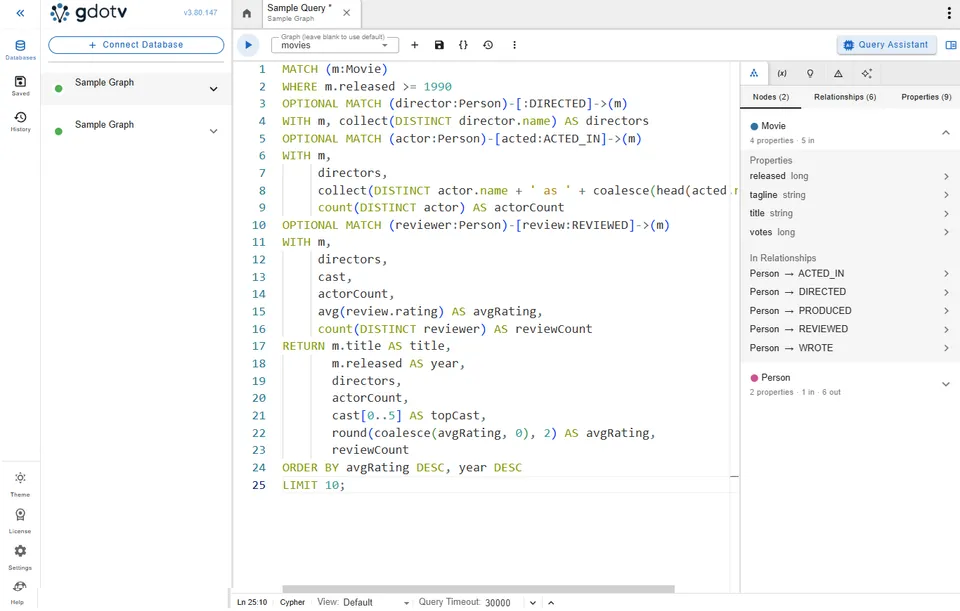
Results can also be visualised as a table for a quick overview and comparison of values returned.
On a cloud marketplace
Virtual machine deployment
Self-hosted
On your own infrastructure
Deployed in under 15 minutes
Inside gdotv Team
Features overview
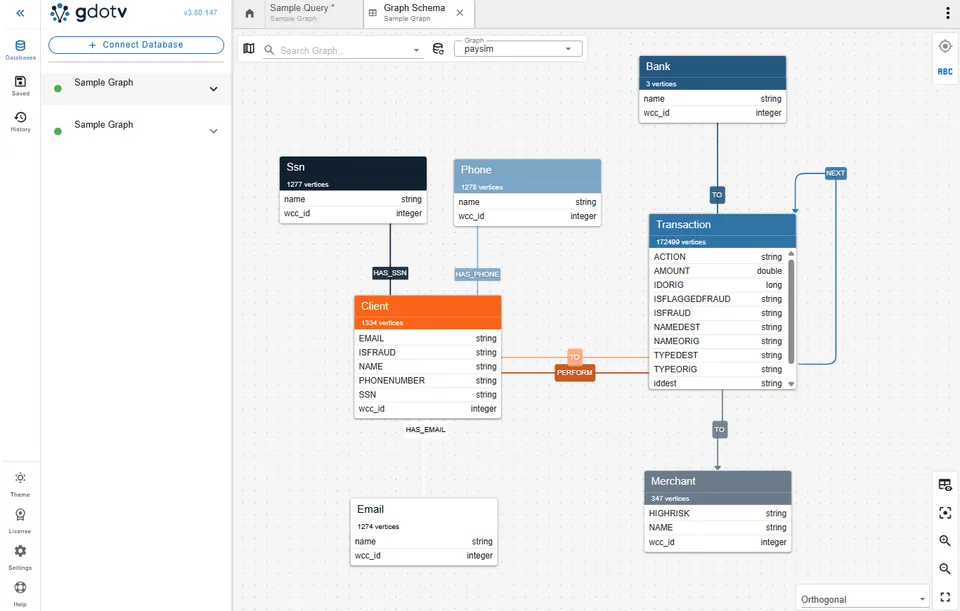
Shared connections and a shared data model
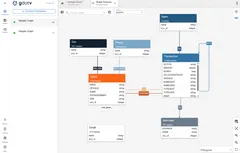
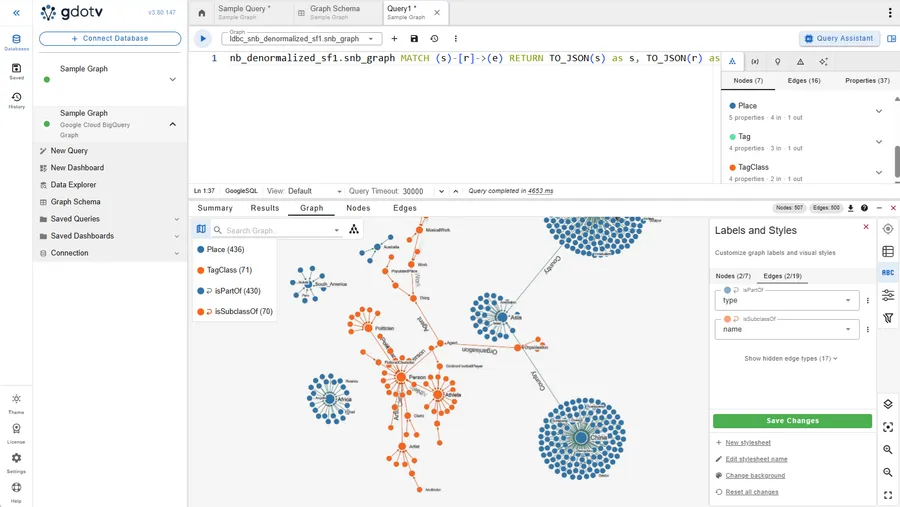
gdotv Team is a hub from which your developers, data scientists and analysts can work on graph databases as a team with a shared understanding of their data models.
Interactive, no-code graph exploration
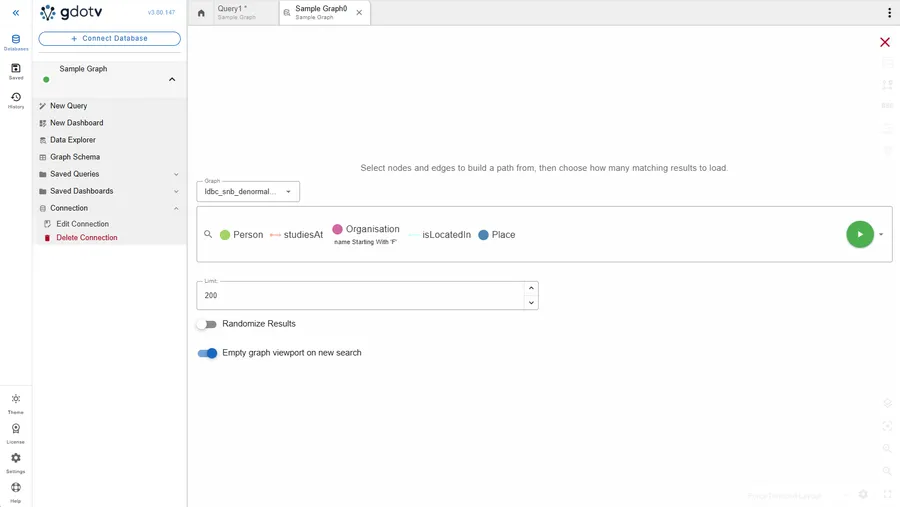
Search the graph without writing a query, express a path with property filters in just a few clicks to investigate a specific area of your graph data. No coding or graph query language knowledge required.
Create and deploy dashboards for your graph data
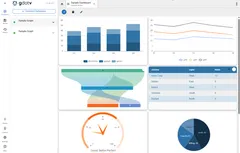
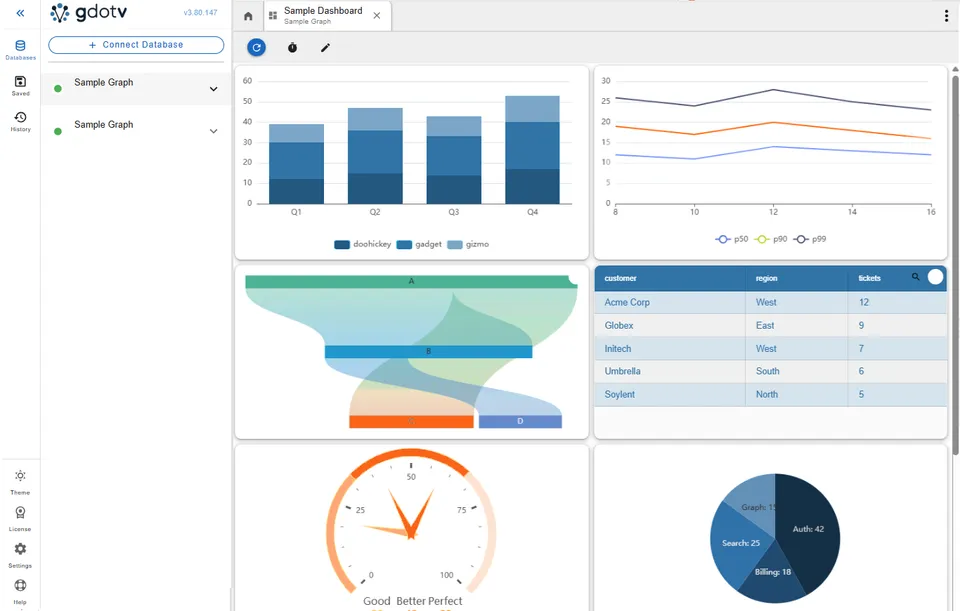
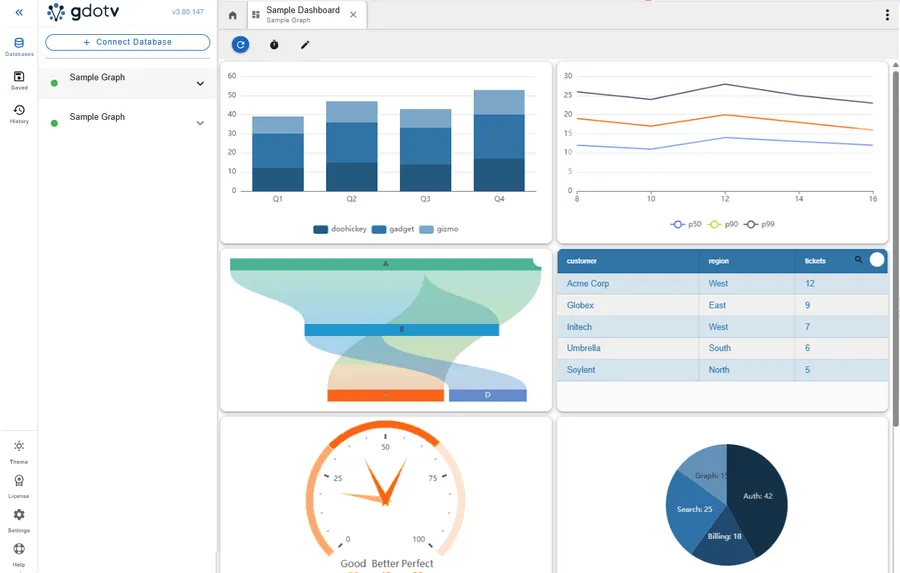
Build interactive dashboards with tables, graphs, bar charts, line charts, maps and more directly against your graph database. Dashboards can be configured with parameters, auto refresh timeouts and multiple tabs, then easily be shared to the rest of your team.
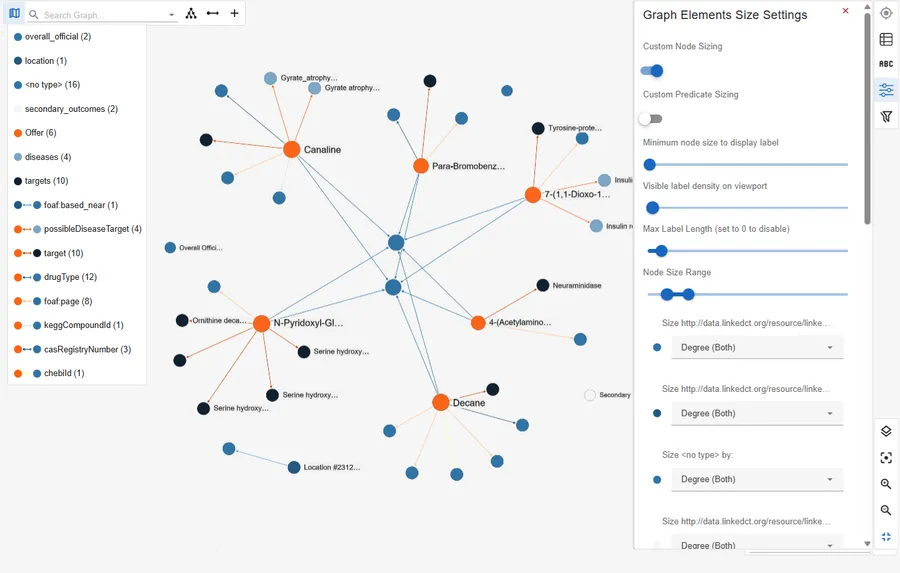
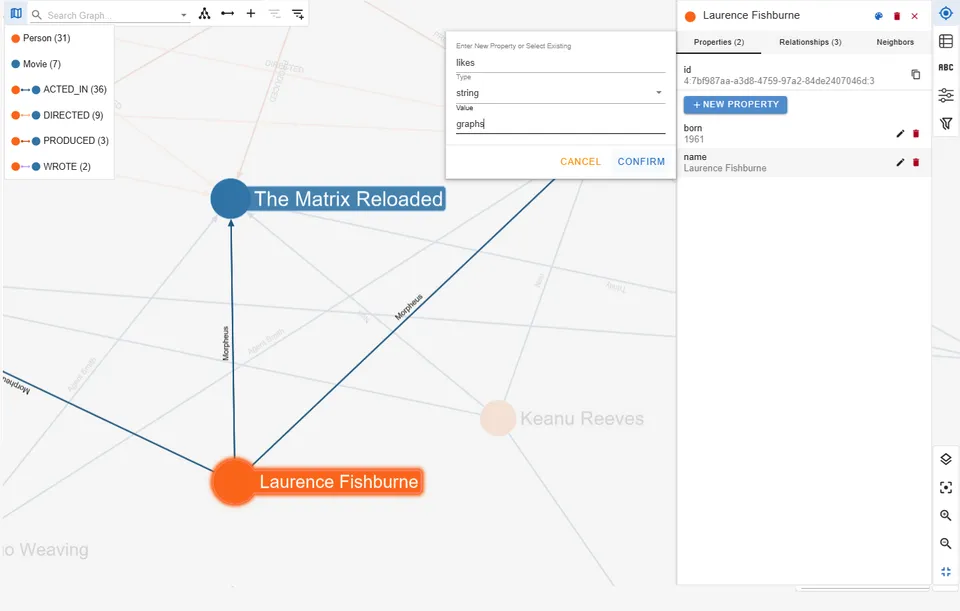
State-of-the-art graph visualization
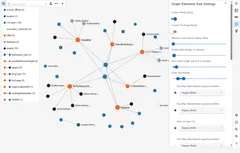
Interactive graph rendering for results of any size, from a few nodes to several thousand elements. Features configurable layouts, filtering, neighbour expansion and a geospatial mode. Create shared style configurations, label display rules, colouring and sizing schemes that you can switch between in one click to highlight different key points from your graph data.
Graph database coverage
30+ graph databases under a single workbench
Property graph or RDF, managed or self-hosted - first class support for every popular graph database. One workbench to replace every vendor specific graph explorer.
 Amazon Neptune
 Google Cloud Spanner Graph
 Azure Cosmos DB
 Neo4j AuraDB
 Amazon Neptune Analytics
 Google Cloud BigQuery Graph
- Amazon Neptune (RDF)
 GraphDB
 Stardog
 PuppyGraph
 FalkorDB
 Neo4j
Neo4j Apache Jena
 LadybugDB
 Apache AGE
 JanusGraph
 Apache HugeGraph
 pgGraph
 Memgraph
 RDF4J
RDF4J Aerospike Graph
 ArcadeDB
 Dgraph
 Tentris
 RDFox
RDFox QLever
 Gremlin Server
 Oracle
 DataStax
 Ultipa
 Virtuoso
 AllegroGraph
 Kuzu
Kuzu Blazegraph
 Aliyun GDB
Deploy in your own environment



gdotv Team: frequently asked questions
How is gdotv Team different from gdotv Desktop?
gdotv Team offers the same features as gdotv Desktop. However, gdotv Team is cloud-deployed and accessible for your whole team via a web browser
This means everyone on the team has access to the same database connections, saved queries, stylesheets and dashboards, and signs in securely through your identity provider.
Desktop is licensed per seat. Team allows unlimited users and is charged on a host VM compute basis.
Where does it run?
In your own AWS, Google Cloud or Azure account, deployed via their respective marketplaces, in a virtual machine.
Alternatively, self-hosting via Kubernetes or Docker Compose is available; book a demo and we will set it up with you.
How is it priced?
gdotv Team is metered per vCPU-hour through the marketplace you deploy from. You are charged only while a gdotv instance is running.
The rate depends on the marketplace and the instance size gdotv Team is deployed on. There are no additional licensing costs.
Is there a free trial?
Yes. Trials run through the marketplace you deploy from, on that marketplace's own terms, and are available for self-hosted deployments too; the length varies, so check the listing or ask us and we will walk you through it.
How does single sign-on work?
Every deployment ships with Keycloak, which handles sign-in from the first minute with usernames and passwords you create in its admin console.
To use your own identity provider, point that Keycloak at it over SAML or OIDC and your existing groups and joiner-mover-leaver process carry over. Removing someone from the group removes their access.
How is our data handled in gdotv Team?
gdotv Team runs inside on your own infrastructure and connects to your graph databases from there, so traffic to them stays in your network and nothing routes through gdotv servers.
We have no access to your graph, your queries or your credentials. Connections, saved queries and dashboards are stored in the deployment's own database, alongside it in your account.
How many people can share one deployment?
The default recommended instance size on cloud marketplaces is suitable for teams of 5-15 users.
Which databases can we connect?
Refer to our databases page for a full, up to date compatibility list.
When should we look at gdotv Enterprise instead?
Once you need governed, auditable access to your graph databases outside the boundaries of typical technical roles. In Team, every member of the deployment sees the same connections.
Enterprise adds role-based access control per connection, so a new analyst and a principal engineer can share a deployment with configurable levels of access.
See gdotv Enterprise.We already have Desktop licenses. Does Team replace them?
Not necessarily. Individual developers may use gdotv Desktop to work with localhost-ran graph databases whilst using Team for the shared connections, reporting and dashboards.