
Databases
pgGraph IDE and graph visualization tool
Run GQL graph queries over the PostgreSQL tables you already have, and see the traversals as a graph.
Get started
Easy installation and setup
Effortlessly integrate gdotv with your pgGraph-enabled PostgreSQL database with a simplified plug-and-play database connector. The gdotv database client provides straightforward database connection and configuration instructions to get you started in less than a minute.
This pgGraph IDE is available to download for Windows, macOS and Linux, with a one-click installer to get you started instantly.
State-of-the-Art GQL and SQL Editor
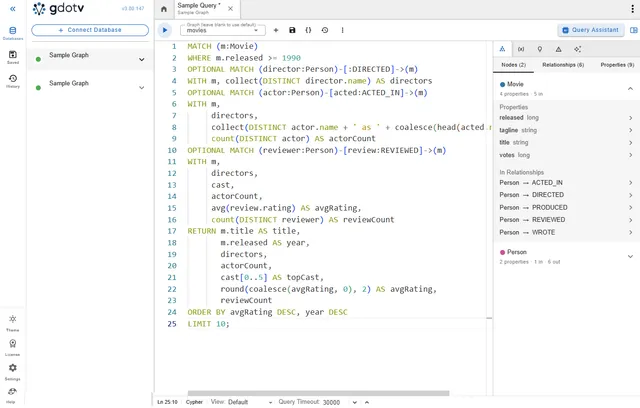
Write GQL against pgGraph and gdotv wraps it in the graph.gql() call for you, with syntax validation and schema-aware autocomplete as you type. Drop down to raw SQL, including pgGraph’s own traversal functions, whenever you prefer.
Explore your Graph Without a Query
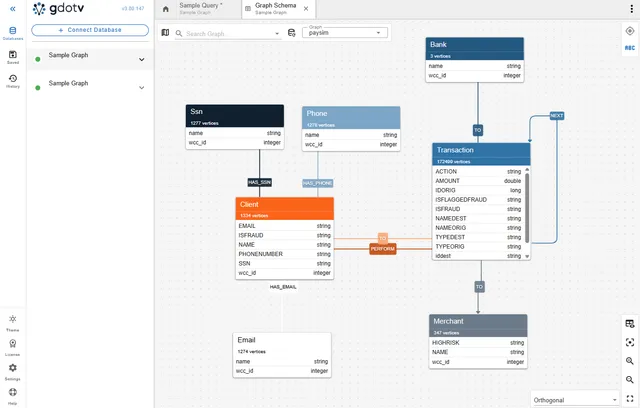
gdotv reads pgGraph’s registered tables and edges into an interactive data model, and the no-code Data Explorer builds and runs path searches over it for you.
Dashboards, Profiles and Visualization
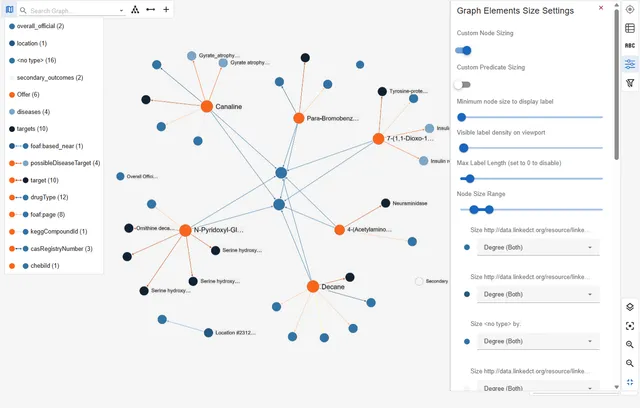
Communicate the most important elements of your graph using gdotv’s visualization and analytics tools, which are designed to convey key insights to both technical and non-technical audiences.
Try gdotv with pgGraph
Query, visualise and model your pgGraph data on your laptop, in your own cloud or across the whole team.
gdotv Desktop
The ultimate graph database IDE.
Install and connect your first graph database in 2 minutes.
gdotv Enterprise
The universal graph intelligence platform.
For organization-wide deployments. Bring graph data directly to your analysts.
About pgGraph
pgGraph is an open source, Apache-2.0 licensed PostgreSQL extension from Evokoa, written in Rust, that adds graph traversal to Postgres without a separate graph database and without a migration. It builds a compact, rebuildable graph index over the relational tables and foreign keys you select, and exposes bounded breadth-first and depth-first search, shortest paths and connected components as SQL functions, so the recursive-CTE traps that stall Postgres at depth no longer apply. PostgreSQL stays your system of record. It supports PostgreSQL 14 through 18.
pgGraph is one of the graph-on-relational engines, alongside Apache AGE: AGE layers a dedicated property-graph model and openCypher onto Postgres, while pgGraph indexes your existing tables and leaves the relational layout untouched. You can use gdotv to connect to a pgGraph-enabled database, write GQL or SQL against it, browse its data model and turn traversal results into interactive graph visualizations.
gdotv is compatible with pgGraph 0.1.7 and above; see the gdotv database support notes for details. Learn more about pgGraph in the pgGraph documentation.
Frequently asked questions
How can I get started with pgGraph and gdotv?
Getting started with pgGraph and gdotv is easy. It’s just one simple installation, available on Windows, macOS and Linux. No prerequisites, additional configuration or installation required. You can get started in seconds.
Enter your PostgreSQL connection details, point gdotv at the pgGraph-enabled database and you are ready to query. pgGraph keeps one implicit graph per database, so there is no graph name to specify.
Want a step-by-step walkthrough? Make sure to check out our demo, Get Started with pgGraph + gdotv on YouTube, or read our introduction to pgGraph support.
How do I query pgGraph in gdotv?
pgGraph is driven by SQL functions in a graph schema, but you do not have to hand-write them. gdotv lets you write GQL directly and automatically runs it through pgGraph’s graph.gql() function, so you get GQL syntax validation, schema-aware autocomplete and parameter injection as you type. It is the same approach gdotv takes for Apache AGE with Cypher.
Prefer the raw primitives? Switch the query tab to the “SQL (pgGraph)” language and call graph.search(), graph.traverse() or graph.shortest_path() yourself. Results that contain graph elements render as an interactive graph either way, with a table, JSON and object-browser view one click away.
Is pgGraph ready for production?
Not yet. pgGraph is in early alpha, and its maintainer’s guidance is to avoid production use for now, even though it has been tested to be stable. Run it in Docker or a dedicated development database while you evaluate it.
Two further things to know before you start: graphs built in pgGraph’s default read-only projection mode cannot be edited from gdotv, and interactive create, update and delete of vertices, edges and properties requires a graph built in mutable_overlay mode.
How does pgGraph compare with Apache AGE?
Both bring graph queries to PostgreSQL, but from opposite directions. Apache AGE adds a dedicated property-graph model and the openCypher language to Postgres, so you model and store a graph inside your database. pgGraph builds a derived graph index over the relational tables you already have and exposes traversals as functions, so nothing about your schema changes and the index can be rebuilt at any time.
Choose AGE when you want a real property graph living next to your relational data and Cypher to query it. Choose pgGraph when the graph is already implicit in your tables and foreign keys and you want fast traversals, shortest paths and GQL over it with no migration. gdotv connects to both, so you can compare them side by side.
What graph data visualization scenarios do our customers implement?
Organizing data derived via powerful data visualization tools have several real-life applications. Graph visualization and analysis resources allow users to make informed decisions based on actual data. Here are a few examples of the type of companies or clients that can leverage pgGraph along with the robust data visualization aspect offered by gdotv:
- Data scientists and managers: Visual data analysis allows users to uncover and understand emerging patterns and relationships between data points, discover valuable insights to make informed decisions on ways to transform business processes.
- Cyber security groups: Build security graphs to represent protected assets, infrastructure, code dependencies or networks and visualize the connected relationships throughout the organization.
- Business intelligence analysts: Create customized reports and visualizations that can be easily executed for analysts to investigate and communicate on interaction between business data points.
- Fraud detection: Detect fraud patterns by modeling relationships between transactions and financial actors, then interactively visualize graph data to uncover and present potentially suspicious behavior.
How does gdotv secure my data?
gdotv Desktop runs locally on your device – no deployment needed and no handing over your data to a third-party system. Everything happens within your organisation’s network, and we have no access to your data.
Our Team and Enterprise versions run within your own environment, providing the same security benefits.
It’s easy to install and configure too: our setup wizard gets you connected to your graph database in seconds.
Can I connect more than one database at a time?
Yes! Whether you’d like to access multiple pgGraph databases, or interact with other graph vendors at the same time, gdotv doesn’t limit you to a single database. You can establish as many connections as you like from within our intuitive UI, and seamlessly switch between them.
Connecting is easy, and there’s no need to manage multiple vendor specific user interfaces. With gdotv, query and compare results from all your RDF and Labeled Property Graph databases under one umbrella.
Related posts
All blog posts
gdotv Now Supports pgGraph, Graph Queries on PostgreSQL
Explore pgGraph support in gdotv: connect to your PostgreSQL tables, write GQL graph queries, and visualize traversals and shortest paths with no migration.
Introducing pgGraph Support, Node Icons & Language-Aware Terminology [gdotv v3.63.137 Release Notes]
Discover gdotv v3.63.137: pgGraph support brings graph queries to PostgreSQL, plus node icons, language-aware vertex & edge terminology, RDF lang-tag grouping.