
Databases
Gremlin Server IDE and graph visualization tool
Connect gdotv to Gremlin Server, then query, visualise and debug your graph in one workspace. Free three-week trial on Windows, macOS and Linux.
Get started
Easy installation and setup
Effortlessly integrate gdotv with your Gremlin Server graph database with a simplified plug-and-play database connector. The gdotv database client provides straightforward database connection and configuration instructions to get you started in less than a minute.
This Gremlin Server IDE is available to download for Windows, macOS and Linux, with a one-click installer to get you started instantly.
State-of-the-Art Gremlin Editor
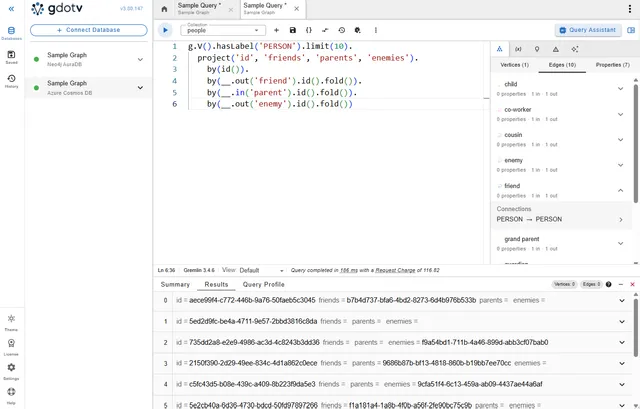
gdotv’s comprehensive Gremlin query editor comes with syntax highlighting, autocomplete suggestions and built-in documentation. It also features the first ever Gremlin debugger
Explore, Manage and Modify your Graph
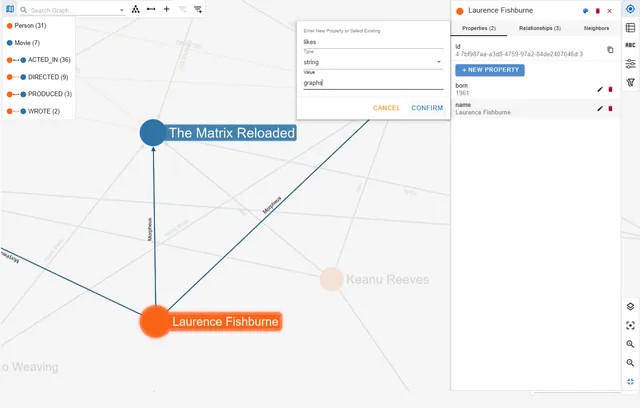
Effortlessly traverse your graph with the no-code Data Explorer, the data model view, interactive layouts, and customization panels to manage and even edit your graph on the fly.
Dashboards, Profiles and Visualization
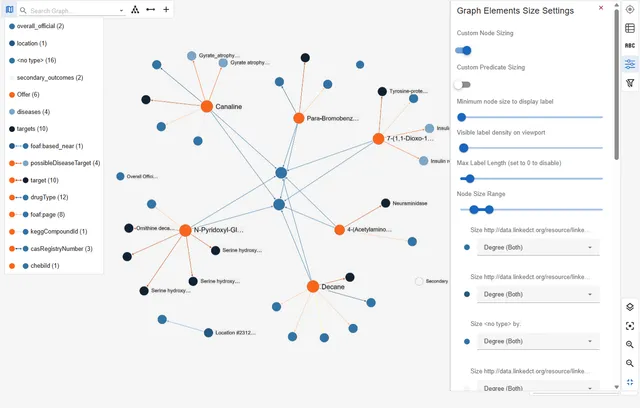
Communicate the most important elements of your graph using gdotv’s visualization and analytics tools, which are designed to convey key insights to both technical and non-technical audiences.
Try gdotv with Gremlin Server
Query, visualise and model your Gremlin Server data on your laptop, in your own cloud or across the whole team.
gdotv Desktop
The ultimate graph database IDE.
Install and connect your first graph database in 2 minutes.
gdotv Enterprise
The universal graph intelligence platform.
For organization-wide deployments. Bring graph data directly to your analysts.
About Gremlin Server
Gremlin Server is a component of the Apache TinkerPop ecosystem that allows you to host and remotely access and analyze graph data in a database. It uses Gremlin, a data flow language, that enables expressive complex traversals with an intuitive step-by-step query syntax.
You can use gdotv to easily connect to your Gremlin Server, then perform essential day-to-day graph database development and management tasks such as querying, data analysis, data management, debugging, testing and visualization.
Learn more about Gremlin Server in the Apache TinkerPop documentation.
Frequently asked questions
How to get started with Gremlin Server?
Once their Gremlin Server is running, users can manually create a graph and run Gremlin queries using the Gremlin Console.
The Gremlin Console users also need to alias graph traversals to their graph in order to start querying their data — this all needs to be done manually.
We believe that using gdotv is essential to maximize success for your graph project, especially in the early days. To find out more about what gdotv offers compared to the Gremlin Console, you can check out this blog post.
How can I get started with Gremlin Server and gdotv?
Getting started with Gremlin Server and gdotv is easy. It’s just one simple installation, available on Windows, macOS and Linux. No prerequisites, additional configuration or installation required. You can get started in seconds.
gdotv automatically detects your connection setting requirements based on your database hostname and prompts you for the required information for an easy onboarding experience.
Want a step-by-step walkthrough? Make sure to check out our demo, Get Started with Gremlin Server + gdotv on YouTube.
Why use Gremlin?
Gremlin Server uses the Gremlin query language. Gremlin, being a traversal language, allows you to navigate the nodes and edges of your graph, filter them by their properties, and perform complex aggregations and pattern-matching operations to extract valuable insights.
It has a unique design that breaks from the convention of established languages such as SQL to provide a development experience tailored to the interconnected nature of graphs.
As an open-source framework, Apache TinkerPop benefits from the support of a large community of users, vendors and contributors that build on top of the project to provide enterprise-ready graph database implementations, complete with features such as index management and storage backend configuration.
What features does gdotv provide for Gremlin?
gdotv offers the first ever Gremlin Query Debugging functionality to analyze your graph traversals. Click here to see it in action!
You can use gdotv’s traversal simulation and report tools to gain a new perspective on your graph data.
In addition, gdotv’s Gremlin query editor also provides syntax highlighting, autocomplete suggestions and built-in Gremlin documentation to help you optimize your queries.
What’s the advantage of using LPGs over RDF?
Graph databases typically fall into two models: Labeled Property Graph (LPG) and Resource Description Framework (RDF).
The LPG model covers a broad class of databases, including Gremlin Server, that use nodes, edges, properties and labels to represent graphs. They are optimised for real-time use and excel in applications like fraud detection, social network analysis and recommendation algorithms. There are also a wide range of methods to enforce schema compliance, with flexible conventions and definitions.
The RDF model refers to a highly standardized form of data management using global identifiers. Information is stored as a series of directed “triple” statements connecting a subject, predicate and object together. In addition, various languages built on RDF (such as RDFS and OWL) allow the construction of sophisticated ontologies and semantic reasoning. The high level of standardization also simplifies data integration from disparate sources. This makes RDF ideal for applications in large knowledge graph construction and research.
LPGs excel when performance and ease-of-use are a priority. Users typically find LPGs more intuitive, and they can be tailored to specific use-cases quickly and easily without the semantic complexity or steep learning curve of RDF.
What graph data visualization scenarios do our customers implement?
Organizing data derived via powerful data visualization tools have several real-life applications. Graph visualization and analysis resources allow users to make informed decisions based on actual data. Here are a few examples of the type of companies or clients that can leverage Gremlin Server along with the robust data visualization aspect offered by gdotv:
- Data scientists and managers: Visual data analysis allows users to uncover and understand emerging patterns and relationships between data points, discover valuable insights to make informed decisions on ways to transform business processes.
- Cyber security groups: Build security graphs to represent protected assets, infrastructure, code dependencies or networks and visualize the connected relationships throughout the organization.
- Business intelligence analysts: Create customized reports and visualizations that can be easily executed for analysts to investigate and communicate on interaction between business data points.
- Fraud detection: Detect fraud patterns by modeling relationships between transactions and financial actors, then interactively visualize graph data to uncover and present potentially suspicious behavior.
How does gdotv secure my data?
gdotv Desktop runs locally on your device – no deployment needed and no handing over your data to a third-party system. Everything happens within your organisation’s network, and we have no access to your data.
Our Team and Enterprise versions run within your own environment, providing the same security benefits.
It’s easy to install and configure too: our setup wizard gets you connected to your graph database in seconds.
Can I connect more than one database at a time?
Yes! Whether you’d like to access multiple Gremlin Server instances, or interact with other graph vendors at the same time, gdotv doesn’t limit you to a single database. You can establish as many connections as you like from within our intuitive UI, and seamlessly switch between them.
Connecting is easy, and there’s no need to manage multiple vendor specific user interfaces. With gdotv, query and compare results from all your RDF and Labeled Property Graph databases under one umbrella.
Related posts
All blog posts
Graph Algorithms on Billions of Edges with Apache DataFusion
We replicate Sem Sinchenko’s Apache DataFusion pipeline for running PageRank and Weakly Connected Components on billion-scale graphs using a laptop, and verify the results with gdotv.
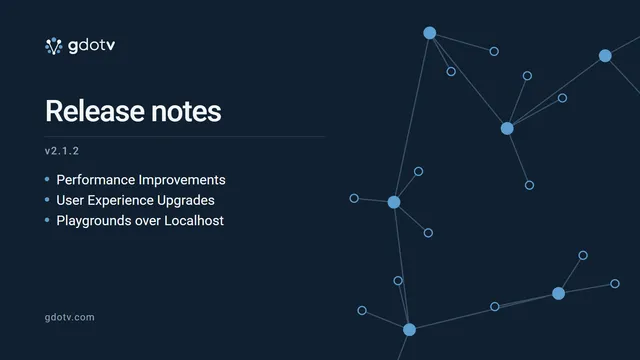
gdotv 2.1.2 Release Showcase
Welcome to the gdotv 2.1.2 Release Showcase! We’ve upgraded to a Vue 3/Vite stack, allowing for faster performance. User experience features have also improved.