Discover & Visualize Your Graph Database Schema in Just 2 Steps

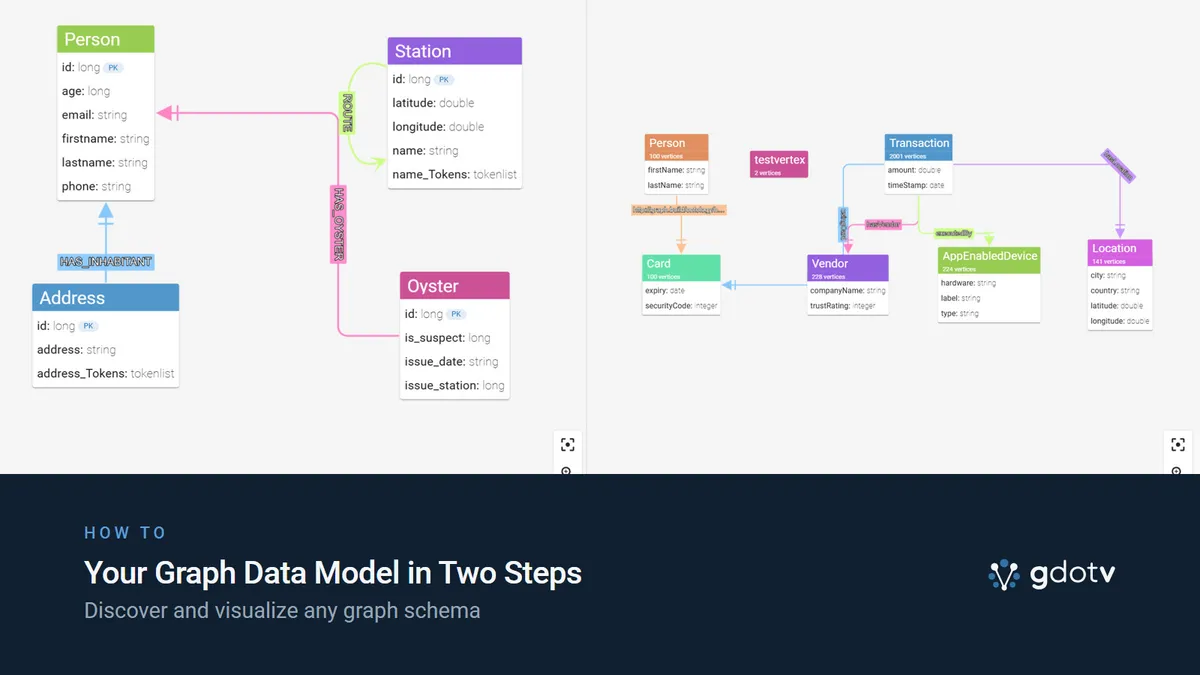
Understanding the schema of your graph database is essential to putting your next app into production. At the same time, it isn’t as easy as it should be.
In the relational database world, the data you add to your database has to fit the given schema, so you don’t need to monitor your schema nearly as often while you input or update data. But with most graph databases, the data model is flexible, allowing you to build on and enrich the database schema at any time, especially as new data is added.
And that versatility comes with a cost: when working as part of a dev team, it’s easy for your schema to get complicated – and messy – fast. So, keeping track of your graph database schema is a must. You need to know what properties, labels, and relationships your graph data structure includes, because it might include far more than you originally thought.
Last year, the AWS team shared their steps to discover and visualize the schema for an Amazon Neptune graph database, and it’s…extremely involved. There are lots of complicated steps, and it’s a wonder if many developers would go through all that trouble.
With gdotv, however, your graph database model is tracked automatically and visualized instantly. The best part? You don’t even need to purchase gdotv – it’s completely free. It’s also available for every graph database we support (and there’s a lot of ‘em).
Here’s how you can access and visualize your graph data schema in just a few minutes:
tl;dr
Spoiler alert: It’s only two steps.
- Connect your graph database
- Click “View Graph Data Model” in the left-hand sidebar
Done!
Curious about the details? Let’s dive in.
1. Connect Your Graph Database to gdotv
Connecting your graph database to gdotv is simple and straightforward.
- Click “New Database Connection” in the top left corner.
- Enter your database hostname and port.
- Authenticate (if required).
Once you’re connected, you’re given several data model loading methods to choose from. The best method depends on the size of your graph and their support for schema discovery APIs. Smaller graphs (<1 million elements) and larger graphs (>1 million elements) each have different approaches, and Schema-based where available leverages your database’s own Schema features to instantly load the data model.
Loading Your Graph Data Model…via Schema APIs
This is your best option – when it’s available. Some graph databases such as Neo4j, Google Cloud Spanner Graph, Memgraph or Kuzu each offer their own schema loading facilities in the form of custom procedures or API calls that we leverage directly to provide optimal data model loading performance and accuracy.
Simply put, it’s blazing fast and as true to your schema as it gets – as directly stated by your database.
Loading Your Graph Data Model…for Smaller Graphs
With a smaller graph database (of 1 million elements or fewer), you can use either the Bulk or the Step-by-Step methods. With either method, gdotv will take care of the rest in just one big discovery call. From there, it’s just one click to see your graph data schema.
For example, here’s the Bulk method in action:
(If you’re curious, the Bulk method is better for graphs with more label types, and Step-by-Step is better for fewer labels and relationships. Really, either will do the job just fine.)
Loading Your Graph Data Model…for Larger Graphs
If you have a really large graph database (of more than 1 million nodes and edges) – as is typical in many production use cases – then you’ll probably want to use the Data Discovery method. Instead of proactively loading your entire database into the schema, this method builds a graph data schema automatically as users query data from the graph.
For these large and complex graphs, querying the entire graph all at once is likely to hurt your database performance and/or be computationally expensive. That’s exactly what the Data Discovery option helps you avoid.
Using this method, every time you run a Gremlin or Cypher query (or any other language we support, a list that is always growing), gdotv evaluates if the elements returned by the query – such as nodes, relationships, properties, and labels – are known in terms of the current database schema. As you execute more queries, the graph data model becomes more and more accurate.
For in-production graphs, it might only take a few hours before queries have encountered every aspect of your data schema. Collectively, these many queries build a more accurate view of your schema over time, but without long loading times or a costly full-database query.
2. View & Explore Your Graph Data Model
Once your graph database is connected and loaded, click “View Graph Data Model” in the left-hand sidebar. The database schema in gdotv refreshes every 24 hours, and every time we detect changes to the schema. It can also be refreshed manually if needed in just a couple of clicks.
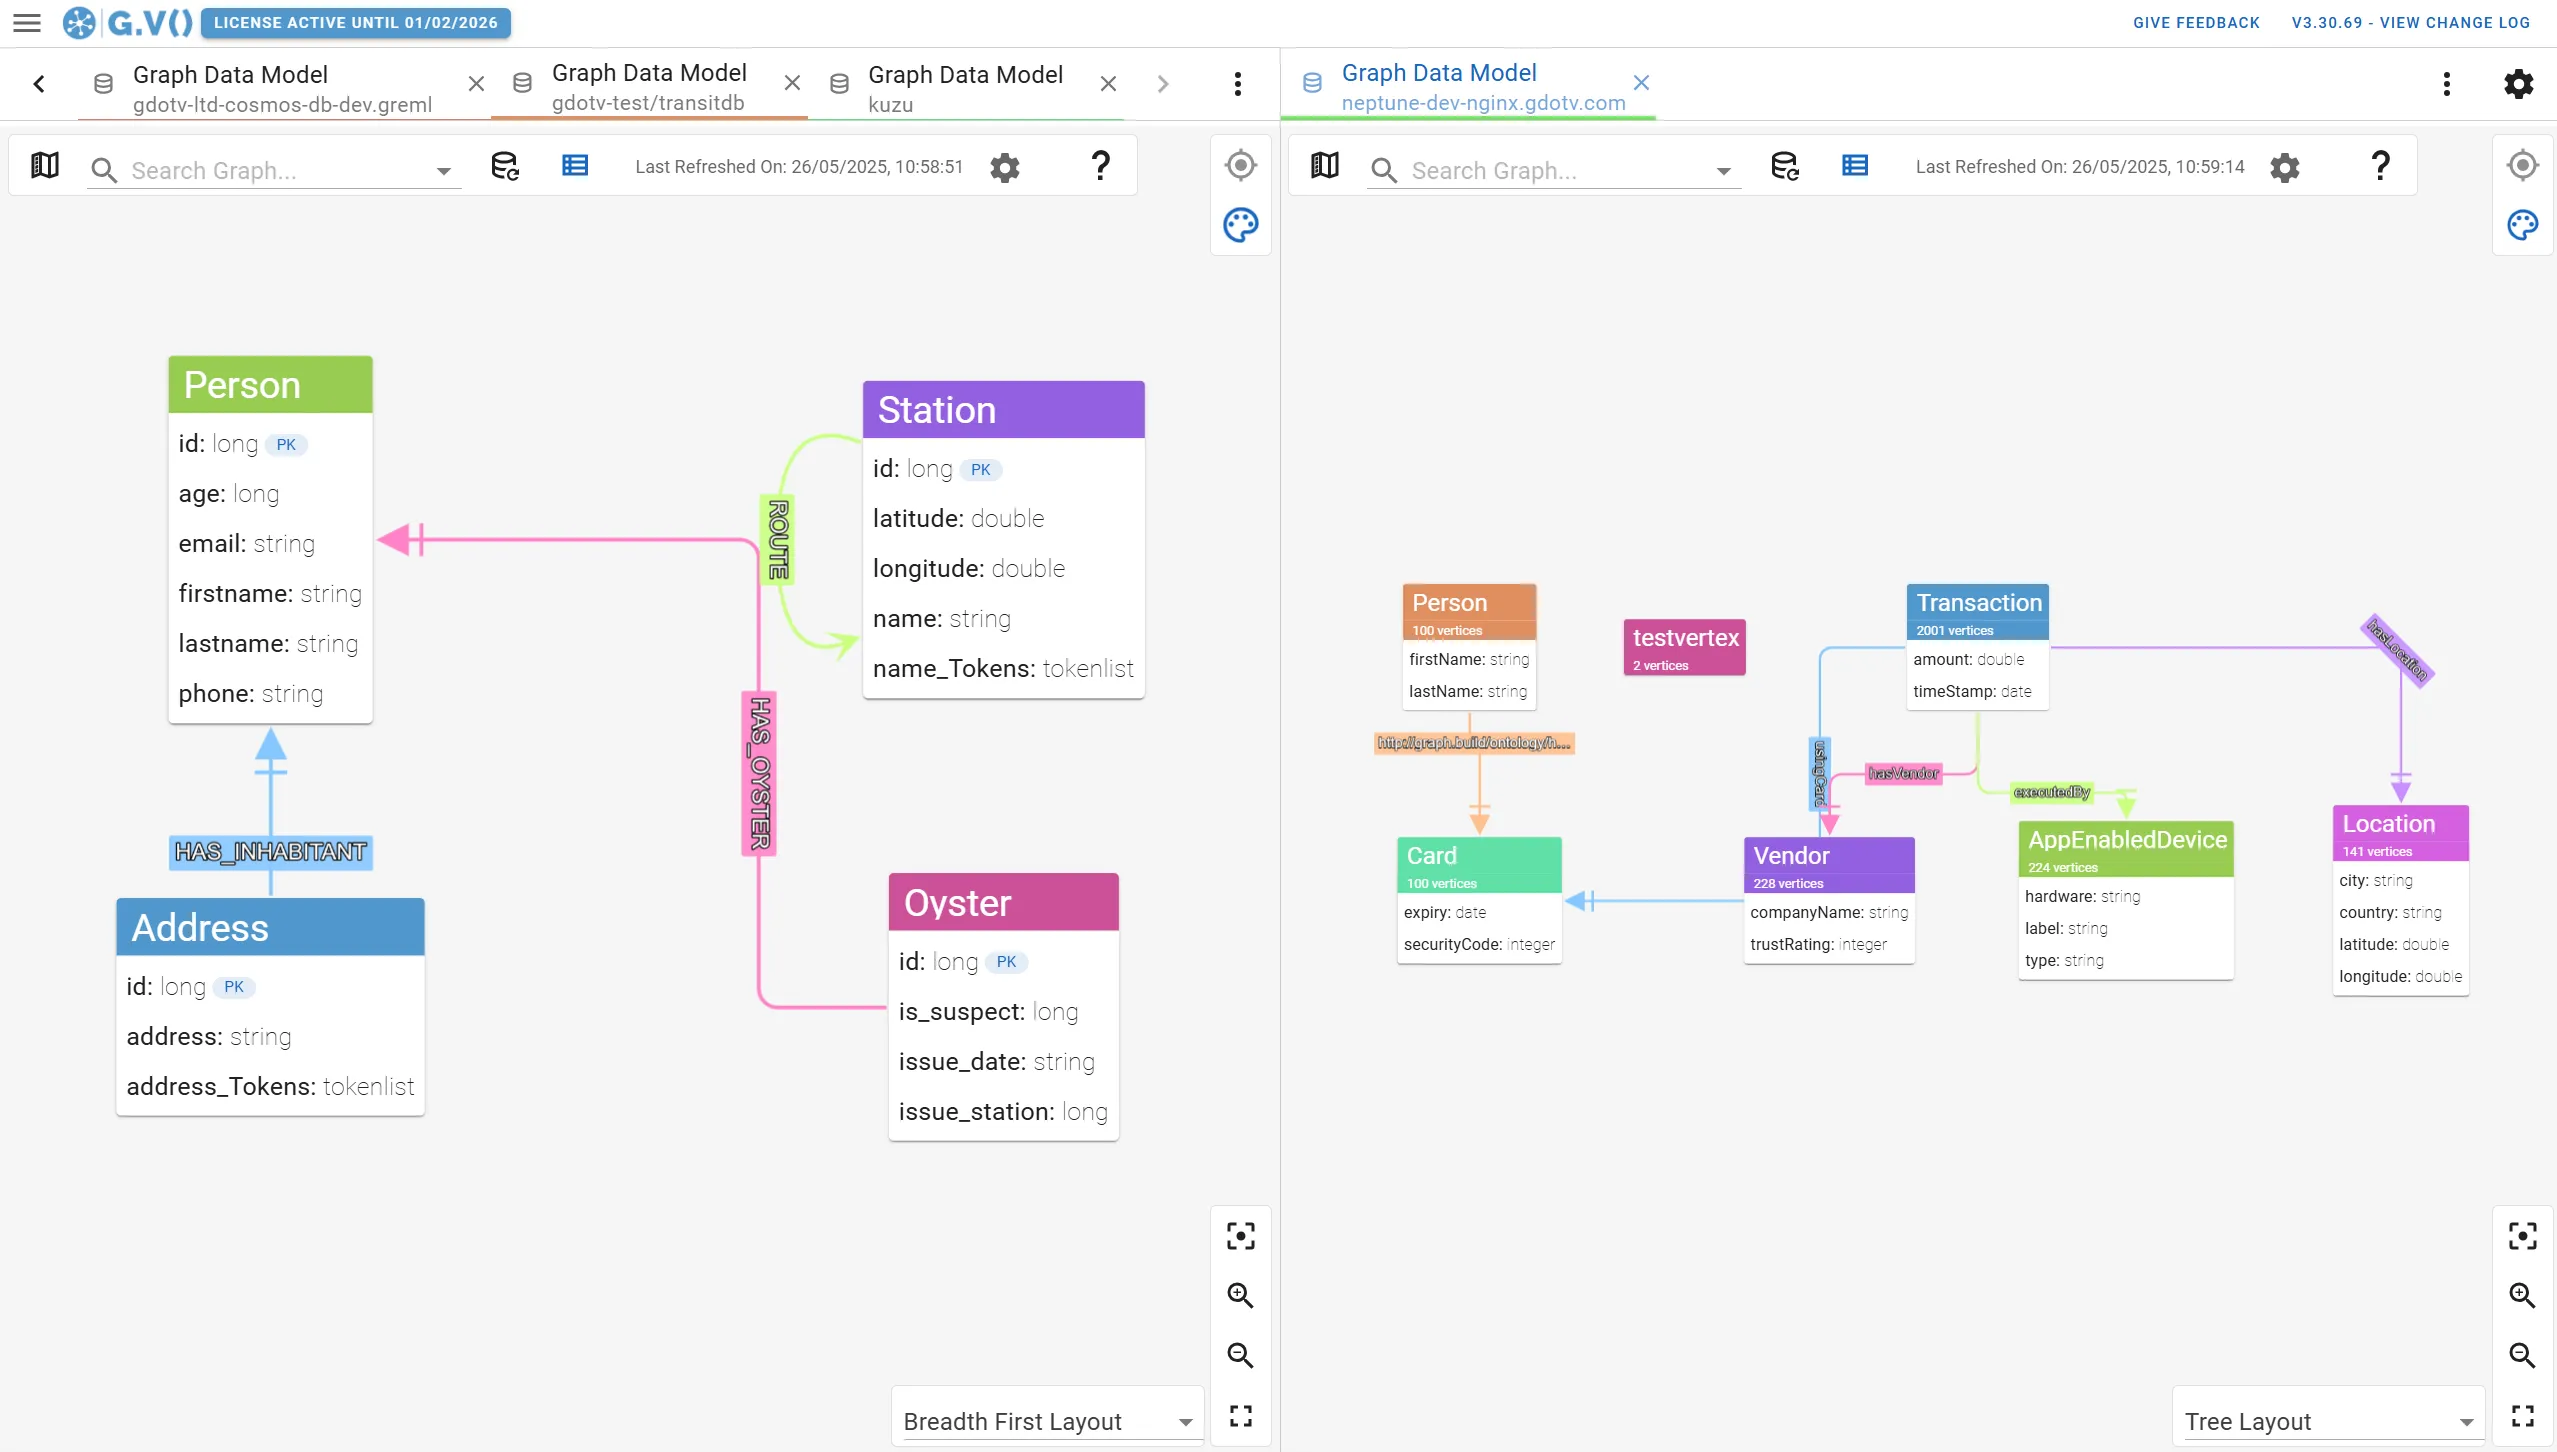
The resulting graph data schema is an easy-to-understand Entity-Relationship (ER) diagram color-coded by node and relationship (or edge). You can click on each node or edge to see more details, including any applicable properties or property types.
If you have a complex data model, you can filter your view by node, edge, or other traits. In addition, you can toggle the visibility of elements on and off, removing them from the viewport if desired.
You can also choose a variety of different layouts for your database schema, including:
- Force Directed
- Tree
- Breadth First
- Grid
- Concentric
- Circle
It’s a quick and easy way to organize your schema structure according to its interconnectedness.
Finally, because gdotv can connect to multiple graph databases, you can compare your data schema across different databases quite easily.
Conclusion
Building and managing an app is enough work without having to track down changes in your graph database schema. Even if your model only evolves slowly over time, those small variations can add up into huge differences between your assumed vs. actual schema.
But those days are over: With gdotv, you get your database schema in just a couple of clicks, and it’s visualized instantly. Explore your schema, filter as needed, track on important nodes, properties, or relationships, and then get back to building what really matters.
About the author

Arthur Bigeard
Founder & CEO
Hey! I'm Arthur Bigeard, the CEO and Founder of gdotv. I've discovered and grown a passion for graph databases in my previous jobs, which I've channeled into the making of gdotv. My mission is to create a universal, plug-and-play graph database client to simplify and accelerate the day-to-day tasks of graph data professionals.