G.V() 2.10.17 Release Notes
Today’s update announcement is actually a batch of the last two feature releases (2.5.9 and 2.10.17) which happened just a couple weeks apart of each other. The focus of both of these updates is mostly on the Large Graph View and its performance.
New Graph Filtering and Navigation options
Graph Filtering View
The purpose of this view is simple: to provide new filtering capabilities built upon the data available in your graph. To do so, we now leverage element property values to display filtering and element selection options. It also allows quickly determining the spread of values for a given property on a vertex or edge.
As always a picture is worth a thousand words and we’ve made a quick animation highlighting these new capabilities which you can check out below:
The filtering view includes a few nifty features to assist with navigation, such as the ability to sort filters by name or size and a search bar so you can quickly get to the property value you’re looking for. It’s a really powerful tool that also allows for some quick insights on your graph, so make sure to try it out!
Vertex Neighbors Highlighting
We’ve reworked and improved the neighbor navigation and highlighting tools available on G.V() to provide a more advanced and insightful experience. Previously, G.V() allowed incrementally selecting neighbors for a vertex but the UI was somewhat hidden and unclear. To remediate this, we’ve added a new tab under the Vertex Details tab as shown below:
This new capability calculates the maximum number of consecutive hops via a neighbor’s edges and their consecutive vertices and edges to reach the farthest (and closest) points of the graph from the currently selected vertex.
Each calculated hop then contains a report of which vertices can be found at that hop as well as how much of the graph they cover.
We’ve got another animation to illustrate this functionality further, shown below:
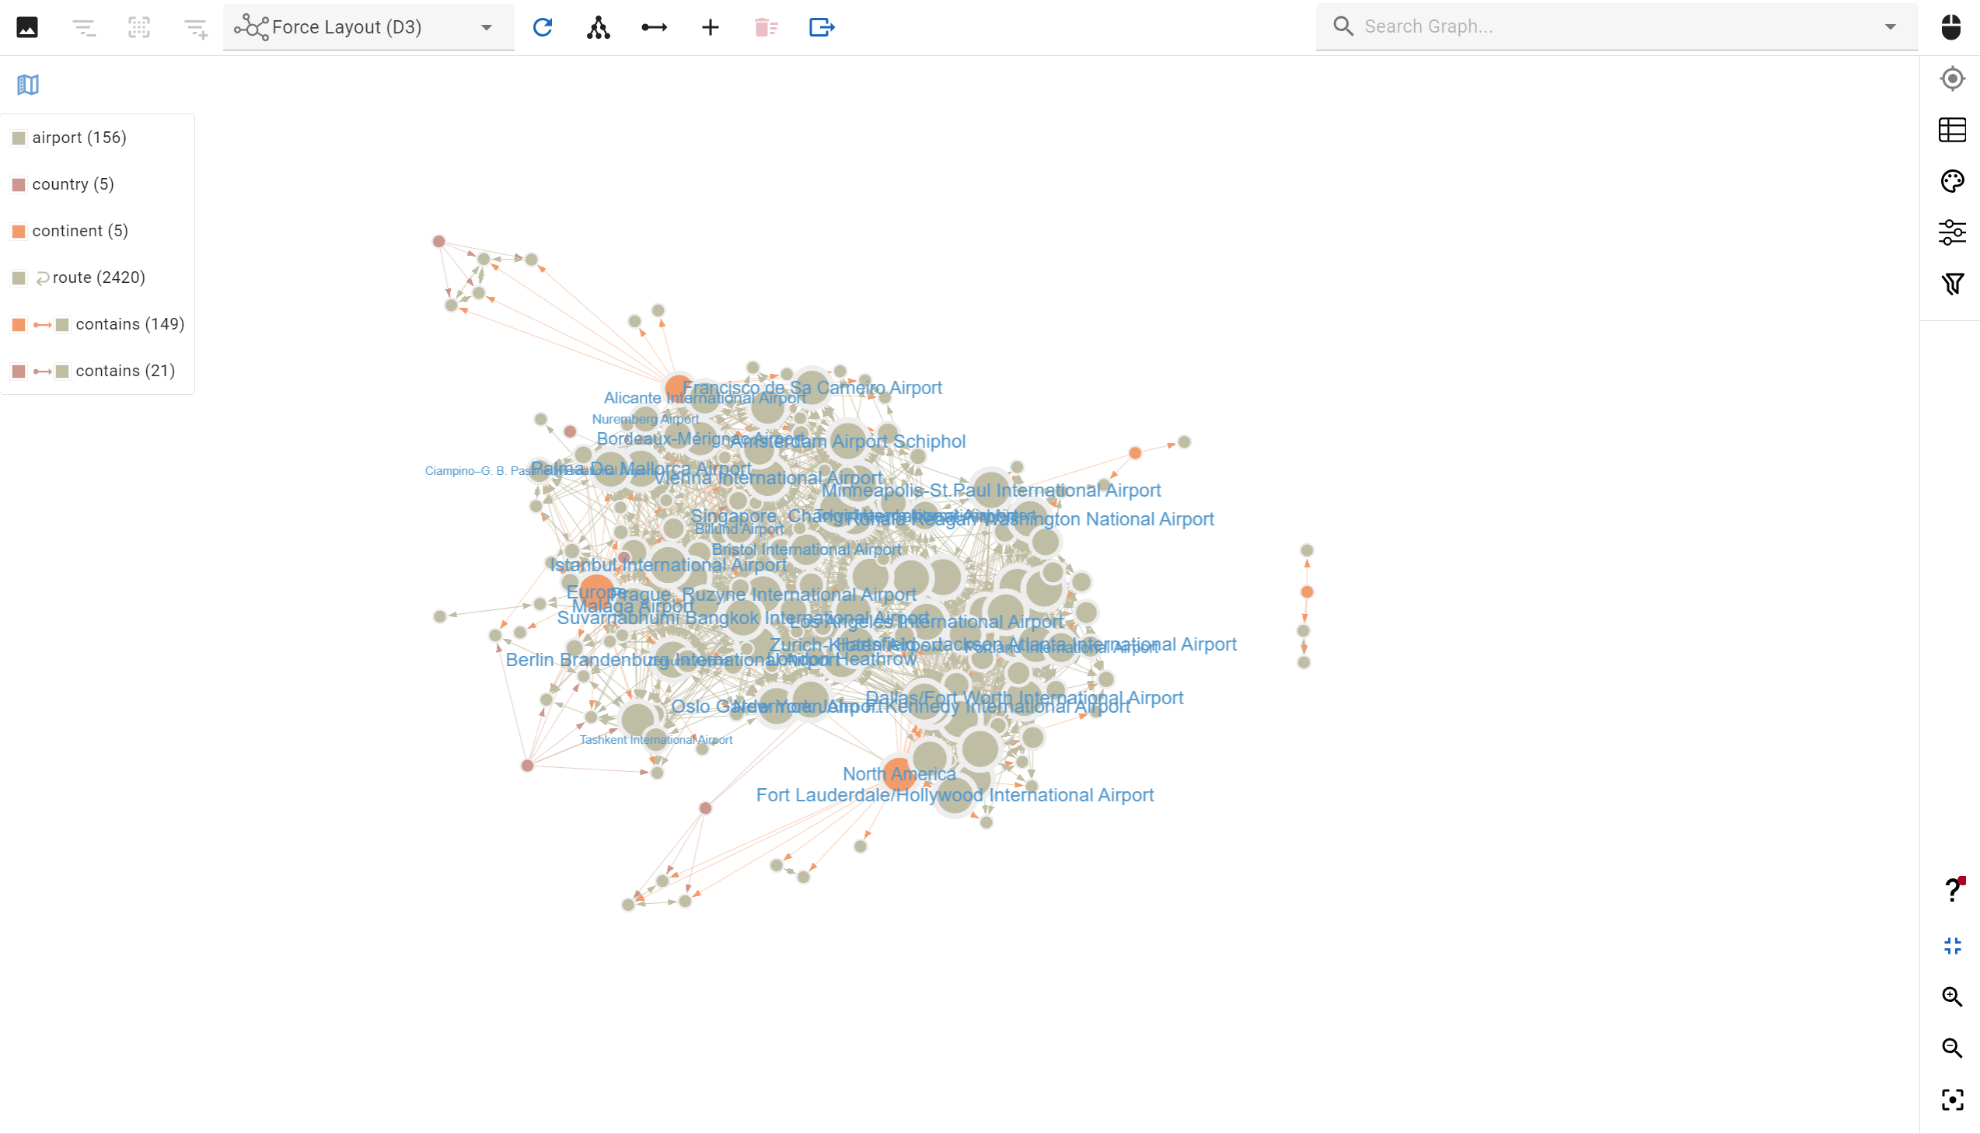
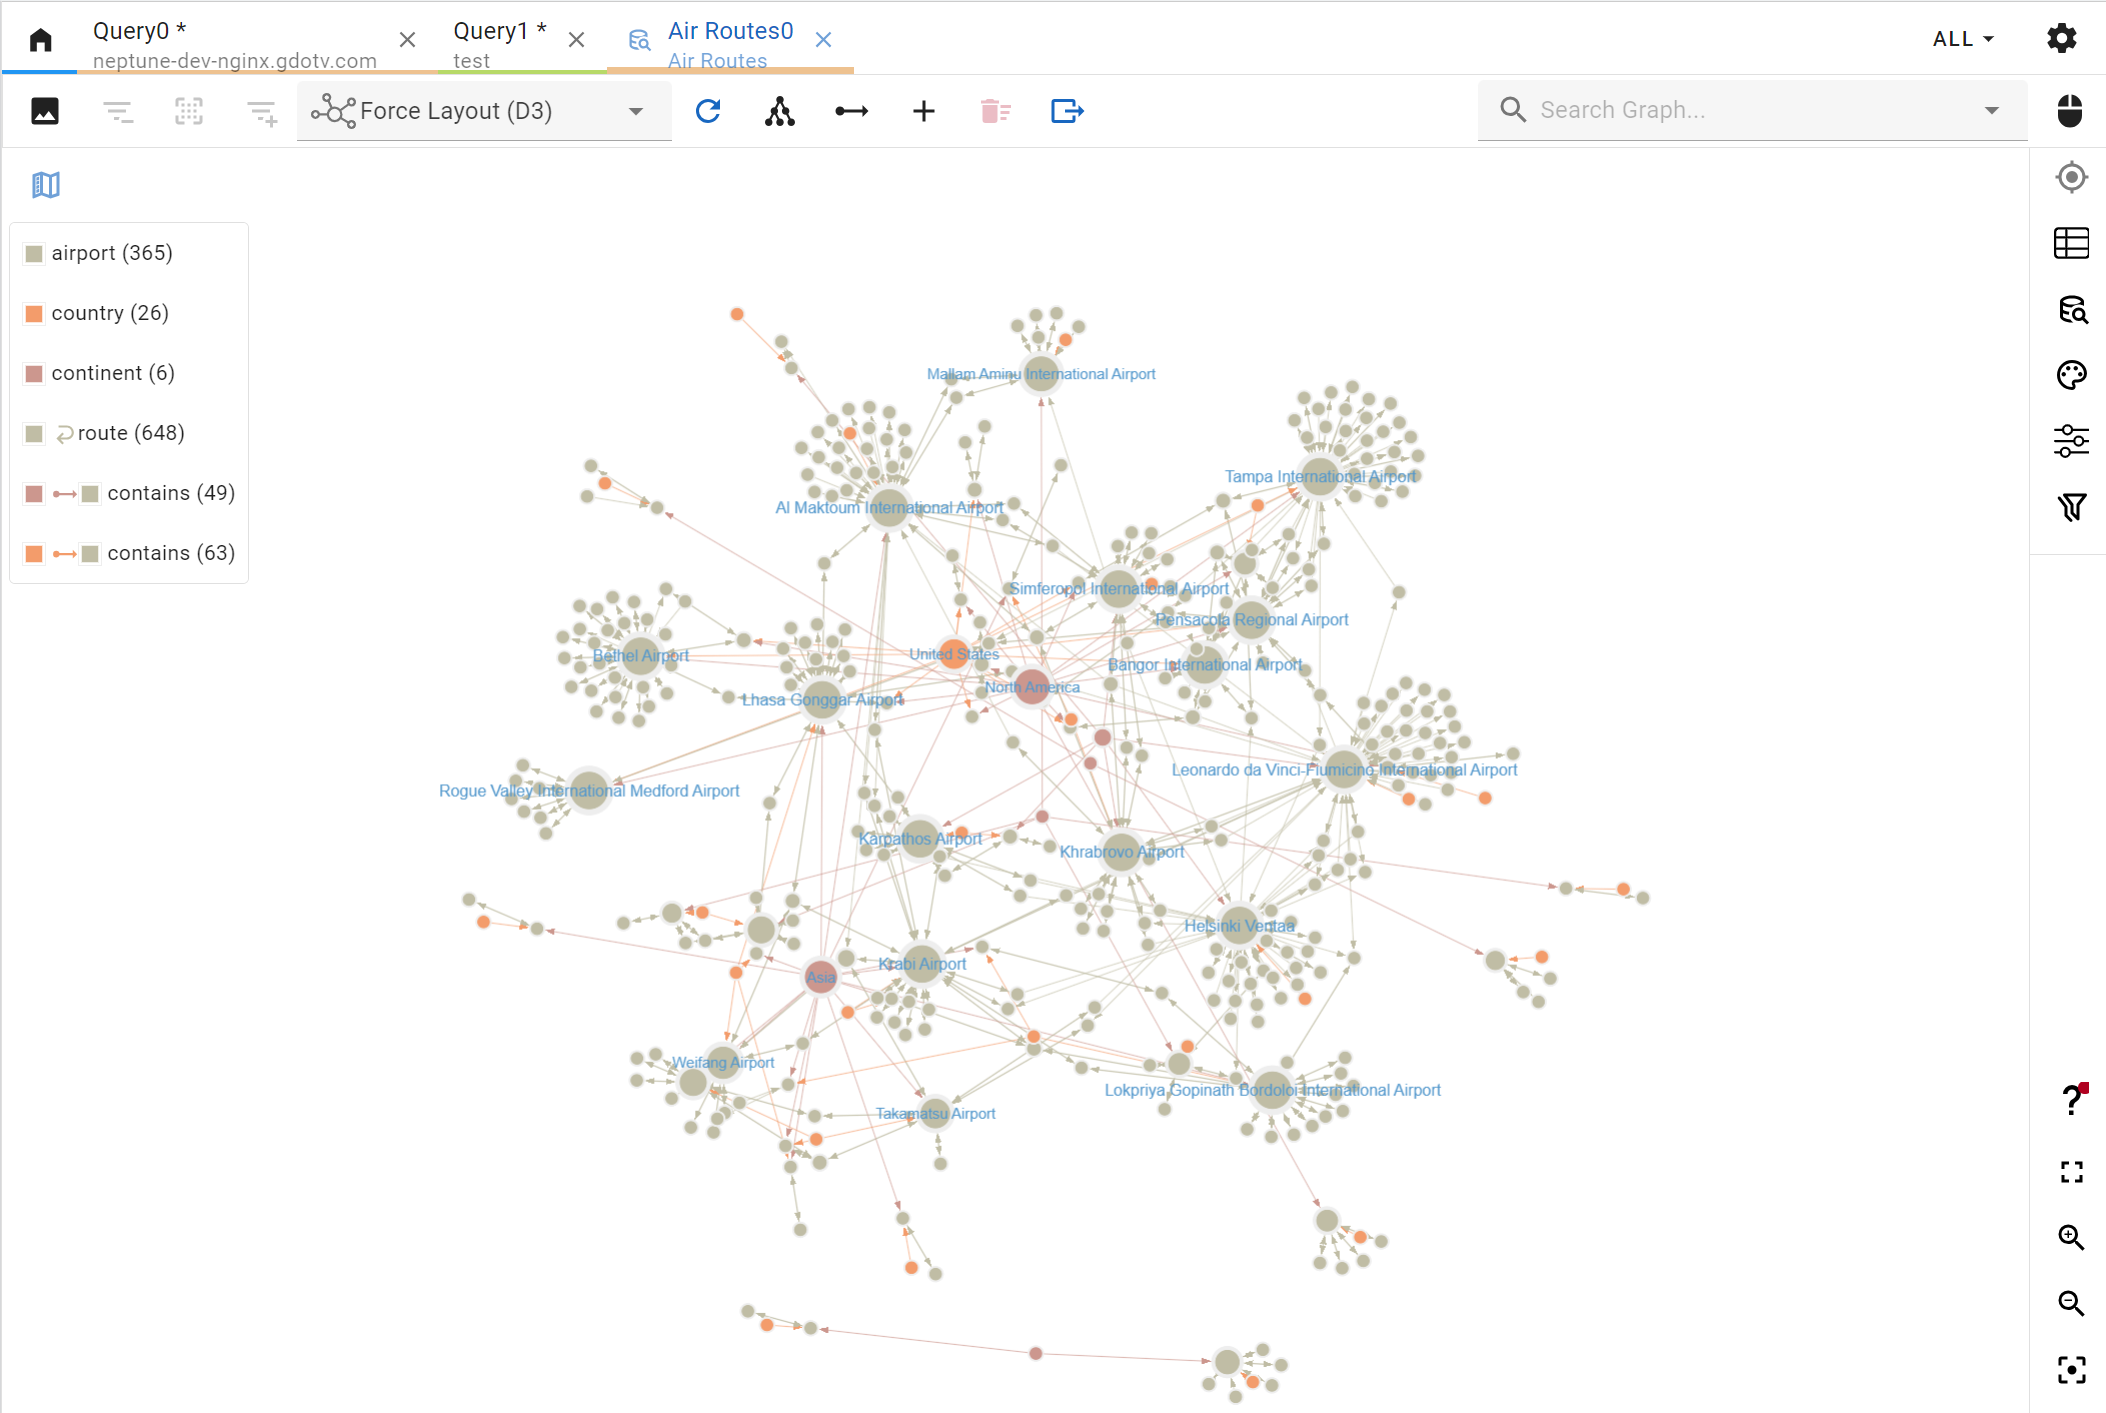
The example above is pretty insightful as it pertains to airports, countries and routes between them. It allows viewing how many hops (in this case airplane route) are required to travel from one country or airport to any airport, country or continent shown on the graph. Note that in this example for brevity only a subset of all airports and routes are showing but this should give you a good idea of where this tool can be effective in delivering visual insights from your graph.
Advanced Corporate Proxy Configuration Options
Some of our users, maybe yourself, need to deploy and use G.V() within a fairly airtight environment. Sometimes this would require the use of a corporate proxy of which your graph databases may be hidden behind. This new release of G.V() finally brings full proxy support to allow connecting to any graph database behind a proxy, through a set of new options that can easily be configured and detailed in our documentation.
Large Graph View Performance and UX improvements
The Large Graph View is a core component of G.V() that we’ve been continuously investing in since we first introduced it in 2022. It is powered by the SigmaJS graph visualization library (and it’s sister graph library, Graphology). Earlier this year, the SigmaJS team has announced the release of its long awaited v3, which we have proudly supported and sponsored. If you’re interested in building graph visualization then you simply must check SigmaJS/Graphology – it’s free and open-source!
This new v3 SigmaJS version is of course relevant to this post as we’ve now officially upgraded G.V() to use it, and it brings significant performance improvements as well as new rendering capabilities to provide a more versatile visual experience to the framework. The goal of these improvements is to allow SigmaJS (and therefore G.V()) to render more elements, faster, and increase the speed of processing graph updates for re-renders (e.g. when switching stylesheets in G.V()).
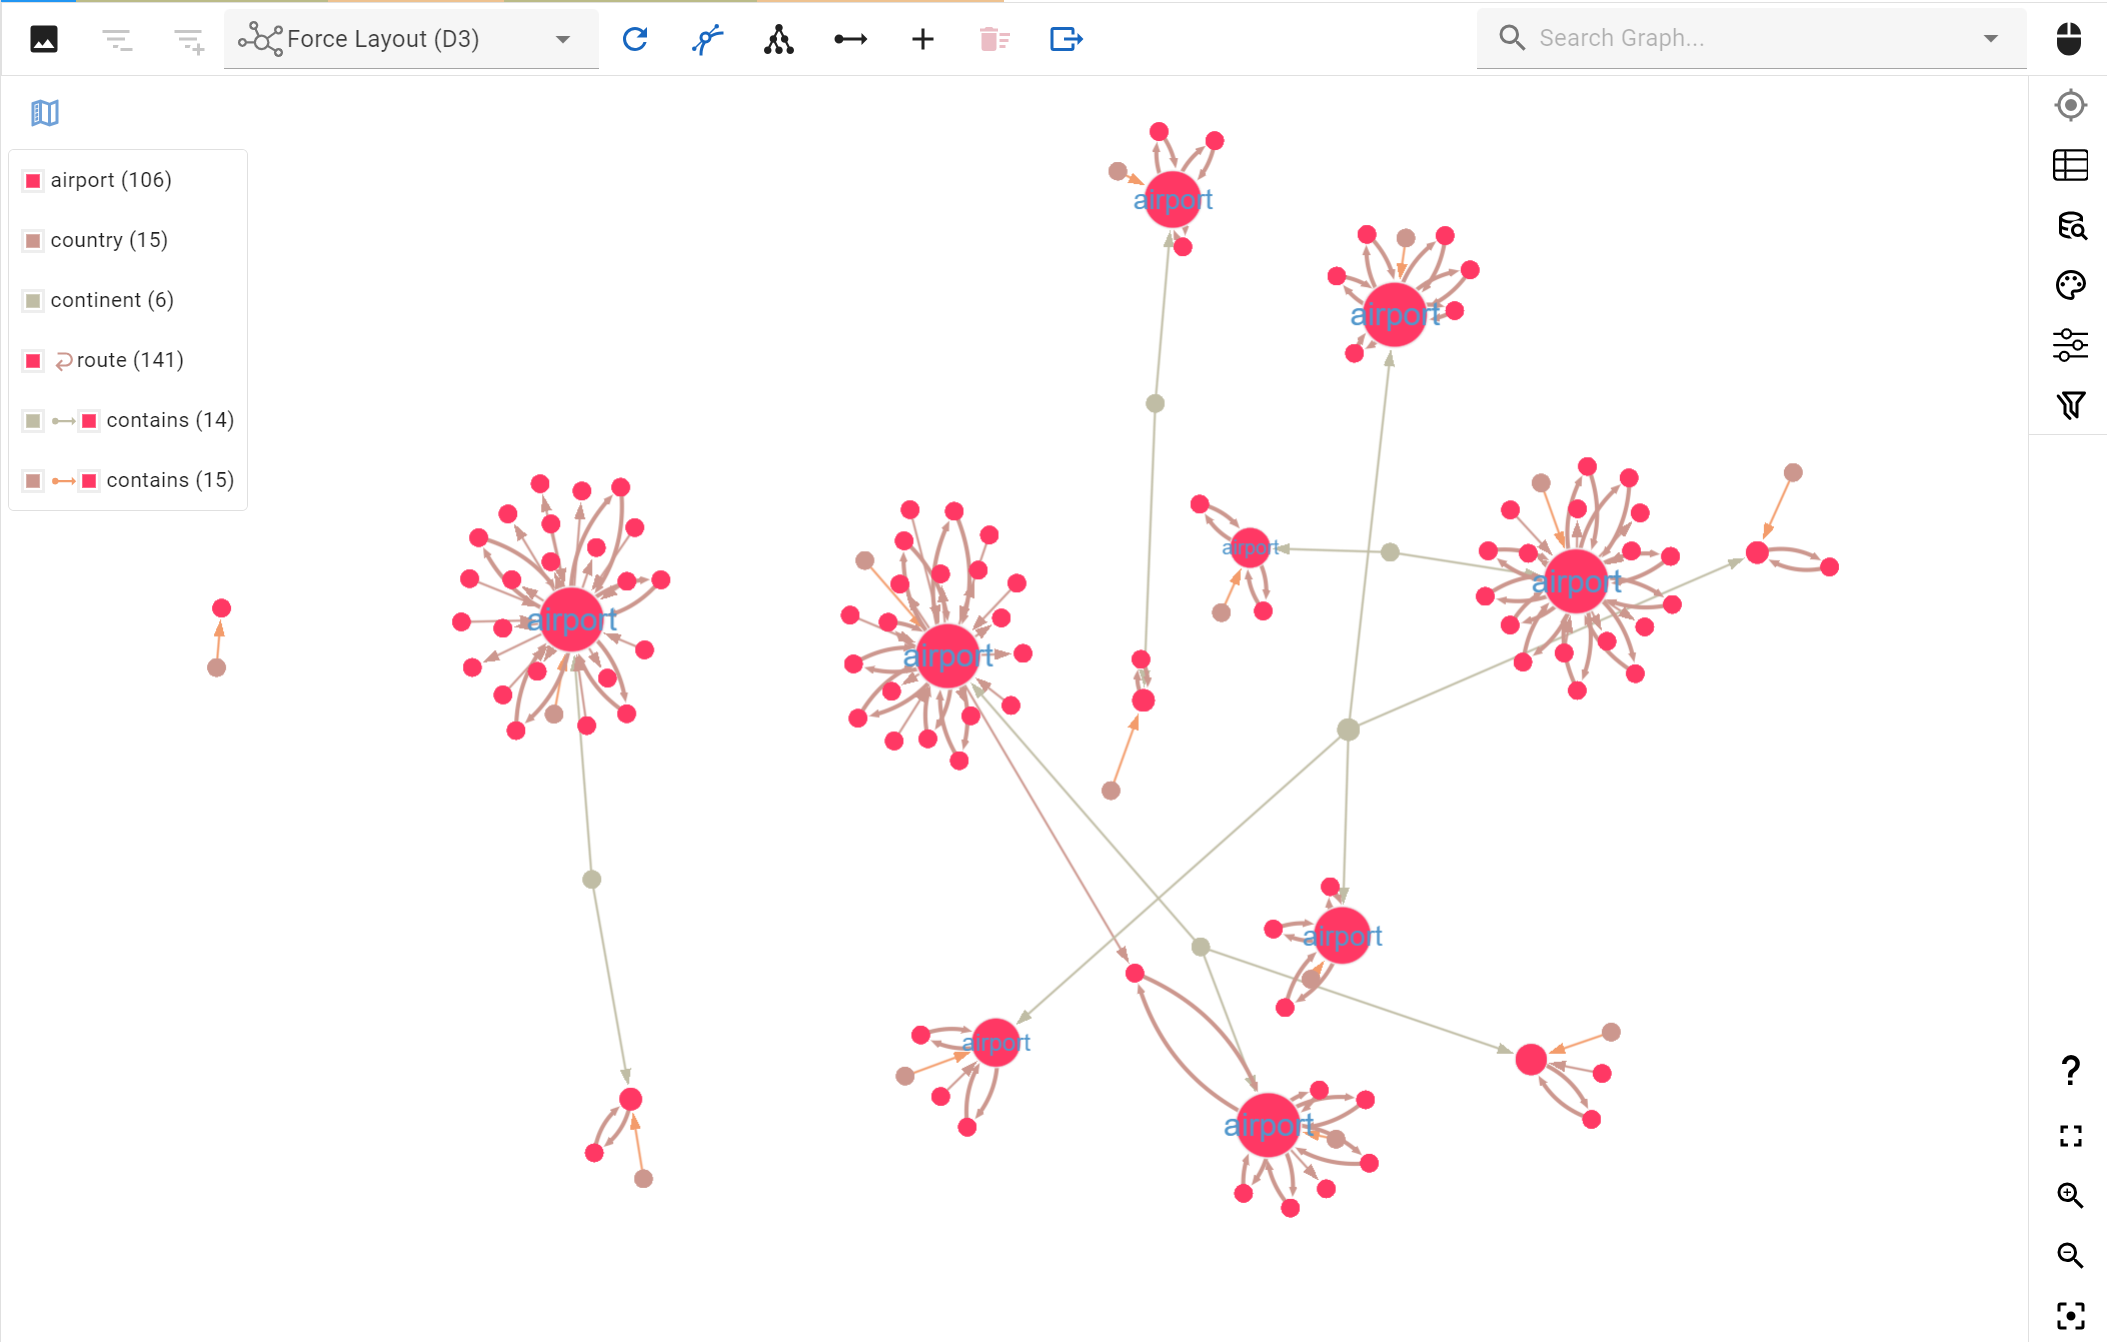
We’ve taken the opportunity with upgrading to SigmaJS v3 to also review the rendering of element labels to give them a crisper look and feel. Most important however is that with this new release, SigmaJS finally supports the drawing of curved edges. This may seem like a small change but it is extremely useful for graphs that contain many bidirectional relationships, as these were previously difficult to tell apart visually in G.V(), as shown in the comparison below:

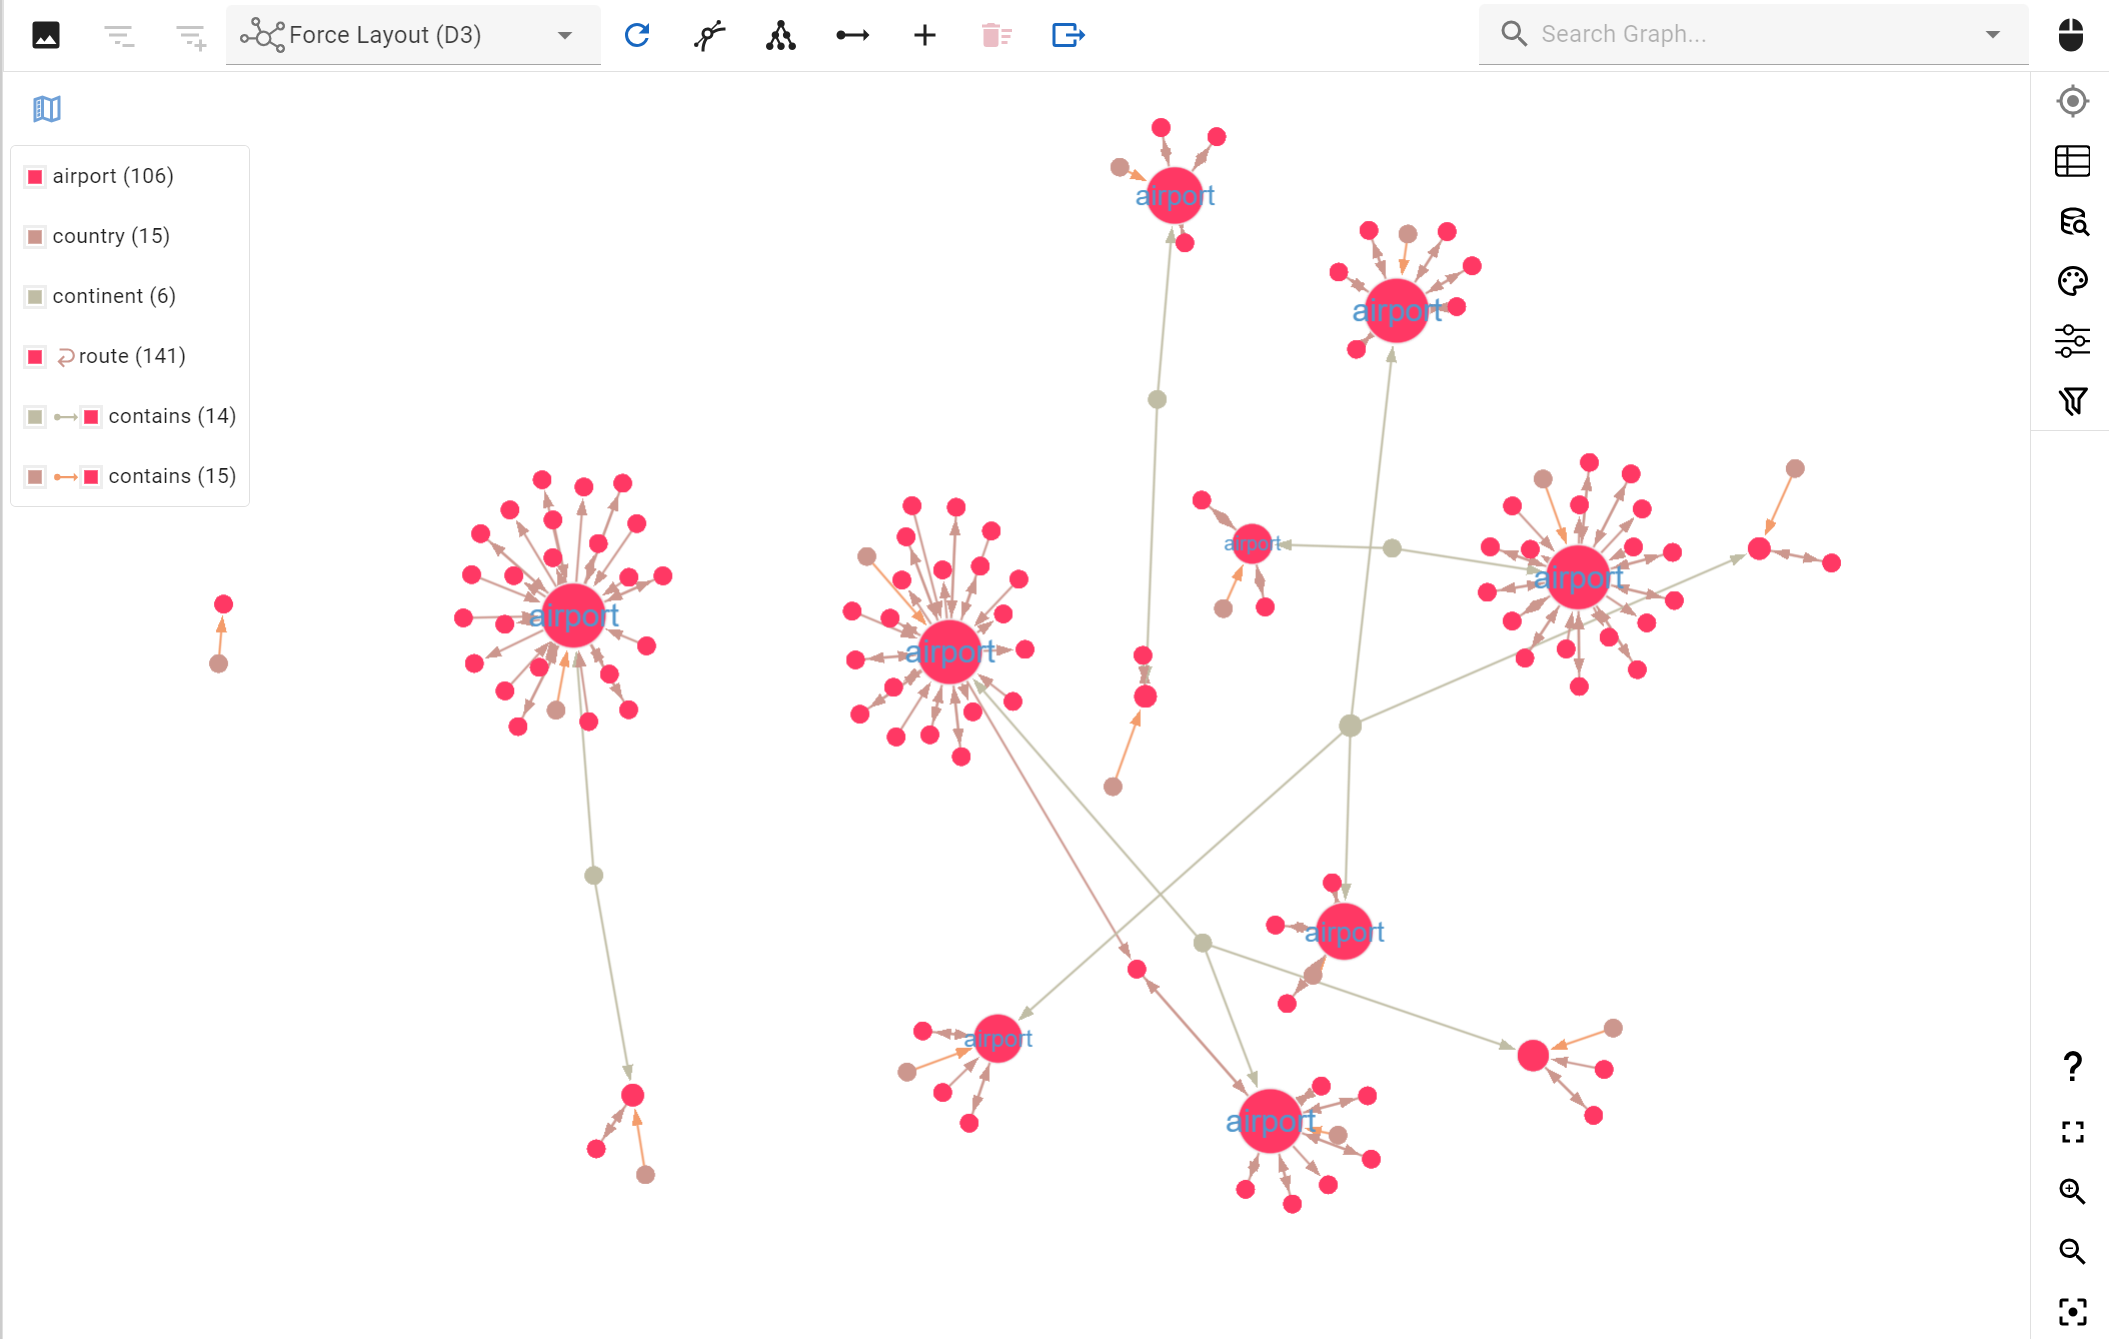
With this new capability it’s now much easier to understand relationships in complex, highly interconnected graphs.
This is our first big project with the SigmaJS team and we’re hoping to bring more in the future, so stay tuned!
What’s next for G.V()?
We’re working on a few big projects behind the scenes but it’s too early yet for us to share more details. In the meantime you can expect to continue seeing regular updates to our product with a focus on user experience and performance. If you have any thoughts of your own on what you’d like to see next in G.V(), make sure to let us know by emailing us at support@gdotv.com. Our goal is to provide the best graph database tooling possible and there’s no better way to achieve this than by listening to what our users want and need from our product – your feedback is what drives our roadmap.
