The Weekly Edge: Graphs in Microsoft Fabric, Data Day Texas, EdTech & More [19 September 2025]
![The Weekly Edge: Graphs in Microsoft Fabric, Data Day Texas, EdTech & More [19 September 2025]](https://gdotv.com/wp-content/uploads/2025/09/microsoft-fabric-data-day-texas-edtech-weekly-edge-19-september-2025.png "The Weekly Edge: Graphs in Microsoft Fabric, Data Day Texas, EdTech & More [19 September 2025]")
Another week, another edge to connect you to everything worth knowing in the graph tech space.
Think of the Weekly Edge as your tl;dr of news, haps, reads, and resources for the world of graph technology from the past seven days (or so), all curated by yours truly and the team at gdotv.
Here are this week’s headlines in brief:
- Don’t miss Graph Weekend at Data Day Texas
- Microsoft Fabric just dropped Graphs in Fabric (and more)
- How knowledge graphs help AI agents with probabilistic reasoning
- The story of how eLumen uses G.V() to help their dev team productivity
- A developer’s guide to graph algorithms
- Meet Atlas: a new network infrastructure visualizer
Now, let’s dive into the deets.
IRL: See You at Data Day Texas!
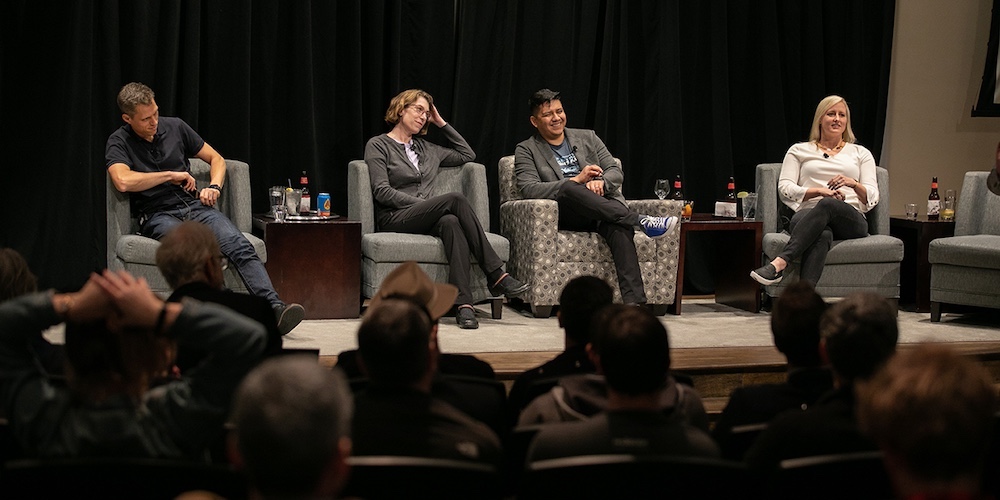
If the data industry had a Met Gala, would it be Data Day Texas? It just might be. But instead of tuxes and gowns, it’s tables and graphs, and just like the Met Gala, it’s all about who’s attending and which data designer is dressing them (okay, maybe not that last part).
This year, the Data Day Texas team – led by Lynn Bender – is adding a special twist to the long-time tech conference: Graph Weekend, a co-located event with graph tech talks all day Saturday, 24 January and a day of open discussions with the speakers on Sunday, 25 January.
And the best part? Our founder, Arthur Bigeard, will be there to present, chat, and hear from you! No autographs for now, please. 😅
Who else is speaking at this year’s Data Day Texas? Here’s a quick sampler:
- Jessica Talisman: Librarian of All Knowledge, ex-Adobe, now indy
- Joshua Shinavier: a primordial being of the graph database domain (Hail Hydra!)
- Juan Sequeda: co-host of Catalog & Cocktails, a no-bs podcast for data people
- Vaibhav Gupta: of BAML fame (“It’s that BAML, so hot right now!”)
- Dr. Claire Sullivan: data scientist and GraphRAG extraordinaire
- Sanjeev Mohan: the author of the Tome, Principal of SanjMo
- David Hughes: semantic agent whisperer, unconfirmed Istar, graph vet, etc.
- Prashanth Rao: wandering graph polymath and AI engineer at Kuzu
(And full disclosure: gdotv is a Community Partner of the event, so come chat us up if you’ll be there!)
News: Microsoft Fabric Goes Graph

Big news out of Microsoft this week at FabCon Europe: Microsoft Fabric is making a major leap forward with Graph in Fabric, a low/no-code platform for modeling and analyzing relationships across your enterprise data. The Microsoft team also announced an expansion of Fabric’s capabilities with a new graph database that connects entities across OneLake, along with a slew of other new Fabric features and improvements.
Prathy Kamasani shared a video from the FabCon announcement keynote that gives you a taste of what’s possible with Graphs in Fabric. My take: A whole lot of folks who’ve never touched a graph database before are about to start using – and thinking in – graphs as part of their regular workday.
Fabric Graph can be queried using ISO GQL – a language that’s we’re just about to introduce support for on G.V()!
Article: Knowledge Graphs for Probability-Based Decision Making
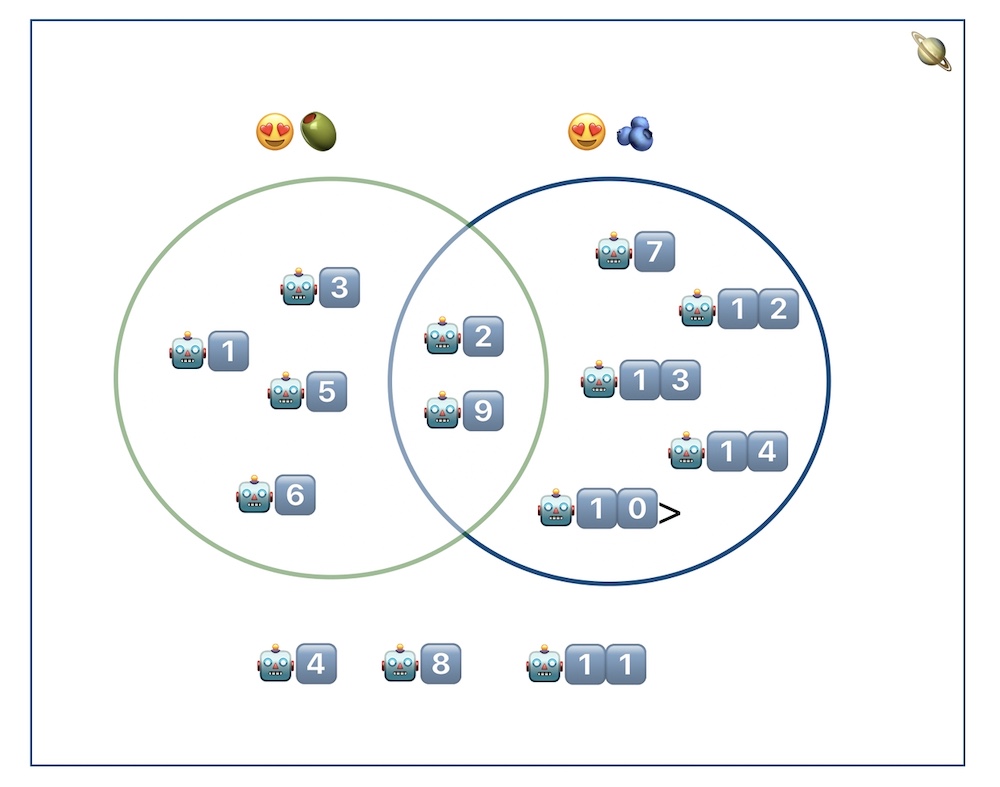
Back in my day, agents were the bad guys trying to stop you in The Matrix, but these days AI agents are the cool ones (apparently). So what happens when you need your AI agents to make decisions under uncertainty? When grounded logic isn’t available, sometimes an AI agent needs to make decisions based on probability instead. The secret weapon to help them do that? Knowledge graphs, argues Arkadiusz Chadzynski at Graphwise.
In this demo article, Chadzynski argues that knowledge graphs aren’t just for helping agents via logical decision making but also via probabilistic decision making. What follows is an Alice in Wonderland-style adventure through the world of knowledge graphs – that doubles as a SPARQL 101 tutorial – complete with code samples, a fever dream of emojis, whimsical storytelling, and a solid case for KGs in probability-based decisions for AI agents. This White Rabbit of an article is worth following down the rabbit hole.
Case Study: eLumen Uses G.V() to deliver first class DX on Amazon Neptune
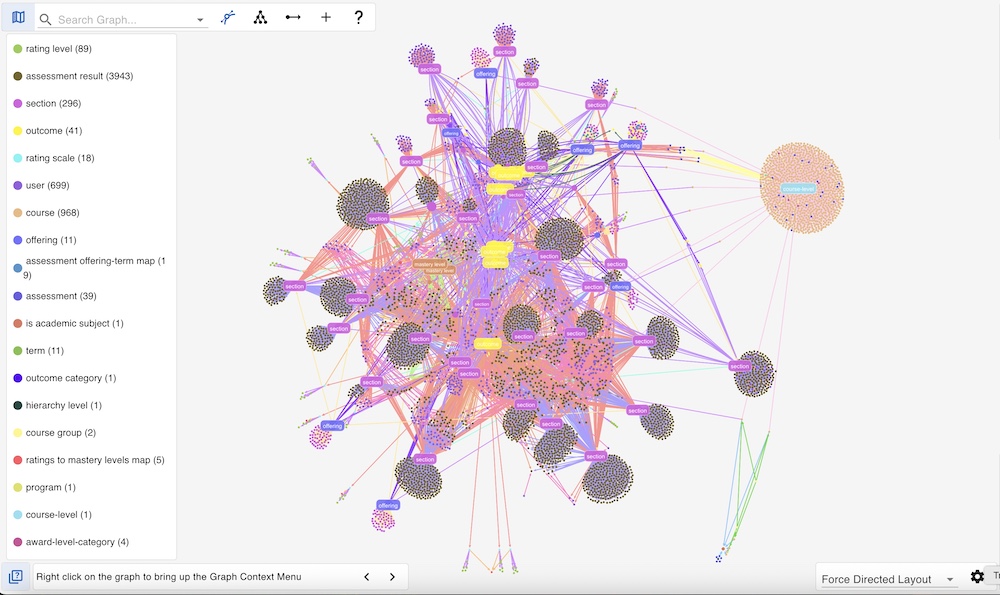
We try to not talk too often about gdotv in the Weekly Edge, but this entry is an exception because we want to show off the incredible projects that one of our customers has been working on. eLumen has been a G.V() customer since 2023, and they’re doing some amazing work in the EdTech space using graph technology, specifically with Amazon Neptune.
Of course, like many dev teams, eLumen found Apache TinkerPop™ and the Gremlin query language had a high barrier to entry for their developers unfamiliar with graph computing. Using G.V() helped their new team members get up to speed quickly with existing traversals, visualize the problem domain, and drastically reduce ramp up time. Catch the rest of the eLumen + G.V() story in our first-ever customer case study.
Would you like to share your G.V() success story to the world? Hit us up at feedback@gdotv.com!
Developer’s Guide: Graph Algorithms
Do you ever forget the difference between Depth-First vs. Breadth-First Search? Or do you ever confuse Betweenness and Eigenvector Centrality? Maybe you criss-cross Ford-Fulkerson with Edmond-Karp algorithms for network flow? I swear, it happens to me *all the time*.
This past week, our friends at PuppyGraph published this great developer’s guide to graph algorithms. It’s a comprehensive, high-level survey of all the major types of graph algorithms and their most common use cases in graph analytics, including traversal, connectivity, shortest paths, network flow, centrality, community detection, graph embeddings, and more. Also worth noting: PuppyGraph CEO Weimo Liu will also be speaking at Data Day Texas!)
Atlas: A Go-Powered Network Infrastructure Visualizer
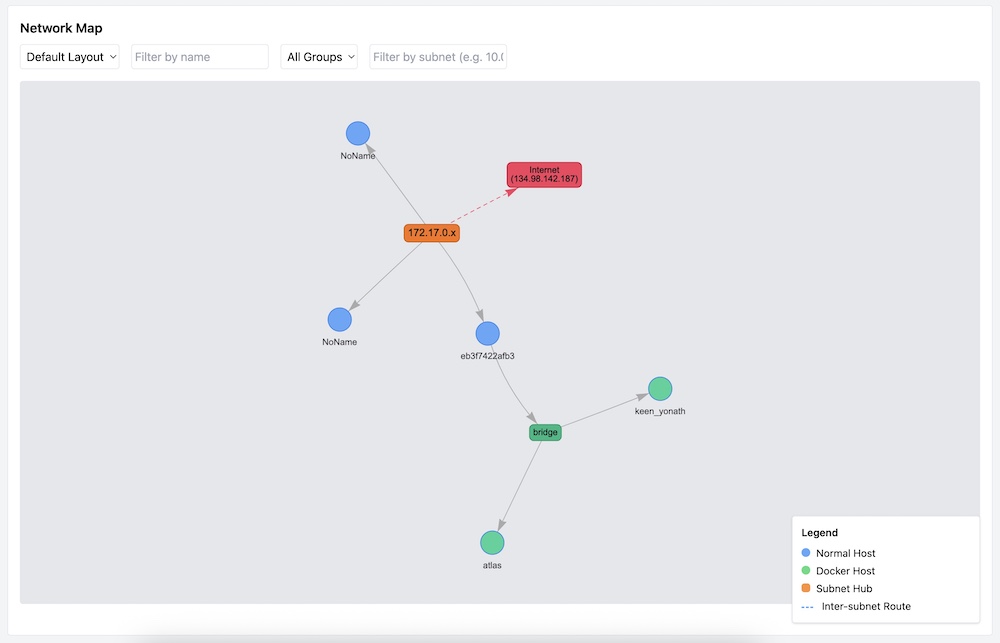
At gdotv, we’re big fans of graph visualization, and Atlas is a perfect tool in your toolbox to scan, analyze, and visualize your network infrastructure in a dynamic way. Authored by Karam Ajaj, Atlas is built with Go, FastAPI, NGINX, and a custom React frontend.
Whether you’re a dedicated sysadmin or you just need to keep an eye on your network ops, Atlas is worth taking for a spin.
P.S. My colleague Amber just published a superb write-up and demo on Cognee that you should also check out!
That’s it for this week’s edition. Got something you want to nominate for inclusion in a future edition of the Weekly Edge? Ping us on on X | Bluesky | LinkedIn or email weeklyedge@gdotv.com.

