
The Weekly Edge: Hyper/Knowledge Graphs, Advanced Neo4j Spatial, Hot Takes from Texas, & More [30 January 2026]
![The Weekly Edge: Hyper/Knowledge Graphs, Advanced Neo4j Spatial, Hot Takes from Texas, & More [30 January 2026]](https://gdotv.com/wp-content/uploads/2026/01/data-day-texas-neptune-analytics-neo4j-spatial-weekly-edge-30-january-2026.png "The Weekly Edge: Hyper/Knowledge Graphs, Advanced Neo4j Spatial, Hot Takes from Texas, & More [30 January 2026]")
Another week, another edge: It’s time for your favourite graph tech news digest!
The Weekly Edge is your regular roundup of everything happening in the world of graph technology within the past week (or so), curated for you by the team at G.V().
Here’s a glance at this week’s headlines:
- 🤠🔥: Explore all the hot takes from Data Day Texas
- 🪐☁️: Amazon Neptune Analytics expands to new (cloud) regions
- 🧠📚: Industry vet Mike Dillinger talks knowledge graphs, hypergraphs, and more
- 💪🏽🌐: An advanced plugin for spatial data in Neo4j just dropped
- 🌞🧑🏽💻: Sustainable infra company maps its portfolio with graphs; success follows
Now, let’s dive in.
/*
 * It’s time to level up your graph game:
 * Query, explore, edit, and visualize your connected data with the G.V() graph IDE
 * Try out the free dev tier or upgrade to a 1-month, no-fuss free trial.
 */
[FOMO:] All the Hot Takes from Data Day Texas
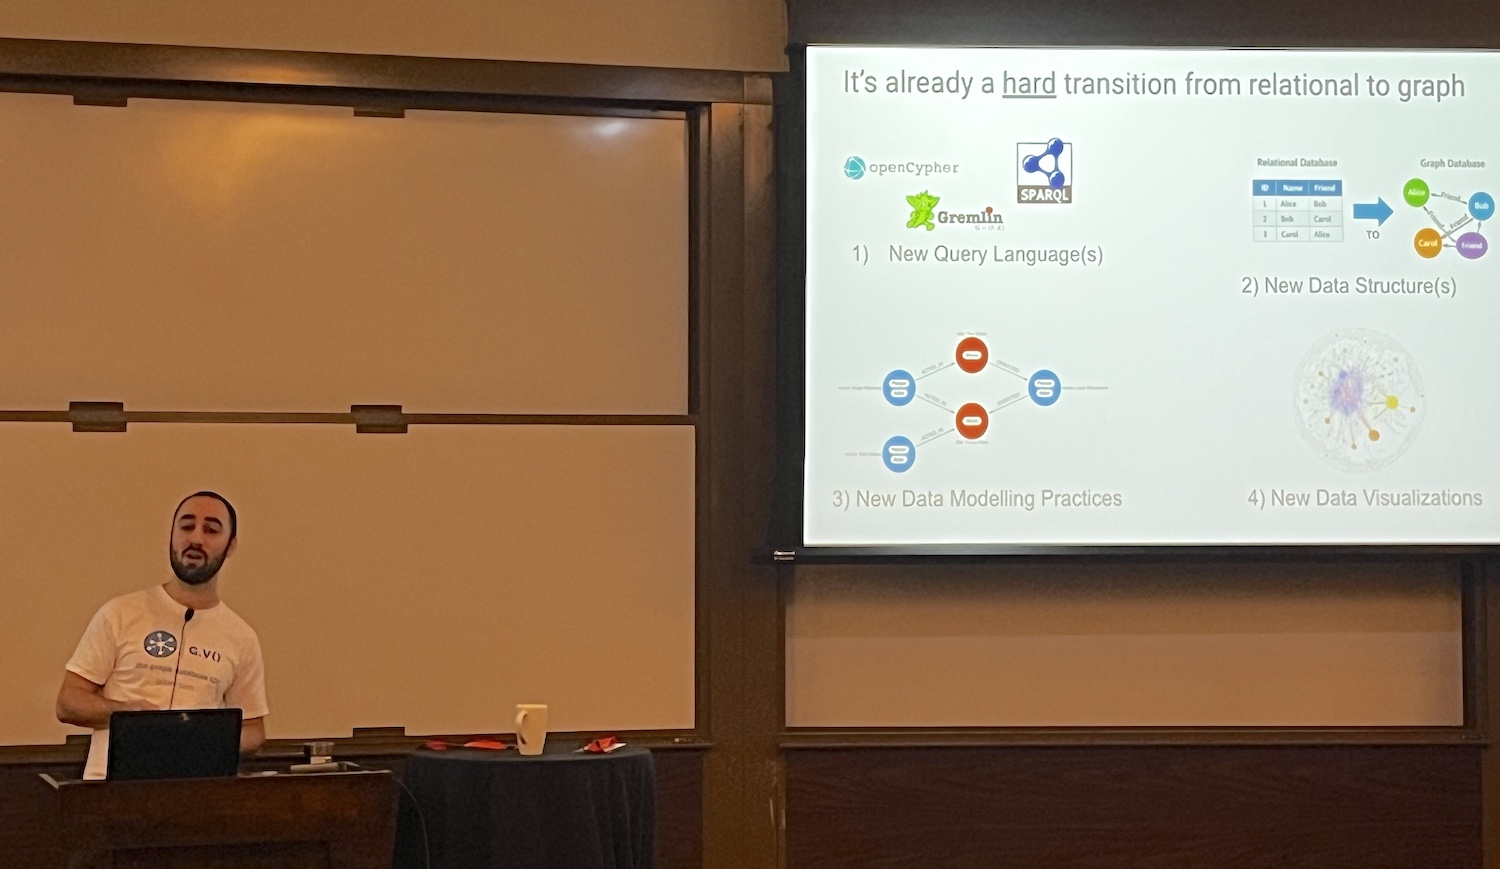
For those of you who couldn’t make it to the Final Edition of Data Day Texas on January 24-25th, don’t worry, we have all the hot takes, reflections, and more right here:
- Lena Hall, DevRel at Akamai
- G.V() Supreme Leader, Arthur Bigeard
- Dr. Clair Sullivan, Indy & OG Graph Data Scientist
- Head of IT at Cloudflare, Joey Jablonski
- Christian Miles, Graph Viz Expert/Extraordinaire at G.V()
But the hot take that takes the cake is Juan Sequeda’s series of posts breaking down his “20 Lessons from 20 Years of Building Ontologies and Knowledge Graphs” where he shares a new lesson each day from his talk from the conference. If you’ve got a bad case of Final Edition FOMO, this series will cure you, body and soul.
We’ll be sharing more of the G.V() team’s reflections on Data Day Texas in a longer post coming soon. For all those who are still stuck in Austin because of the bad weather: Our hearts go out to you! 🙏🥶
[News:] Amazon Neptune Analytics Is Now Available in 7 Additional Regions
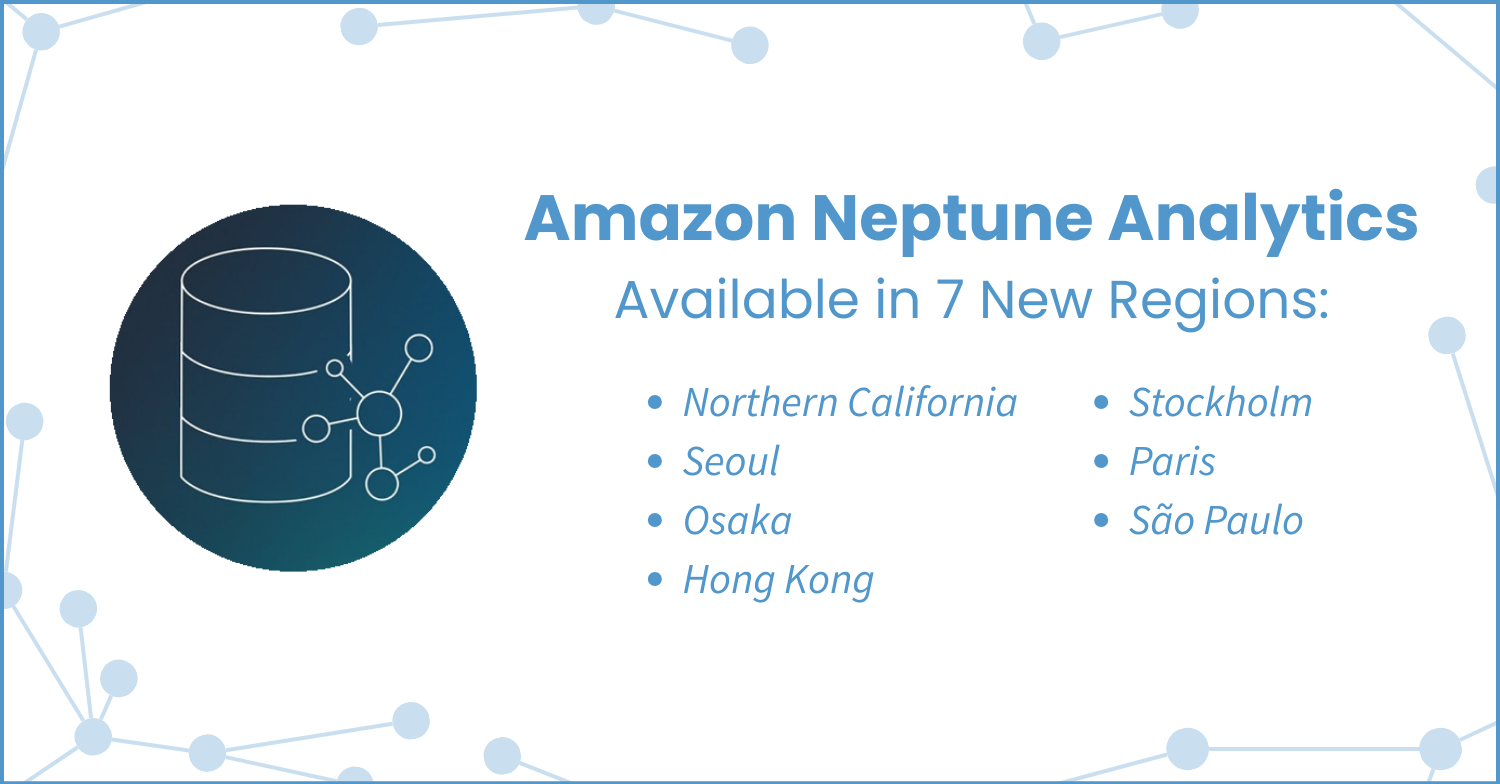
Good news for teams who use Amazon Neptune Analytics: You can now use Neptune Analytics in more AWS regions!
The seven new regions now available to Neptune Analytics users include:
- U.S. West (Northern California)
- Asia Pacific (Seoul)
- Asia Pacific (Osaka)
- Asia Pacific (Hong Kong)
- Europe (Stockholm)
- Europe (Paris)
- South America (São Paulo)
Users can now create and manage Neptune Analytics graphs in these new regions and run advanced graph analytics – and you can use G.V() to help you query, explore, and visualize the results!
/* */
[Watch/Listen:] Mike Dillinger on Knowledge Graphs, Hypergraphs, Ontologies, & More in 2026
If you haven’t heard of Mike Dillinger, then I’m required to ask if you’ve ever worked with knowledge graphs before. He’s a veteran Silicon Valley technologist with notable tenures at LinkedIn, Intel Labs, eBay, and more. With a background as a linguist and a PhD in cognitive science, he’s got a keen understanding of the original knowledge graph: the human brain. These days, he’s the Founder & Chief Scientist at hypergraf.
For this week’s watch, Mike spoke with Alan Morrison at the GraphRAG Curator podcast about everything from hypergraphs and knowledge graphs to FAIR data and tapping into the existing semantic workforce—including why expert taxonomists and ontologists are critical to AI’s success with knowledge graphs. It’s a long but interesting chat that leaves no node unconnected.
[Repo:] gspatial: An Advanced Neo4j Spatial Plugin
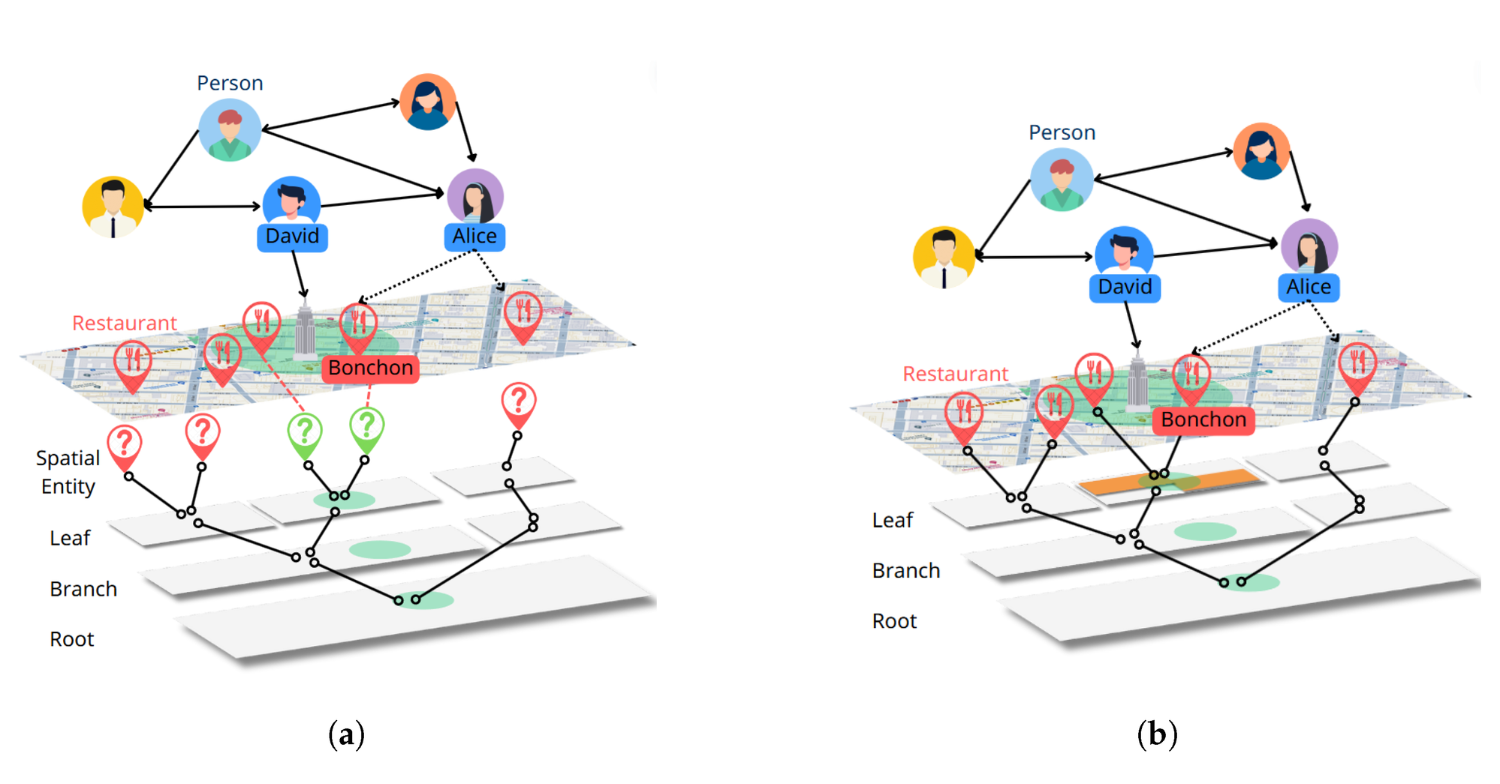
If you’re working with spatial data in graph databases, Juyoung Kim (and team) have got something special for you: neo4j-gspatial.
gspatial is a plugin for Neo4j that implements the SGIR-Tree (Subgraph Integrated R-Tree) structure for efficient spatial data handling in graphs. Unlike existing Neo4j spatial plugins that only support operations between whole-layer node sets and specified node sets and their disconnected index approach, gspatial is specifically designed for offering improved spatial operation and query processing through direct integration with the graph structure.
This project is the official implementation of the paper by Kim’s team, “SGIR-Tree: Integrating R-Tree Spatial Indexing as Subgraphs in Graph Database Management Systems,” published back in 2024. Although the research was completed a while ago, the code was just released on GitHub earlier this week.
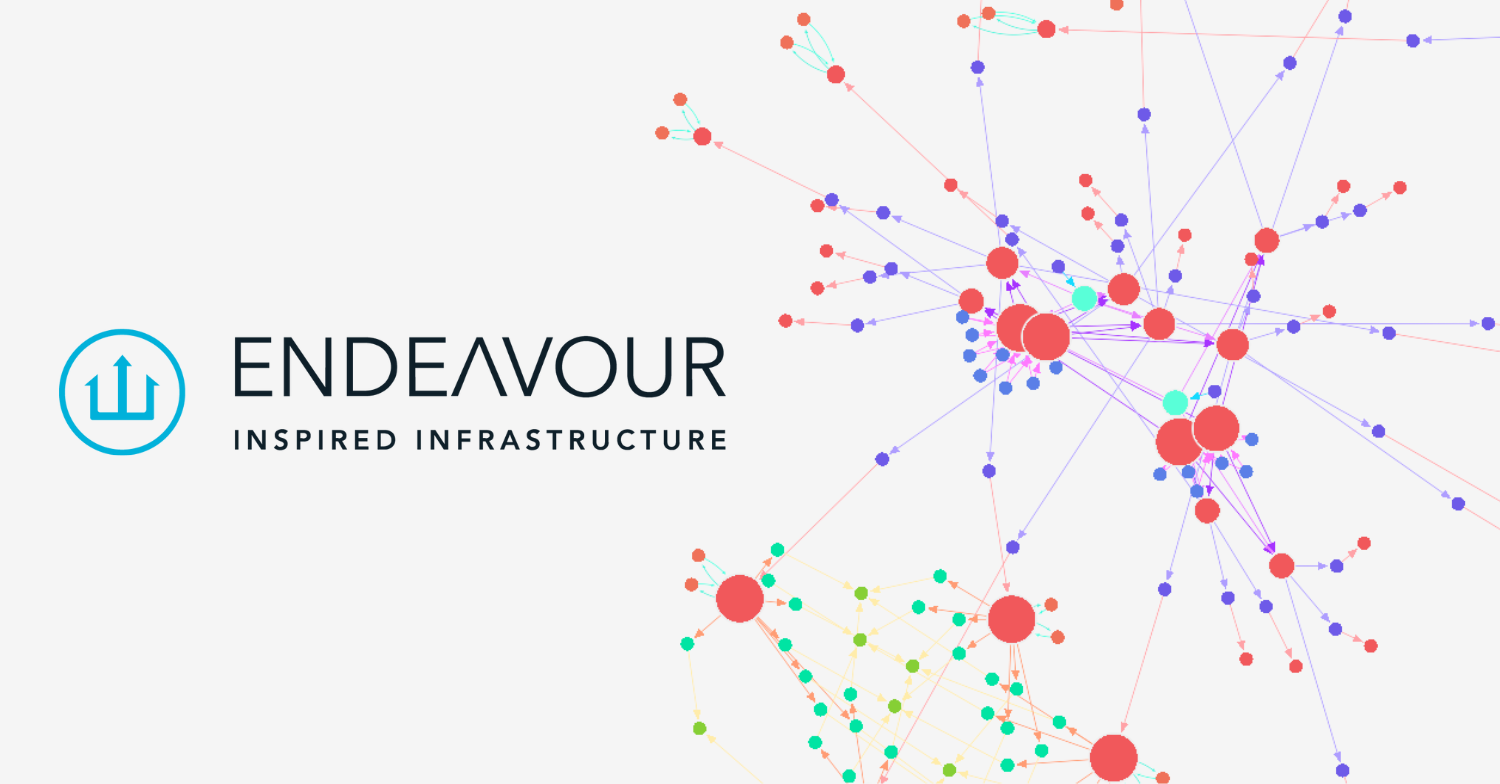
[Case Study:] Endeavour Harnesses G.V() to Map & Manage Their Sustainable Infrastructure
We don’t normally talk too much about ourselves in the Weekly Edge, but when we do, it’s to show off the amazing work G.V() customers are doing.
Back in 2020, the Endeavour team faced an enormous task: build an intelligence platform to help more effectively manage the company’s vast infrastructure portfolio and data centers. But it was challenging to visualize their graph data model in Azure Cosmos DB – let alone communicate that context with other stakeholders.
Using G.V(), the Endeavour team could more efficiently update their data center digital twin, trace complex customer usage, and share graph visualizations with partners and customers.
P.S. Don’t miss out on Jason Koo’s Byte-Sized Cypher video series teaching beginners all about the Cypher graph query language!
P.P.S. Got an item to nominate for the next edition of the Weekly Edge? Hit us up at weeklyedge@gdotv.com.
![Evaluating Codebase-Oriented RAG through Knowledge Graph Analysis [Part 2]](https://gdotv.com/wp-content/uploads/2026/03/knowledge-graph-analysis-codebase-oriented-rag-part-2.jpg "Evaluating Codebase-Oriented RAG through Knowledge Graph Analysis [Part 2]")
![Announcing SPARQL Query Guardrails, Dashboarding, Query Editor Upgrades, & More [v3.53.111 Release Notes]](https://gdotv.com/wp-content/uploads/2026/03/rdf-sparql-query-guardrails-interactive-graph-dashboarding-gdotv-release.jpg "Announcing SPARQL Query Guardrails, Dashboarding, Query Editor Upgrades, & More [v3.53.111 Release Notes]")
![Cypher SET: Updating Node Properties in Your Graph Database [Byte-Sized Cypher Series]](https://gdotv.com/wp-content/uploads/2026/03/set-clause-byte-sized-cypher-query-langauge-video-series.jpg "Cypher SET: Updating Node Properties in Your Graph Database [Byte-Sized Cypher Series]")