G.V() 2.1.2 Release Showcase

Today I’m very proud to announce the release, at long last, of G.V() 2.1.2. This is our most important update yet, and is full of essential improvements and changes to take our software to the next level.
Major version change and major performance improvements
User Experience Improvements
First and foremost, if you’ve been using G.V() on a macOS or Linux based device, you’ll have likely found the auto update experience clunky at best. We have finally resolved this issue and all users across all operating systems will now receive the same one-click auto update experience, which we’re hoping will help you adopt newer (and as always, better) versions of G.V() more easily.
We’ve also reworked the layout and resizing features of the application, and whilst this may not be immediately visible to the eye, resizing of the Gremlin Query Assistant or Query Output is now much faster and much better looking.
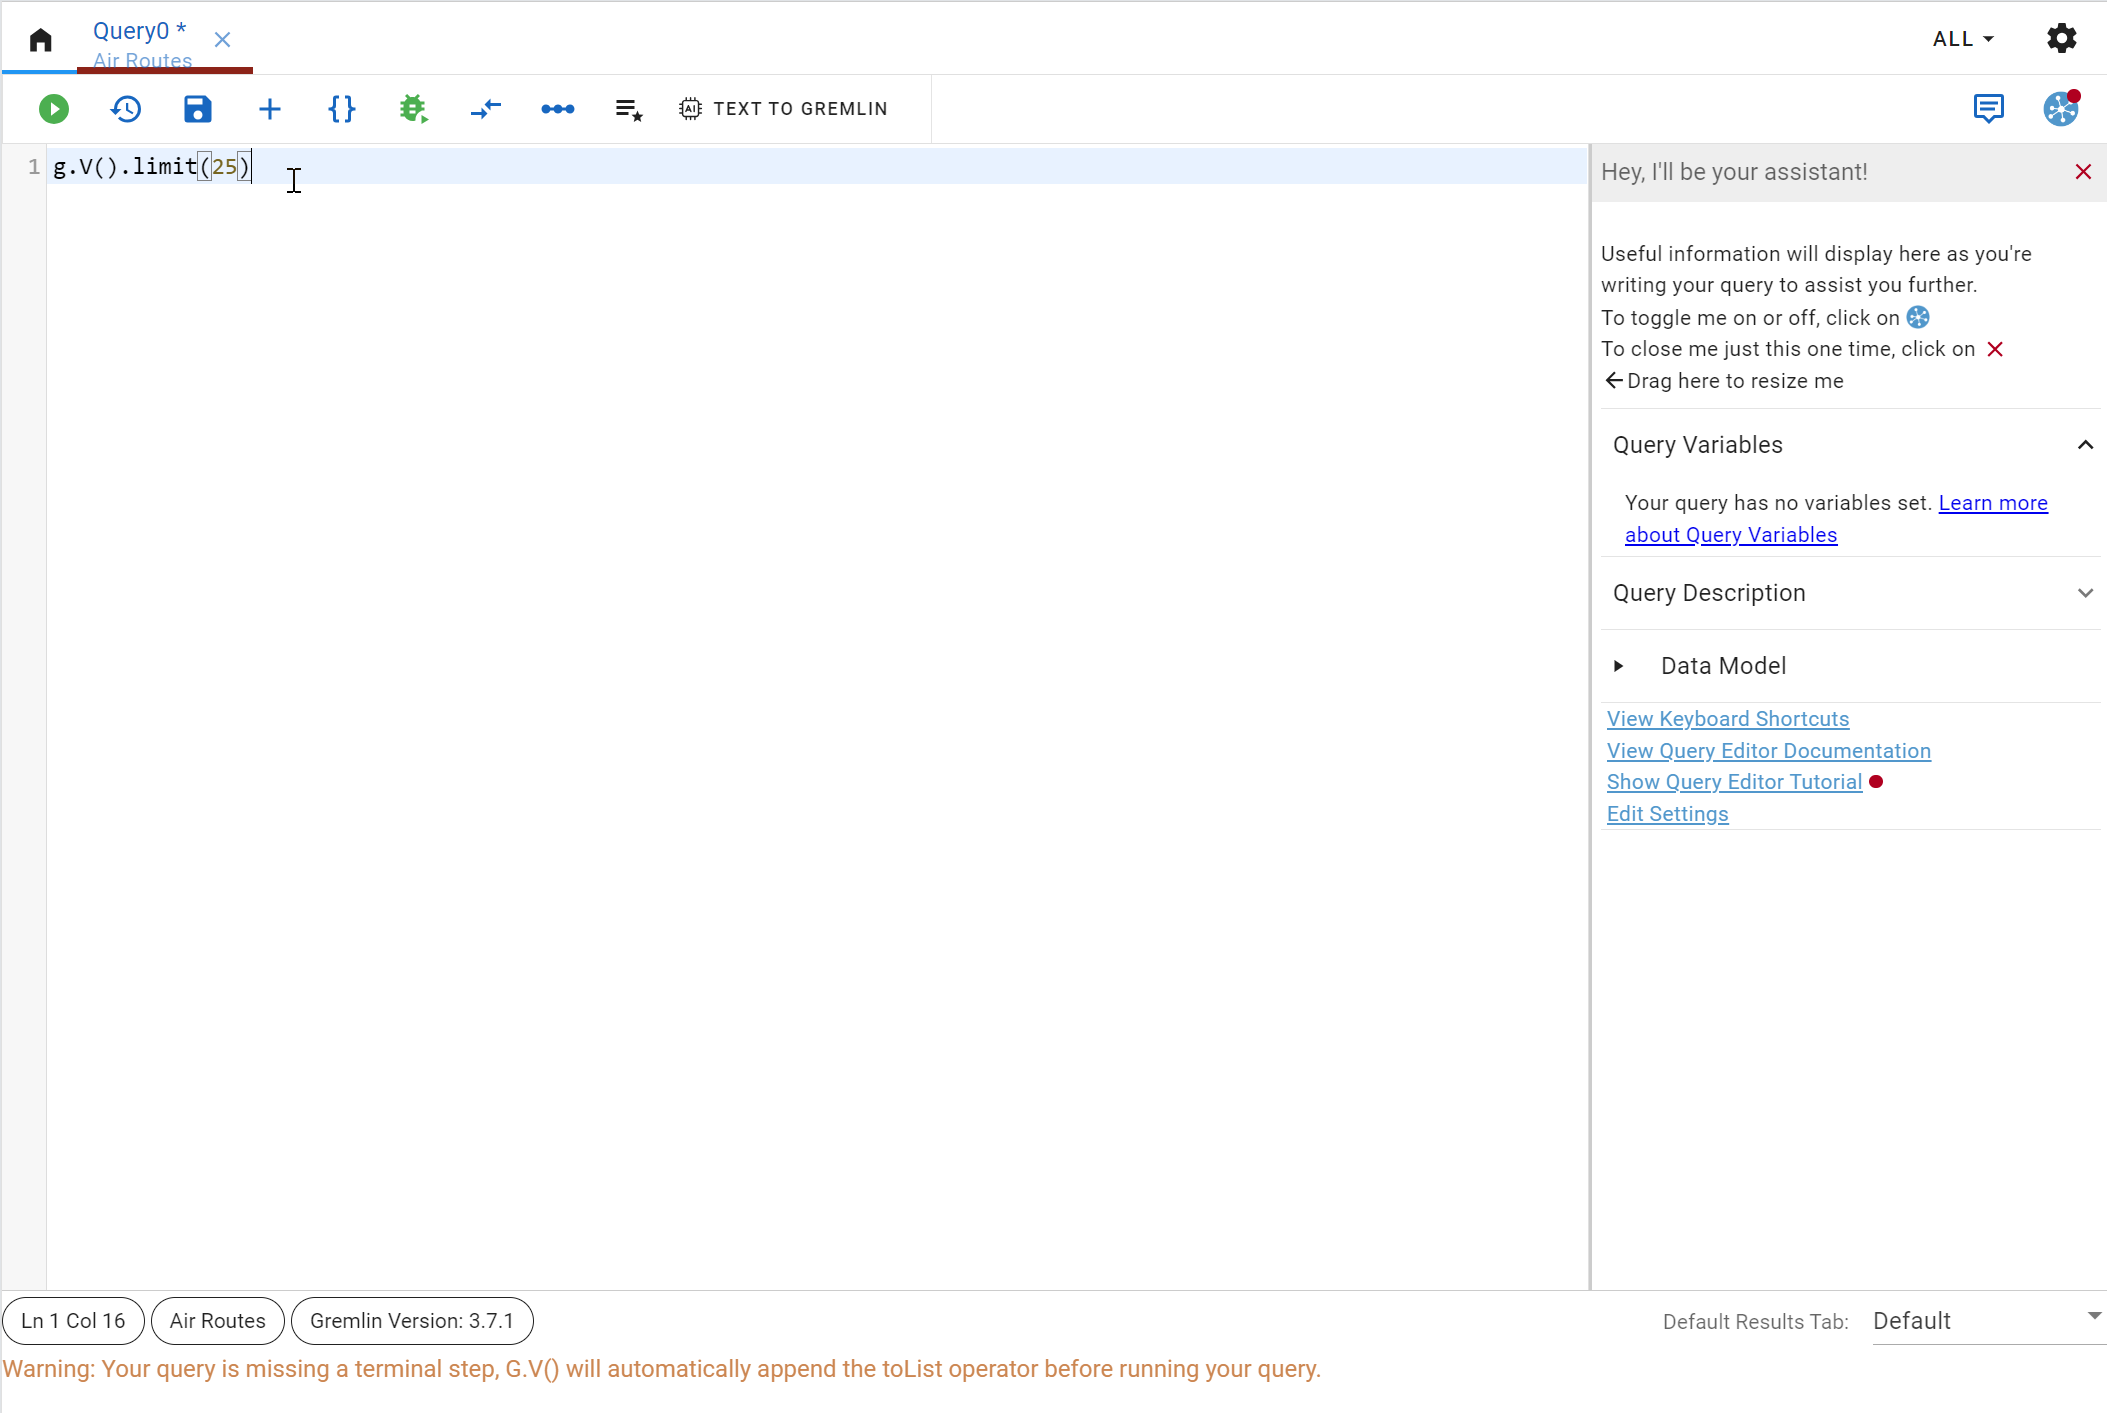
Finally, we’ve improved the handling of presenting Query results such that when running consecutive queries, the Query Output will now automatically update itself without closing then re-opening, as shown below:

Exposing G.V() Playgrounds over localhost
When we sunset our free G.V() Basic tier in favor of G.V() Lite, one valid concern that our user base expressed was losing the ability to use G.V() for local development against a Gremlin Server, for instance.
To respond to those concerns, we’ve now made our in-memory graph, G.V() Playground, optionally available to connect to a configured port on localhost. Currently this feature is limited to wrapping G.V() Playground with a Gremlin Server, though we will be investigating other embedded server technologies, such as JanusGraph.
This means that from this release, you can use G.V() to quickly stand up and manage Gremlin Servers as well as query them directly from your development environment, for instance.
What’s next for G.V()?
Parallel to this 2.0 rewrite, we’ve been busy planning for our upcoming work for the year. Last year, we’d commissioned a number of improvements to SigmaJS, the WebGL based graph visualization framework that you’ll recognize as the “Graph (Advanced)” view in the Query Output, as well as our Graph Data Explorer. SigmaJS is a high-performance, open source library developed by OuestWare, a fantastic data analysis solutions company responsible for plenty open source gems built around SigmaJS, and many more.
The 3.0 release of SigmaJS is coming soon and will be integrated in G.V() in the near future. This release focuses on performance improvements allowing rendering of more complex graphs, as well as a few cosmetic improvements such as the availability of curved edges, at long last!


