Case study: Faster, cheaper and safer aircraft configuration validation with graph visualization
Digital Product Manager
Aircraft manufacturer
We’ve taken our most complex release process from 3 to 4 weeks down to 2 days. gdotv has been really helpful for the team to understand the behavior of the graph. On the project side, it helps us reduce development lead time so we can increase our release rate. It absolutely contributes to our success.
Designing and manufacturing aircraft means managing thousands of interconnected decisions: parts, configurations, dependencies, customer requirements, tests and software rules, and every one of them carries a safety and compliance consequence. This manufacturer turned to graph technology to model that complexity and built a graph-native validation system that sets them apart in their industry. To develop, debug and trust that system, they needed the right visualization layer, and they found it in gdotv.
The Company
The company is a digital-native manufacturer that designs and builds a new generation of aircraft at the crossroads of industrial excellence, digital technology and decarbonization. It develops fast, modular and competitive aircraft for both civil and military customers.
The Graph Use Case
Digital planning, product design and an aircraft’s software have always been closely intertwined here. The digital team collects and analyzes all of the data from the company’s test aircraft, and their work feeds directly into pilot training and into building the craft itself.
What makes their challenge distinctive is the company’s mass-customization strategy: customers can choose from a considerably wider array of configuration options for their aircraft than is standard in the industry. That flexibility is a real competitive advantage, but aircraft configuration management is highly regulated and safety-critical, so every combination a customer chooses must be proven safe to fly. Validating that, the traditional way, can take weeks.
This is a problem of highly connected, constantly evolving data that needs to be explored from every angle. To solve it, the team turned to graph technology. Since January 2023, the Amazon Neptune graph database has been central to the digital team’s projects, with 10 different graph databases deployed across development, QA, integration and production.
The company’s Digital Product Manager leads the digital team and explains why graphs fit the problem so well:
“The graph data model doesn’t constrain our data into tables like the SQL format does, and graph databases outperform relational databases for analysis across large volumes of connected data. In a relational database, you need to optimize every query path you think you’ll need from start to finish, but with a graph database, you can look at the data from lots of different entry points without changing performance,” they said.
The team runs two primary graph use cases. The first is an enterprise data platform with a highly dynamic, flexible structure that covers everything from the purchase order to the location of each part of the aircraft, and evolves in near-real time so customers always have accurate information. The second, and the one where the graph strategy has had the greatest effect, is the testing and configuration of the aircraft: a highly structured, constrained model where dependencies and conflicts are critical.
On top of that model, the team built something genuinely novel. Their graph delivers custom decision trees for part selection: as a customer “builds” their aircraft, each choice shapes which parts and configurations remain compatible downstream, against numerous industrial parameters. The graph effectively operates as a digital twin and simulation system, guiding customers through their customization in real time and providing the must-have configuration assessment before any aircraft is manufactured.
“For each aircraft, we create a configuration and define our rules in the graph model. We start with one configuration, and then a customer might want a different engine option, for example, and that creates a new layer in the graph with dependencies. Over time, we have a graph database with multiple dimensions and a lot of layers, including both dependencies and conflicts, but mapping it out helps us choose a configuration that will ultimately work for the customer,” said the Digital Product Manager.
The payoff is best-in-class quality control for validating manufacturing and operating conditions, achieved through a smart, focused evaluation rather than brute-forcing every possible interaction between parts and configurations. The result: the team validates the interactions across a configuration in under one minute, fully automated, a task that used to take hours and still takes weeks at other major aircraft manufacturers. That single optimization drives down both configuration-management cost and time-to-decision.
“Validating a configuration used to be hours of work, and elsewhere in our industry it can take weeks. We’ve brought it down to under a minute, automatically, and that’s only possible because we can actually see and trust what the graph is doing,” they said.
The Challenge
The team understood the power of graph technology and had a clear strategy for it. What they were missing was a way to see what they had built.
“We were writing all of our queries in the dark, so to speak. We had to try to understand the data model without any visualization or any way to validate our data,” said the Digital Product Manager.
That gap mattered far more here than it would in most projects, because this is a safety-critical system. A configuration that is wrong cannot be allowed to reach a manufactured aircraft, which means the graph’s output has to be correct every single time. As the configuration model grew into many layers and dimensions, with dependencies and conflicts compounding each other, validating that correctness by hand became increasingly difficult, slow and error-prone.
The real bottleneck, in other words, was never building the graph. The team knew how to do that. The bottleneck was trusting it: quality-controlling, debugging and proving a complex, mission-critical model with no view into its structure. Amazon Neptune gave them the database, but no comparable tooling to develop against it, explore it, or validate it. To get the full value of the strategy they had designed, the team needed the right tool to make their work with Neptune effective and safe to rely on.
The Solution
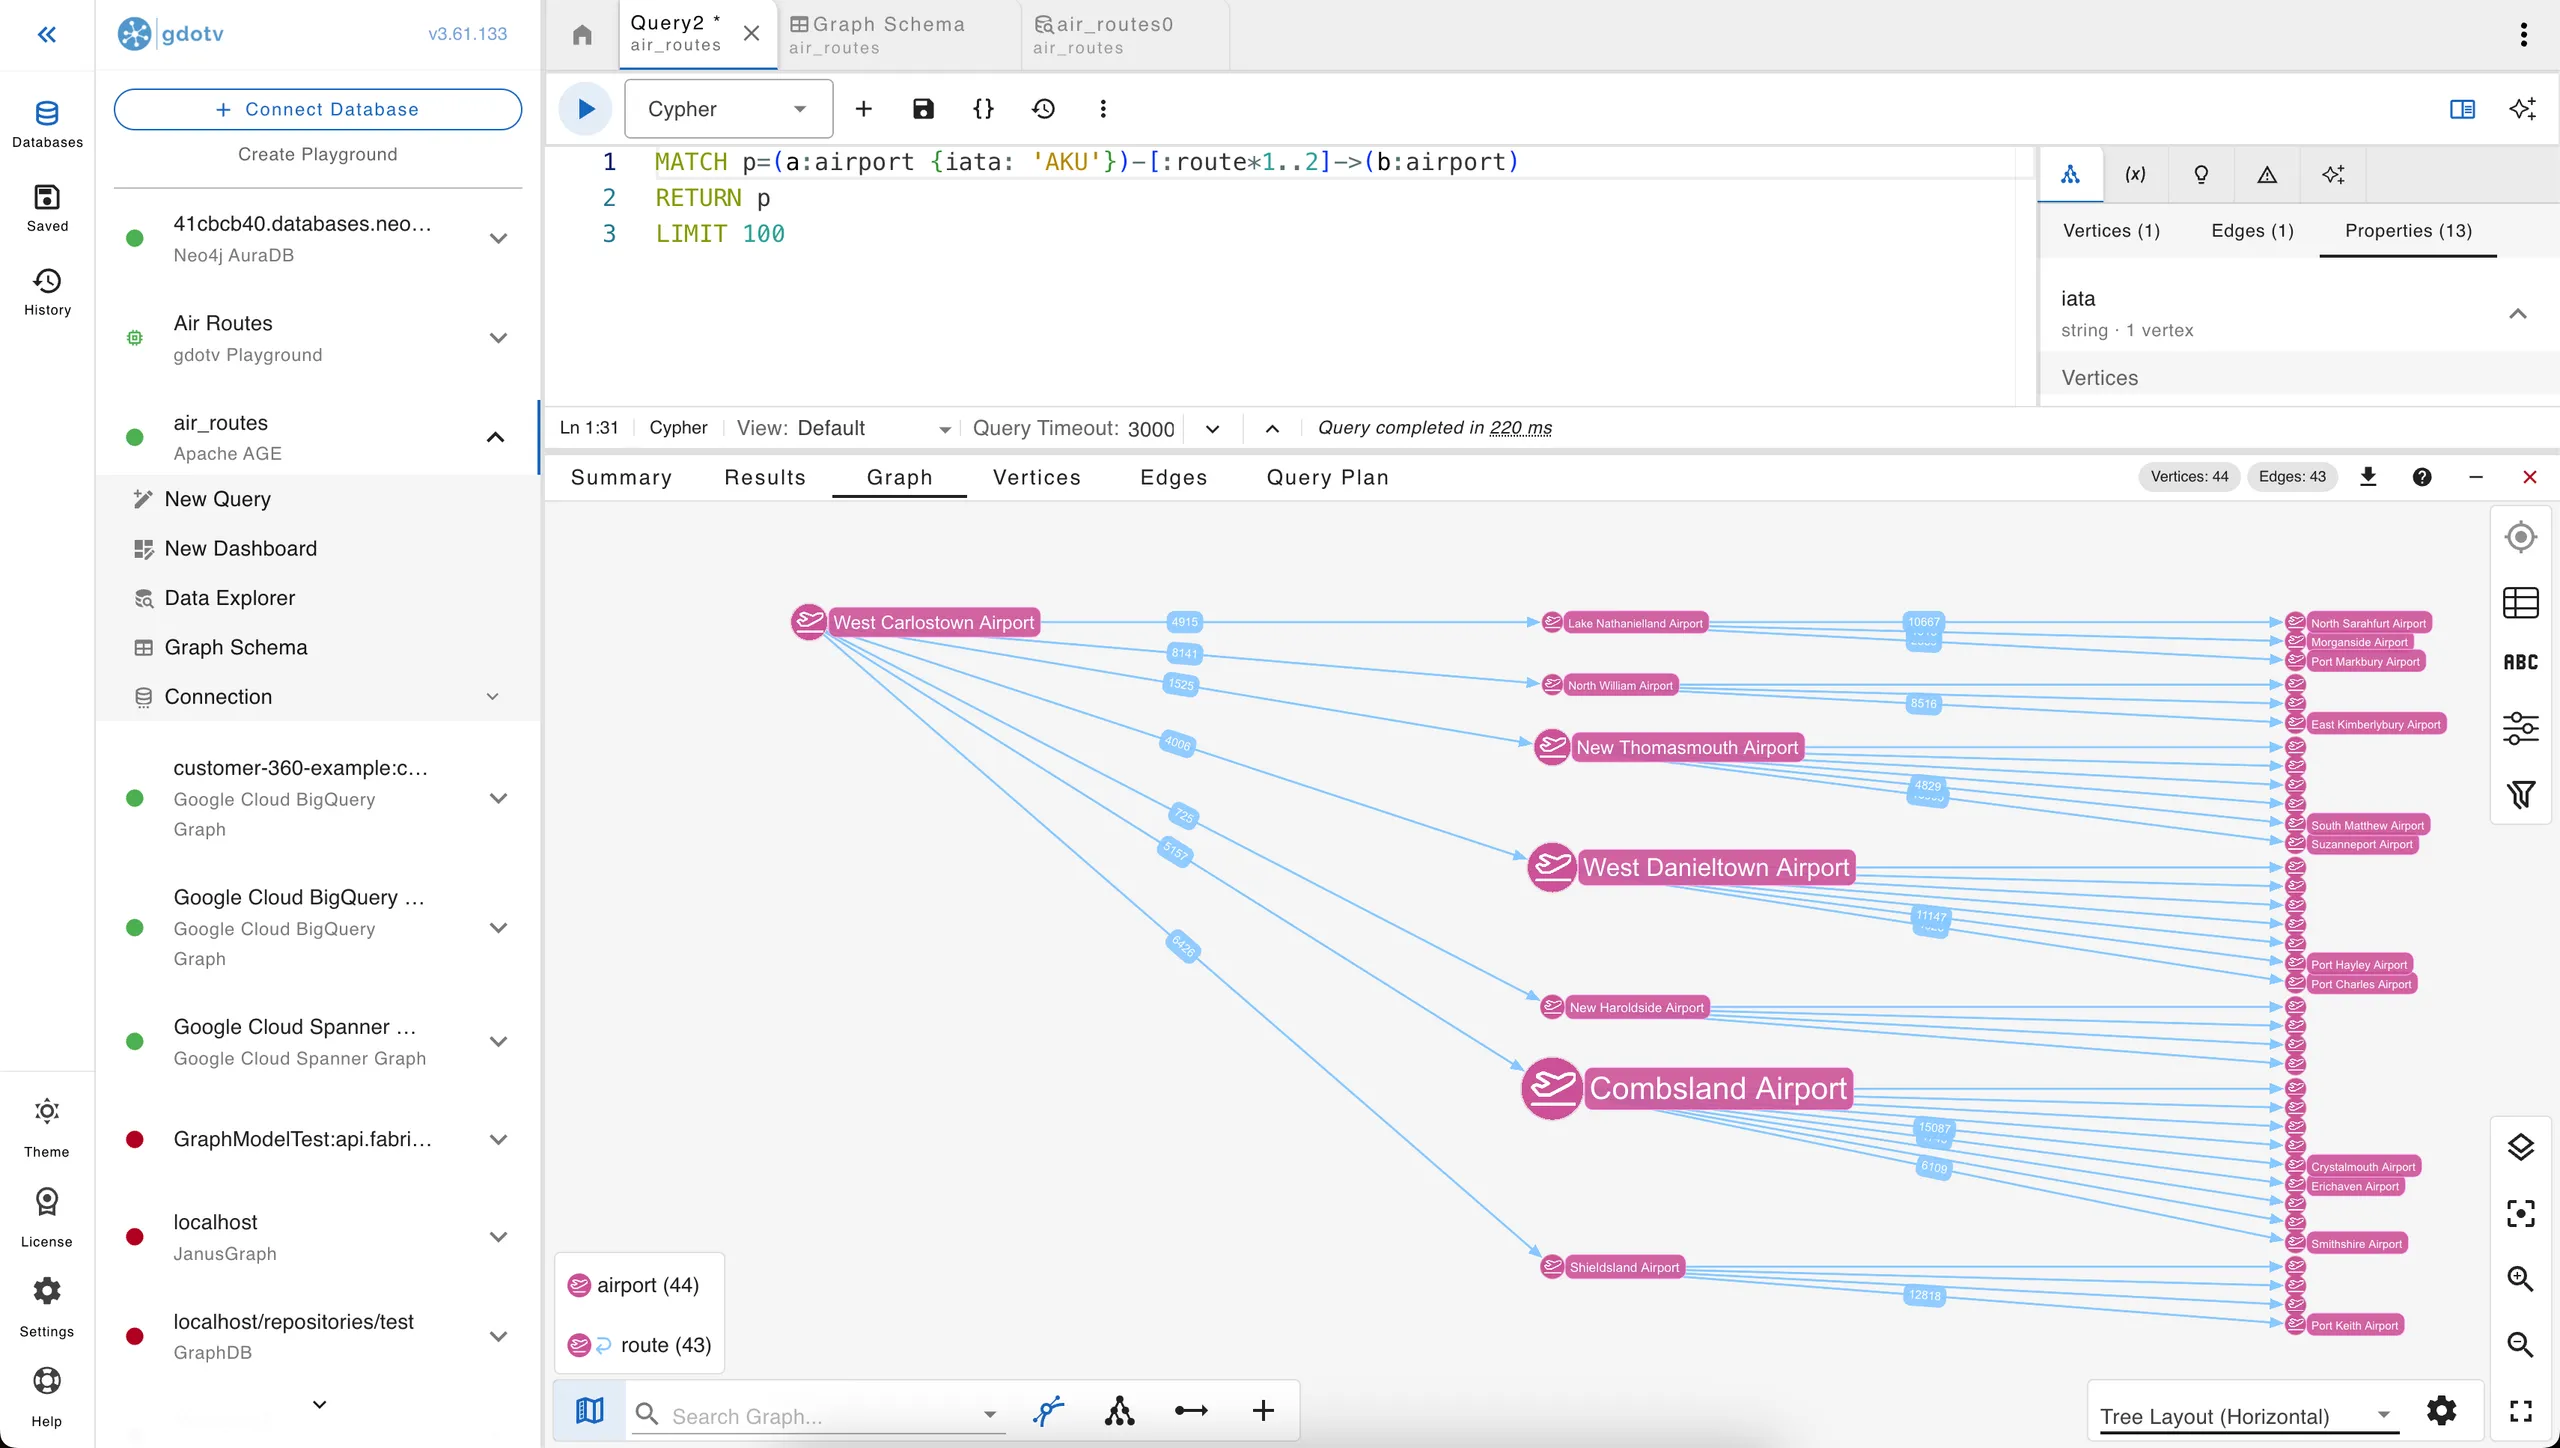
In the early days of using Amazon Neptune, one member of the team came across gdotv and tested it out. As a graph database IDE, gdotv gave the team the tooling to develop, query, edit, explore and visualize their graph data, capabilities Neptune itself didn’t offer.
At first there was just one user. The tool proved so useful that other team members began sending regular requests, tests and questions through that person. After briefly expanding to two licenses, the Digital Product Manager settled on the AWS Marketplace version of gdotv so that anyone on the team could access it in a shared environment, hosted on their own infrastructure.
In practice, gdotv became the lens over the company’s decision graph. Beyond querying and editing, it lets the team visualize and explain the decision graph across the entire configuration process, turning an abstract, many-layered model into something a person can actually follow. Just as importantly, it let the digital team focus their time on implementing their own business rules instead of ramping up on graph database internals, and gave them a clear way to communicate the business value of the graph-native approach internally, a key part of getting a digital-native strategy adopted across the organization.
The Digital Product Manager is clear that the decision to partner with gdotv was about more than the product:
“The gdotv team was always helpful and available. They act like an ongoing partner to your business. I’d love to have more partners like the gdotv team,” they said.
The Results
The company measures the impact of its graph strategy on the work that matters most: evaluating whether a customer’s configuration can be built and flown safely. On that work, the team optimized three business metrics at once: the time, cost and quality of evaluation. Each is a product of the company’s own digital strategy and graph engineering, with gdotv contributing as the tool that let the team build, debug and trust that work.
On quality, where the real ROI sits, gdotv plays a crucial role in quality-controlling, analyzing and debugging the configuration graph to ensure it outputs 100% accurate results, every time, a non-negotiable for a safety-critical system. The Digital Product Manager estimates that without gdotv, this quality control alone would have taken 3x as long, and it has made those quality checks more robust in the process.
On time, the gains compound from the configuration level all the way up to release. gdotv reduced the team’s development lead time and let them resolve bugs proactively in the data up to 3x faster by using visualization for quality checking. The cumulative effect is striking: for one of the company’s most complex software projects, a release process that used to take 3 to 4 weeks now takes just 2 days. On cost, the smart, focused validation, made trustworthy by the ability to see the graph, avoids brute-force computation and lowers configuration-management costs.
gdotv has been especially valuable for debugging:
“About 90% of our current usage of gdotv is to look at a node in our graph database and then inspect its links, then the links of those links and so on until we understand what’s happening or what went wrong. In terms of debugging, gdotv is super effective, and to test and approve the graph structure, it’s also really helpful,” said the Digital Product Manager.
The business value extends beyond the engineering team. These visualizations are closely tied to the company’s core business logic and internal processes, and are used not only for internal coordination and problem-solving but also to give customers read-only access to certain portions of the graph so they can examine and understand critical connections in their own data. In time, the Digital Product Manager wants more of the team, especially non-technical employees and stakeholders, to have access to those visualizations, and the digital team is working toward a top-to-bottom data platform linking all of the company’s data across the entire purchase and manufacturing process. It will, of course, be built on a graph database.
“gdotv has been really helpful for the team to understand the behavior of the graph. It absolutely contributes to our success,” they said.
Anonymized at the customer’s request.