The Weekly Edge: Fraud Graphs, Neo4j’s GraphTalk, GFQL’s Polars Support, & More
Happy Thursday!
We’re back at it, once again keeping you updated on the latest graph news. This week the news has touched on a few classic graph domains: fraud detection, pharmaceuticals and Wikidata. Read on to see what’s been happening.
Headlines this week:
- Crime, why not do it yourself? Santander have published a repo to generate transaction graphs to develop fraud detection algorithms.
- Recap Neo4j’s recent GraphTalk in San Francisco and catch up with theCUBE.
- Graphistry to…. Graphfuture? Query engine GFQL brings Polars support to Graphistry
- Just so many questions – The Wikidata Query Logs (WDQL) dataset explores whether SPARQL training data can be automatically generated.
- Trust the graph! AWS has published a GraphRAG walkthrough for users to test out their toolkit.
If you’re new here, the Weekly Edge is your weekly tl;dr of graph technology news curated by the team at gdotv, giving you all the reads, repos, vids, and walkthroughs worth exploring from the past seven-ish days (or so).
/*
 * It’s time to level up your graph game:
 * Query, explore, edit, and visualize your connected data with the gdotv graph IDE
 * Try out the free dev tier or upgrade to a 1-month, no-fuss free trial.
 */
/*
*/
[Repo]: Open-Source Transaction Graphs for Fraud Pattern Matching
We all love a good playground. The Santander team have recently published the tools to make your own.
Fraud detection typically involves looking for suspicious outliers hidden within large datasets. That’s why simulating fraud detection necessitates simulating large environments. Santander have offered a take-home methodology for anyone to use. This takes the form of a Python-based repository hosted on GitHub.
Basically, you can use their pipeline to generate your own large-scale synthetic transaction data. The intended purpose is really whatever you like, from benchmarking existing techniques to developing new ones. The graph schema consists of accounts as nodes and transactions as edges, with fraud rings (suspicious edge rings with suspicious property values) baked into the simulated data.
I’ve written about using graphs in fraud detection before, such as my Stop Right There! post, which explored a similar demo by Aerospike. That demo also generated a similar transaction graph to identify flagged transactions. I haven’t performed a full comparison of datasets, but one key difference seemed to be that the Aerospike graph assumed pre-flagged accounts and devices, while the Santander graphs are oriented towards identifying new suspicious patterns.
[Livestream]: Catch up on Neo4j’s GraphTalk with theCUBE
If you’re not already aware, Neo4j hosts a number of semi-regular events, both online and all over the world. The flagship event is the annual NODES conference, but they have a wide variety of other events, such as the GraphSummit series, and GraphTalk events.
One such GraphTalk took place last week in San Francisco, on the 23rd of July.
Key takeaways from the speaker notes seem to be that Neo4j are increasingly willing to become one of the many companies re-packaging their graph platforms as LLM layers. It’s been well-known that LLMs are struggling to achieve profitability and some suppose graph databases may be able to provide reasoning layers to improve reliability. Despite the financial uncertainty, multiple graph companies seem to have put themselves forward for the task. The belief in this business strategy seems to be at least partially driven by “AI-driven future” forecasts by research firm Gartner, who one of the GraphTalk speakers (Philip Rathle, Chief Technology Officer at Neo4j) quotes directly in his presentation. You may recall that my colleague Amir noted in the 25th June Weekly Edge that database company Yugabyte also cited Gartner predictions to justify their own pivot towards LLM applications, suggesting that faith in Gartner may play an important role in this industry shift.
The event itself will be covered by Silicon Valley research team theCUBE. theCUBE highlights general risks of the “all-in” LLM-first approach, commenting that “while AI adoption is accelerating, organizations continue to struggle with data fragmentation and knowledge discovery across the software ecosystem,” but also note that Neo4j do seem to offer genuine advantages over some such alternatives. One example is the greater transparency recently acquired GraphAware Hume offers over closed-source alternatives such as Palantir Gotham, which we covered in the 11th June Weekly Edge.
You can check in with theCUBE’s livestream today, or catch up with it on demand.
[Update]: GFQL, the query engine for Graphistry, introduces Polars support
If you’ve been following graph-on-relational technology like the gdotv team (see my previous blog post) then you might be interested to hear about Graphistry. They’re a visualization platform that focuses on bringing graph analysis, and in particular graph visualization, to existing databases.
(Does that make them a competitor to gdotv? Maybe! But we focus on slightly different niches, so it’s all friendly here.)
Graphistry’s primary focus is on bringing GPU powered graph visualization to relational databases. It runs on Graph Frame Query Language, or GFQL, an open-source query engine which brings Cypher functionality to dataframes.
This week’s update is that GFQL has brought graph queries to Polars dataframes. Polars is an open-source Python-based library for managing tabular data (kinda like pandas). Compared to pandas, Polars is a more powerful, modern library aiming for speed. And speed is the advantage boasted by Graphistry, claiming that this Polars integration significantly reduces overheads.
They post some early benchmarking tests relative to some familiar faces at gdotv (Neo4j, Memgraph and Kuzu/LadybugDB), and quote three big-concept goals for the future: (1) Zero ETL, (2) Zero CPU, and (3) bigger-than-memory tiling.
[Paper]: Demonstrating the Wikidata Query Logs (WDQL) Dataset
Just recently we were delivering you resources for Wikidata in the 16th June Weekly Edge, so I hope you like Wikidata because we have more Wikidata-related updates for you.
Researchers Sebastian Walter and Hannah Bast at the University of Freiburg in Germany have recently published the Wikidata Query Logs (WDQL) dataset. This time, the focus is less on Wikidata itself, and more whether the large corpus of SPARQL queries can be used to generate question/query pairs that can be used to train LLMs to generate SPARQL queries from natural language prompts.
One immediate feature of this dataset that readers may find troubling is that the questions in the dataset itself are generated by LLMs. Various concerns have been raised over synthetic outputs from one LLM being used to train another LLMs. It has been proposed that such practices may have limited utility or even risk model collapse. Fortunately, the paper does investigate this by comparing models based on human-written datasets (“Prev“) and LLM-generated datasets (“WDQL”) and a combination (“Prev“+“WDQL”).
Ultimately it finds mixed results. In terms of F1 score, the models trained on LLM-written queries seem to perform significantly worse and significantly better on other datasets. These results are summarized in the left of Table 4. The reasons for such discrepancies do not yet seem to be well-understood, leaving it uncertain whether either type of dataset has any clear advantage over the other (though a hypothesis about heterogeneous style conventions is proposed). One interesting result though is that the combination (“Prev“+“WDQL”) does seem to have a kind of advantage. While it is rarely the best performing model against any single dataset, it does seem to be the most consistent model across multiple datasets, suggesting that a combination of human-written and LLM-written training data may be most robust to prepare LLMs for unusual domains.
The paper also presents some data when LLMs themselves were invited to act as judge. LLMs tended to judge the LLM-trained models as better, though I admit this does seem like a predictable outcome and it’s unclear to me what the significance is!
[Walkthrough]: A GraphRAG Walkthrough by Amazon Web Services
For our final news item, we have this developer walkthrough from AWS focused on using a knowledge graph prepared for pharmaceutical research.
Last week we posted an introduction to graphs in biomedical science, which discussed just a few of the challenges graphs can help solve within the pharmaceutical industry. Here, AWS claims to have created a large pre-made knowledge graph with information derived from e.g. the PubMed Open Access and Disease Ontology.
This knowledge graph is constructed from LLM summaries of medical documents, and doesn’t seem to be linked directly, so it’s hard to guess at how useful researchers may find it. Nonetheless, the blog post is not really about medical research itself, but rather serves as a beginner’s introduction to GraphRAG with Amazon Neptune Analytics. The idea is that if LLM agents are encouraged to base their responses on specific retrievable entities, then those responses will tend to be more reliable and easier to fact-check against those resources. Of course, the reliability of GraphRAG is fundamentally limited by the reliability of the underlying resources themselves, and unfortunately this is difficult to assess without more information on the knowledge graph itself. Nonetheless, they show how you can set up the pipeline itself, which is based on Amazon Bedrock.
In terms of evaluation, AWS cites a few (seemingly internal) performance indicators. They claim their GraphRAG pipeline has significantly sped up medical research in areas where it was deployed, though there is limited information on where this is. If you use this knowledge graph and would like to demonstrate its application we’d love to hear from you, and remember you can always use gdotv to explore your AWS Neptune data.
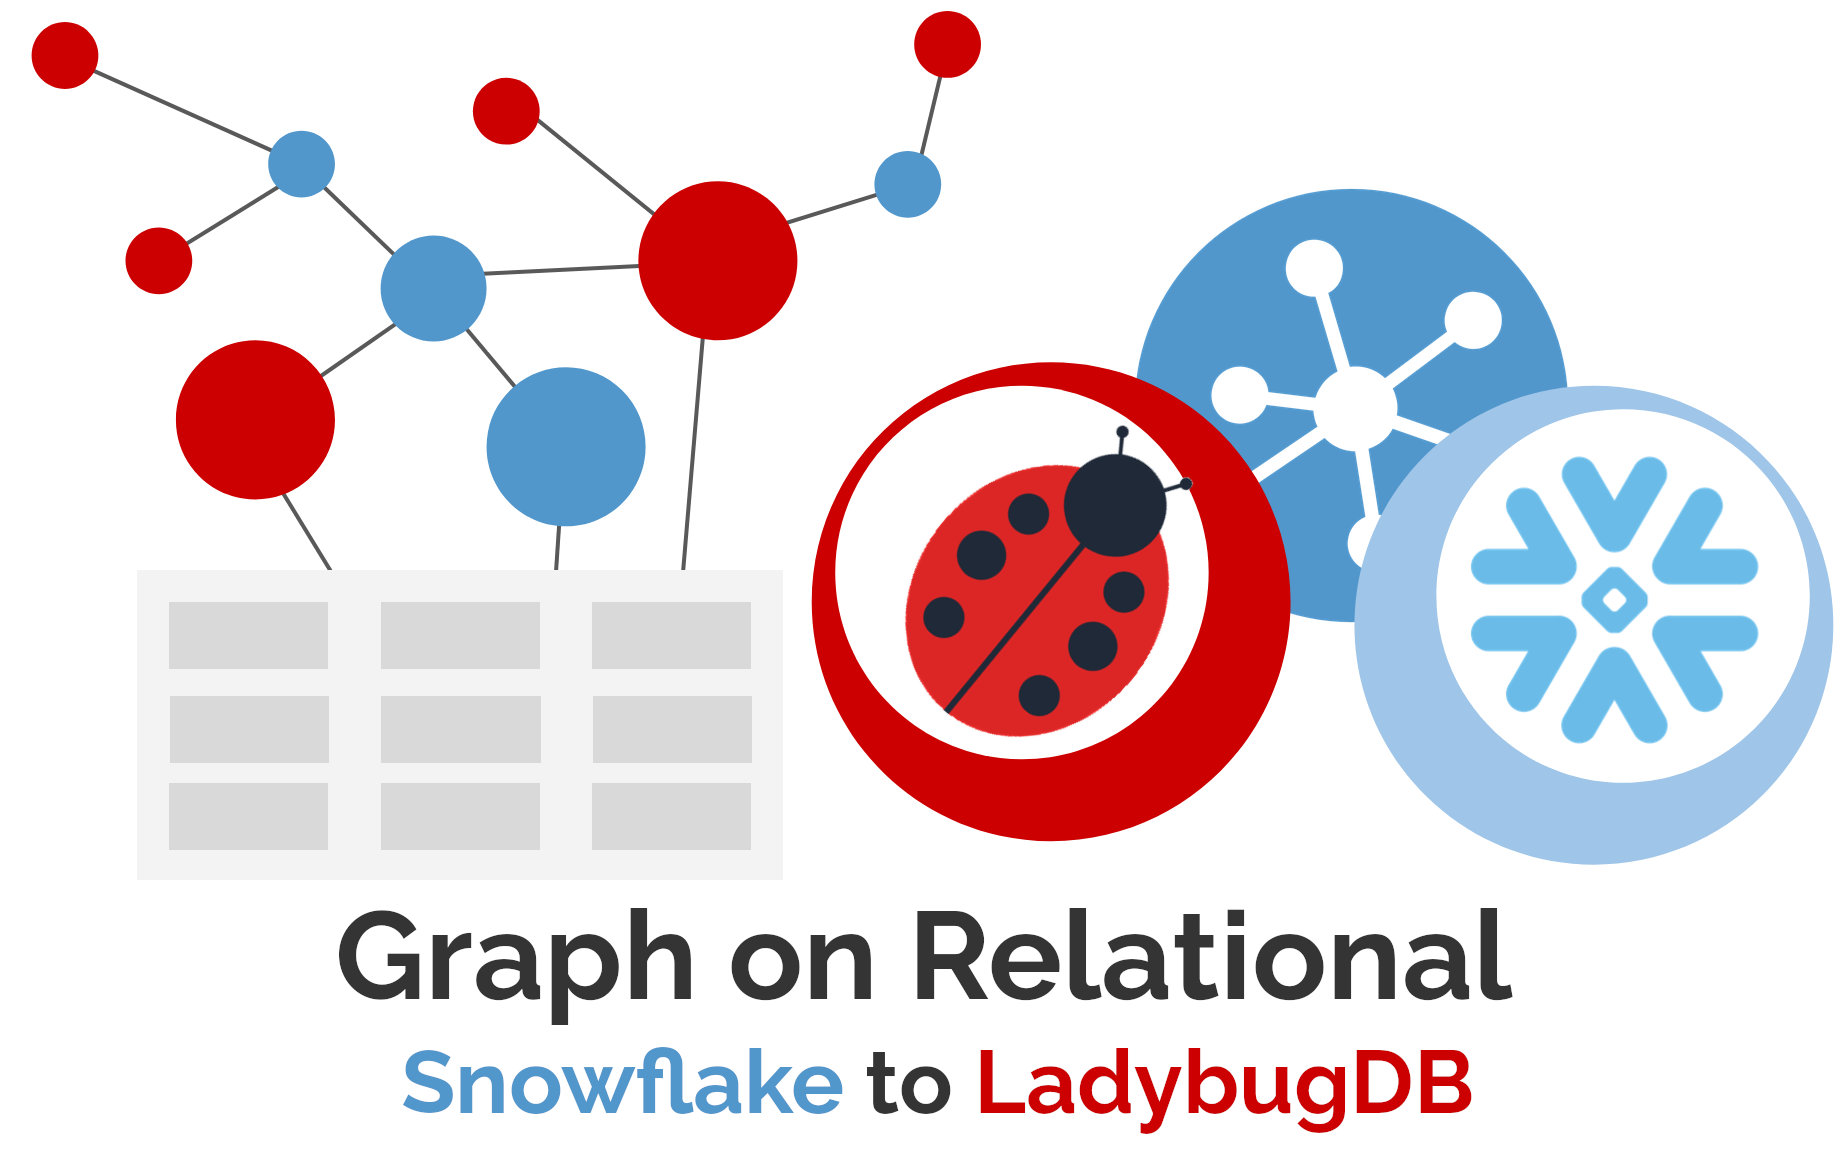
P.S. Since we’ve been talking about graph-on-relational technology, why not check out my latest blog post, integrating data from a Snowflake data lake into a LadybugDB graph?
P.P.S. In this week’s Graph Pulse, we checked in with Ora Lassila at Accenture to discuss RDF 1.2 and the role of agency in modern workflows.
P.P.P.S. Got an item to nominate for the next edition of the Weekly Edge? Hit me up at weeklyedge@gdotv.com or hit reply! ✍🏽

![gdotv Adds Multi-Graph Connections & Automatic Data Models [v3.74.142 Release Notes]](https://gdotv.com/wp-content/uploads/2026/08/multi-graph-connections-automatic-data-models-gdotv-v3-74-142-release-notes-banner.webp "gdotv Adds Multi-Graph Connections & Automatic Data Models [v3.74.142 Release Notes]")