Announcing SPARQL Query Guardrails, Dashboarding, Query Editor Upgrades, & More [v3.53.111 Release Notes]
![Announcing SPARQL Query Guardrails, Dashboarding, Query Editor Upgrades, & More [v3.53.111 Release Notes]](https://gdotv.com/wp-content/uploads/2026/03/rdf-sparql-query-guardrails-interactive-graph-dashboarding-gdotv-release.jpg "Announcing SPARQL Query Guardrails, Dashboarding, Query Editor Upgrades, & More [v3.53.111 Release Notes]")
Another exciting update of gdotv has arrived!
The team has been hard at work, and we’re excited to introduce several new features designed to make working with graph technology even more powerful and intuitive.
In this release, gdotv introduces SPARQL query guardrails to help users write semantically correct SPARQL queries with clearer feedback and validation before execution. Alongside this, we’re also introducing dashboards, a brand-new way to transform graph query results into visual analytics for exploring patterns and insights in your data.
Together, these updates make it easier to explore graph datasets, build reliable queries, and communicate insights from your graph data more effectively.
Let’s dive in!
RDF Querying Guardrails for Smarter SPARQL Validation
Writing semantically correct SPARQL queries against RDF datasets can sometimes be challenging, especially when working with complex ontologies or unfamiliar schemas. While a SPARQL query may be syntactically valid and executable, it can still be conceptually incorrect with respect to the underlying ontology. Because SPARQL engines simply match graph patterns without understanding semantic intent, mistakes such as incorrect predicates, invalid class references, or mismatched domain and range constraints can silently produce empty or misleading results. In production environments, especially those supporting ETL pipelines or downstream analytics, these subtle semantic errors can become a serious source of data quality issues.
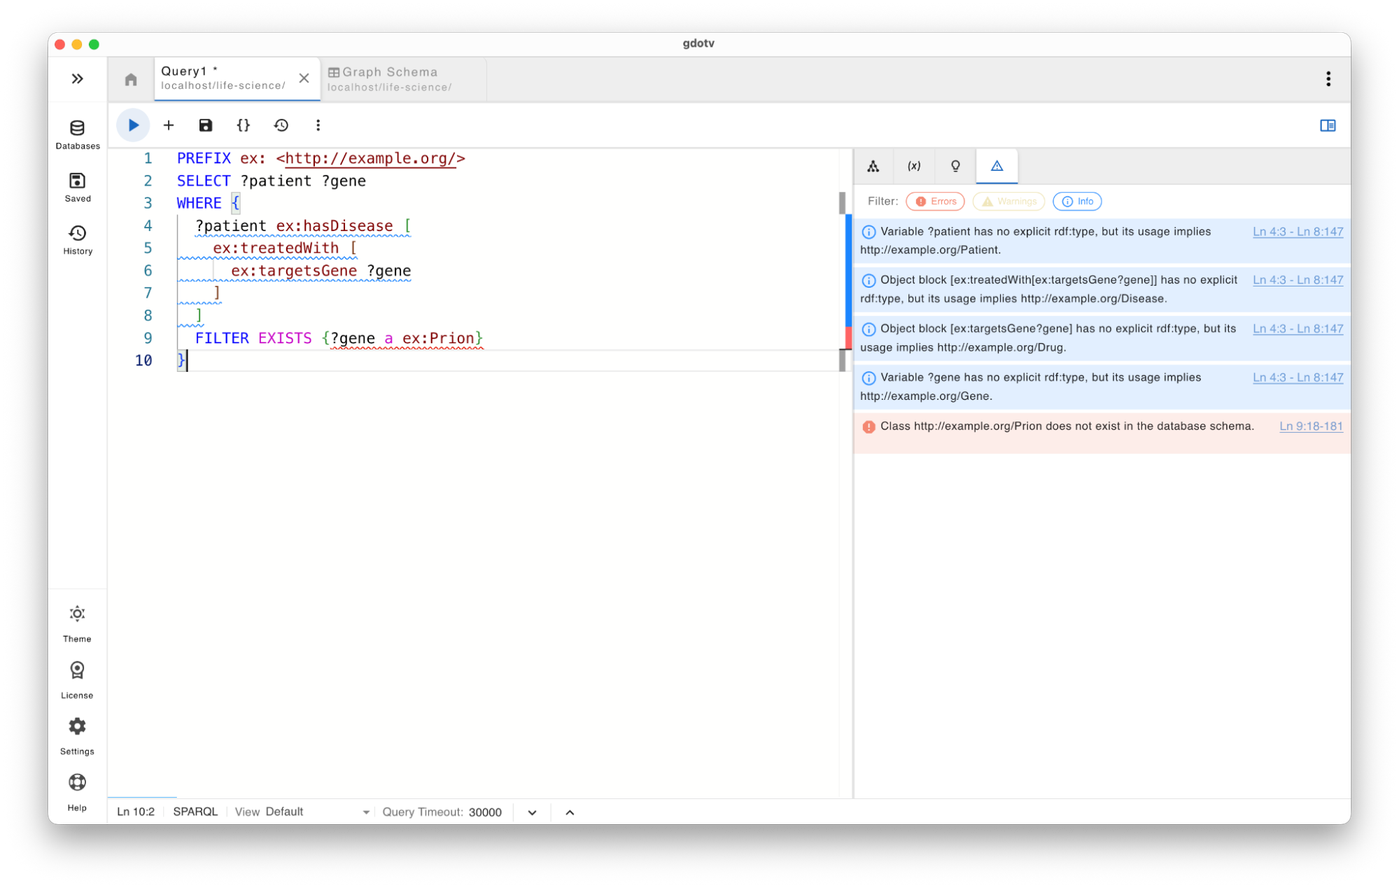
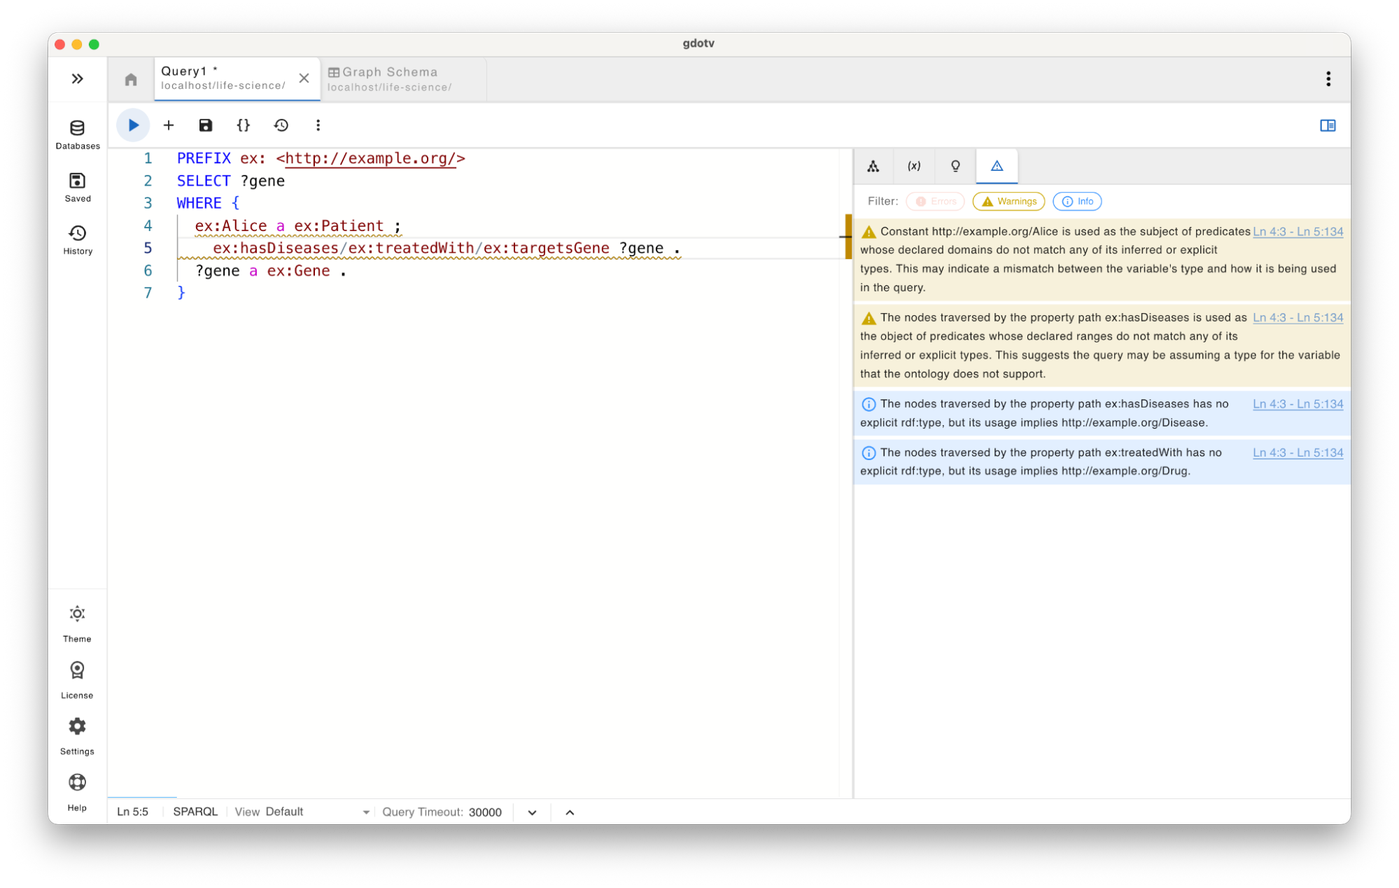
To address this problem, gdotv introduces SPARQL query guardrails, an ontology-aware validation layer built directly into the query editor. As users write SPARQL queries, the system continuously analyzes patterns against the dataset’s ontology and inferred schema. gdotv identifies semantic mismatches, detects invalid or nonexistent ontology terms, and infers the expected types of variables and intermediate nodes. Instead of waiting until execution time, users receive immediate feedback about potential issues directly within the query-writing process. Such issues will be discovered in both normal patterns and patterns with extended paths.
The new SPARQL query guardrails classify issues using three levels of severity: Info, Warning, and Error. The severity is determined both by the nature of the semantic issue and the context in which it appears in the query. For example, referencing a class that does not exist in the schema or inferring that a variable belongs to two disjoint classes is considered a strong semantic error. At the same time, the query structure also matters: issues occurring in mandatory graph patterns are treated more seriously than those inside optional constructs such as OPTIONAL, UNION, or EXISTS, where the semantic assumptions may be intentionally weaker. This contextual evaluation helps surface the most important problems while still providing helpful guidance for less critical cases.
The result is a safer and more productive query development workflow for you. SPARQL query guardrails act as a semantic safety net that help you catch mistakes early, clarify the intended meaning of complex graph patterns, and prevent incorrect queries from propagating into production systems. By surfacing these issues proactively, gdotv helps your team write more reliable SPARQL queries while preserving the expressive flexibility of the language.
Key Capabilities
Ontology Term Validation
Guardrails immediately flag references to classes or properties that do not exist in the dataset schema, preventing common mistakes such as typos or outdated ontology terms.
For example, a warning might say: “Class X does not exist in the database schema.”
Semantic Consistency Checks for Variables
gdotv now detects contradictions between explicit types and how variables are used in the query. For example, if a variable is declared as one class but its predicates imply another incompatible class, the query editor highlights the conflict.
For example: “?x is explicitly typed as Person, but its usage implies Protein. These classes are disjoint in the ontology.”
Detection of Incompatible Inferred Types
Guardrails analyze how variables are used across triple patterns and infer their semantic roles. If a variable is inferred to belong to incompatible or disjoint classes, the system warns that the query logic may be inconsistent.
An example error might be: “?x is inferred as both Gene and Protein. These classes are disjoint in the ontology.”
Role Validation for Classes, Instances & Predicates
SPARQL allows flexible graph patterns, but not every resource can legally play every role. Guardrails detect cases where variables are incorrectly used as predicates, classes, or instances.
An example warning might be: “?x is used as a predicate, but it is constrained as Person. Only properties can be predicates.” or “?x is used as a class (object of rdf:type), but it is also constrained as an instance.”
SPARQL Query Quality & Clarity Hints
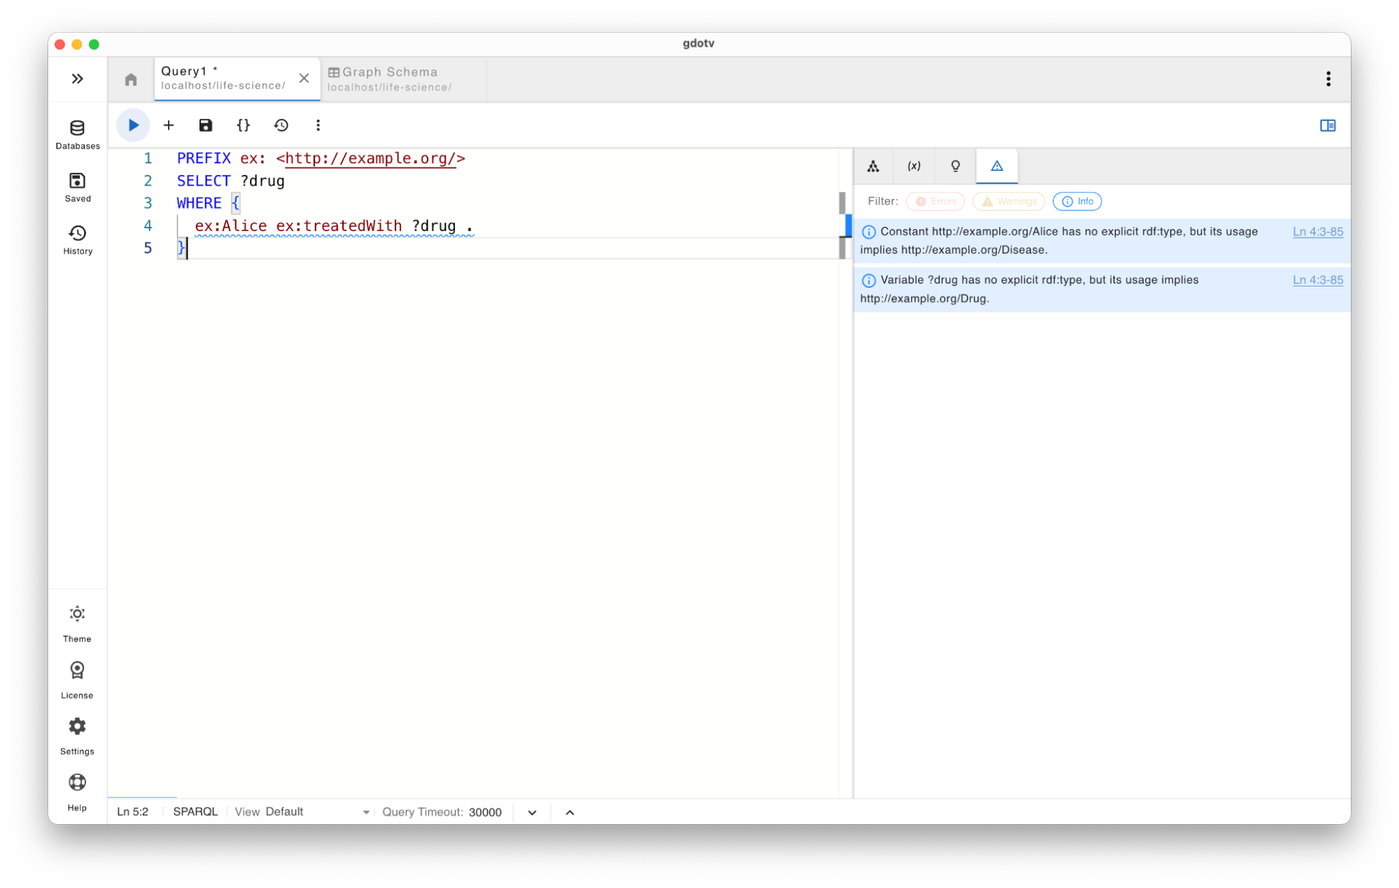
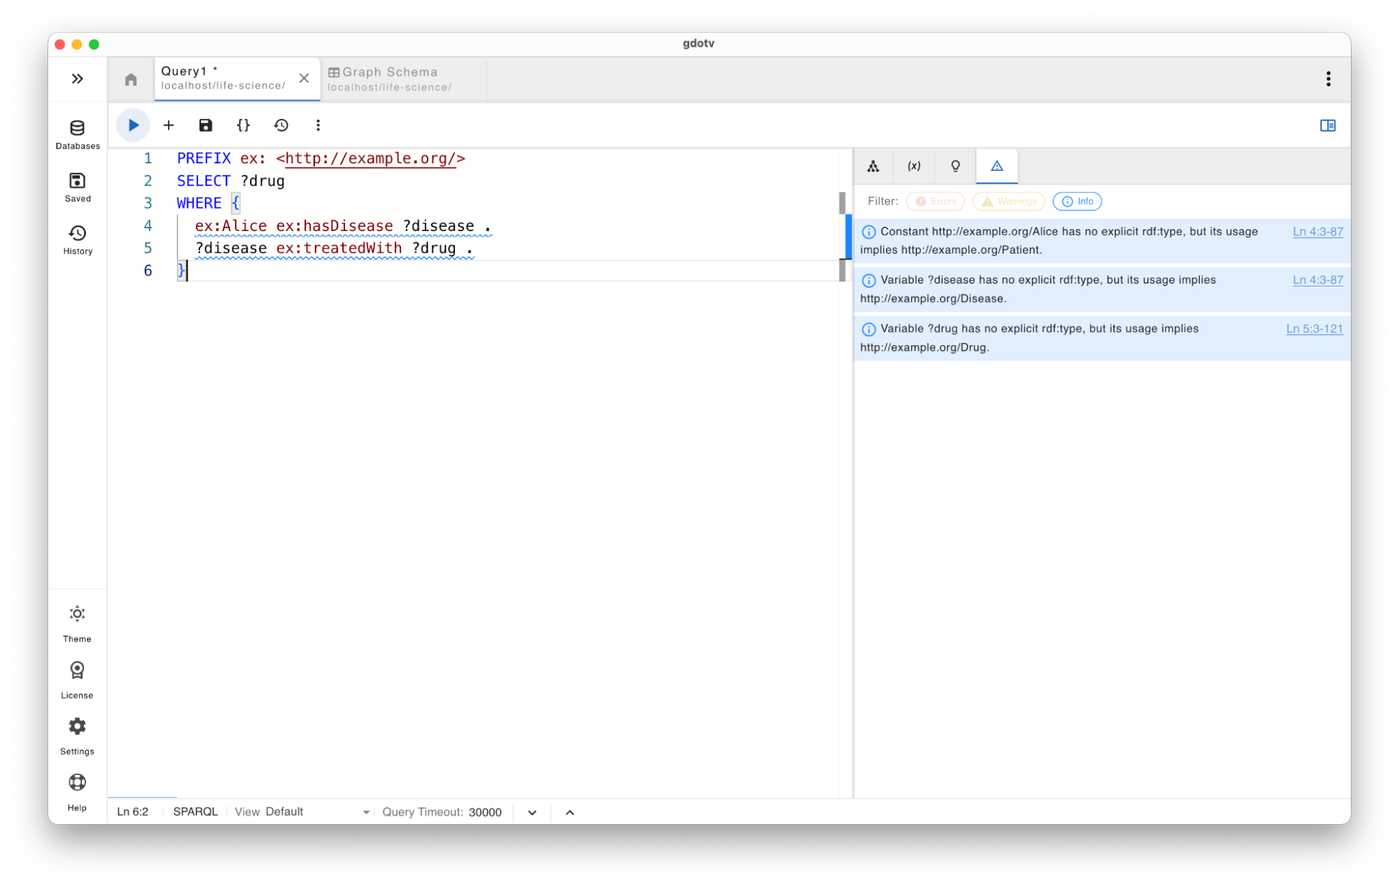
Beyond strict semantic errors, guardrails also provide helpful suggestions that improve query robustness and readability. These include hints about missing explicit rdf:type statements, ambiguous inferred types, or variables that are over-constrained by incompatible assumptions.
Example Infos might say things like:
“?x has no explicit rdf:type, but its usage implies Gene.”
or
“?x is inferred as multiple classes (A, B). This is allowed by the ontology but may reduce query clarity.”
As you can see below, writing semantically correct SPARQL queries has never been easier.
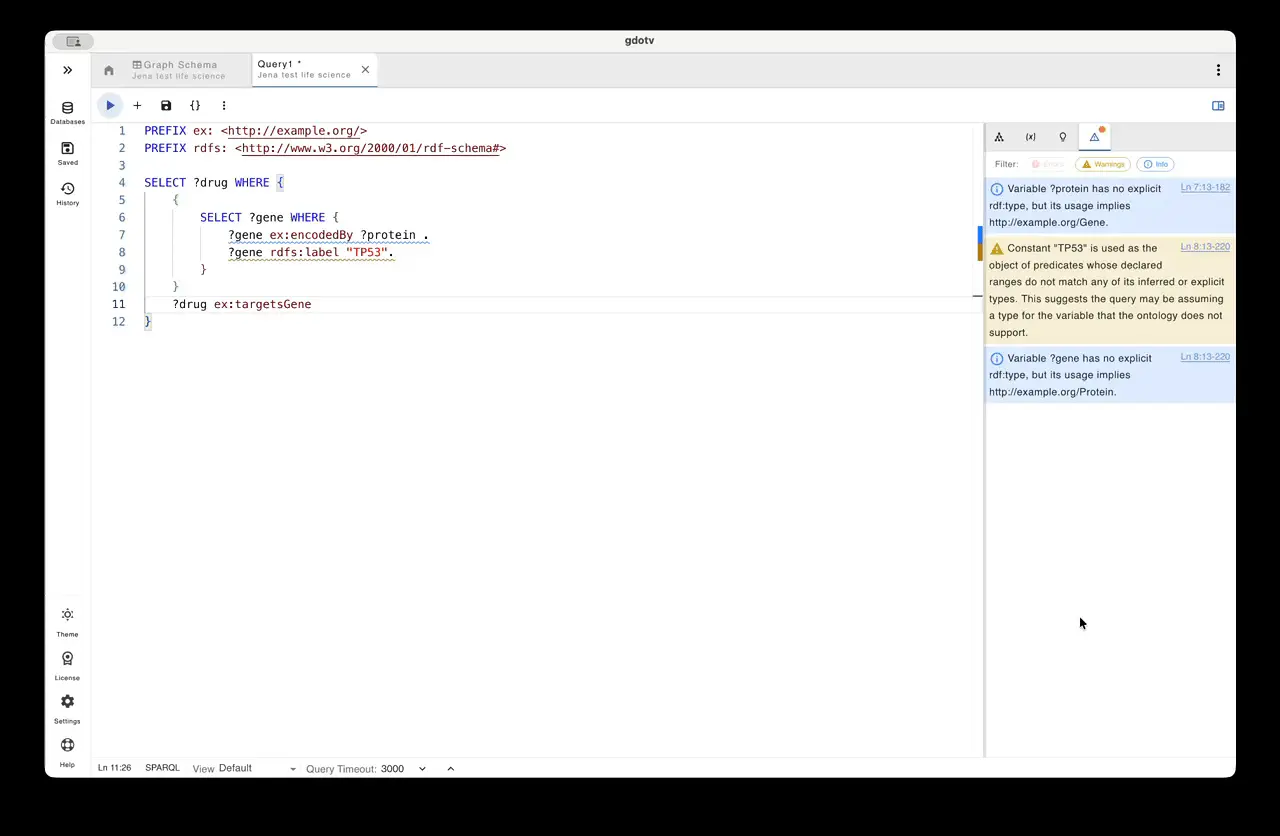
The animation above demonstrates how query guardrails work in real time while a SPARQL query is being written. As soon as a predicate or class is used incorrectly, such as using a variable with an inferred class in a wrong subject or object position that violates the ontology, gdotv highlights the issue and surfaces a contextual error or warning before the query is executed.
This real-time feedback transforms SPARQL authoring from a trial-and-error debugging process into a guided development experience. Instead of discovering semantic issues after running a query or worse, after results have propagated into downstream pipelines users can correct mistakes immediately and build queries that accurately reflect the intended data model.
For a full walkthrough with SPARQL query examples, check out Amir’s earlier preview post on SPARQL query guardrails.
Dashboards for Visual Graph Analytics
Understanding graph data often starts with writing queries – but communicating the insights from those queries can be just as important.
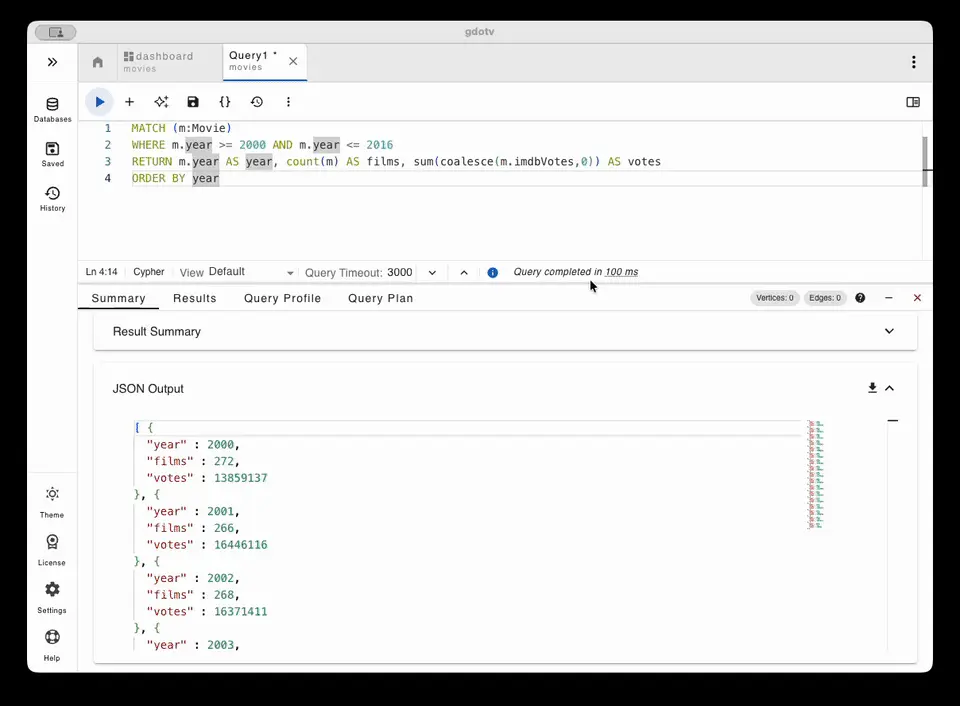
To help make this process easier for you, this gdotv release introduces Dashboards, a new way to transform your graph query results into visual data analytics inside gdotv.
A dashboard is composed of panels, with each panel powered by a query. When a query runs, its results can be displayed using visual representations such as charts, tables, gauges, or other data visualizations. Multiple panels can be arranged together within a single dashboard, allowing your related queries to be displayed side-by-side and interpreted as part of the same analysis.
By bringing multiple visual perspectives into one place, business intelligence dashboards make it easier for you to identify patterns, track important metrics, and compare different slices of graph data. Your team moves beyond inspecting individual query results and instead builds shared views that highlight trends, anomalies, and relationships across your datasets. This makes dashboards useful not only for exploration, but also for communicating insights and supporting data-driven decisions.
Key Capabilities
With dashboards in gdotv, users can now:
- Create and save multi-panel dashboards where each panel is powered by its own query.
- Build more dynamic dashboards using query variables/parameters, so panel results can be adjusted without rewriting queries.
- Visualize query results in multiple formats, including charts, tables, gauges, graph visualizations, JSON, markdown, maps, images, and embedded content.
- Organize dashboards with flexible layout controls, including drag/resize, grid optimization, and multi-tab dashboard workspaces.
- Refresh panels on demand or on an interval to keep dashboard insights current for operational and analytical workflows.
These visualizations allow users to quickly move from raw query results to meaningful insights.
Dashboards are especially useful when you need to revisit the same questions over time. Your team can build dashboards that track operational metrics, monitor changes in your graph data, or compare how different parts of a dataset behave.
Instead of re-running individual graph queries and interpreting the results each time, dashboards provide a persistent view where key queries and visualizations are already organized and ready to explore. That makes it easier to review trends, validate assumptions, and share findings with non-technical team members who may not be writing queries themselves.


Reference Panel Improvements in the Query Editor
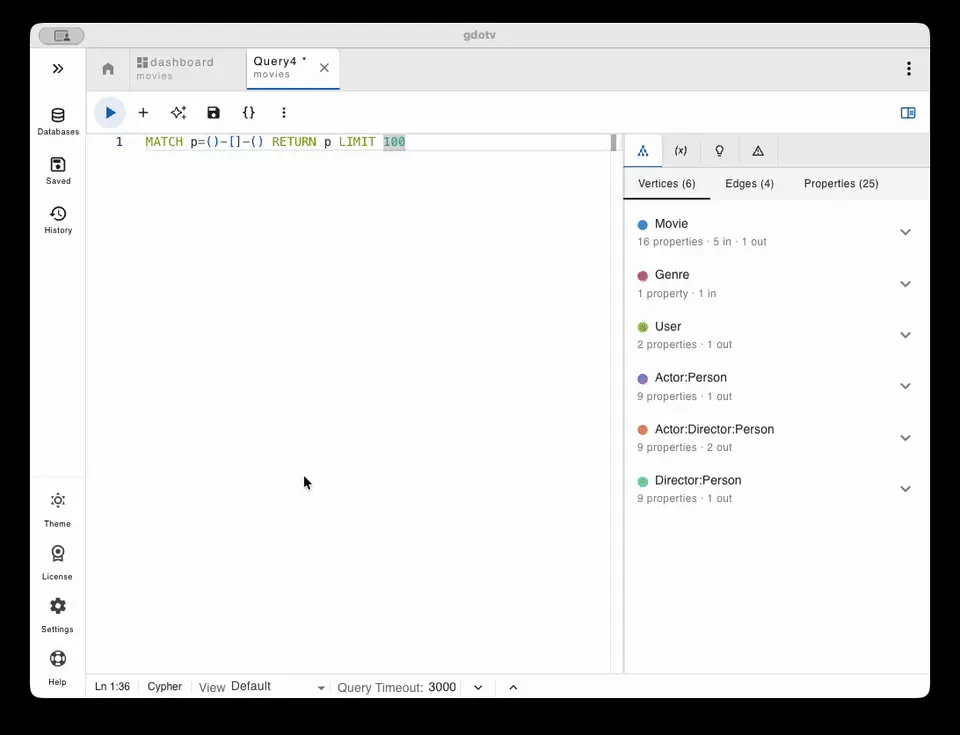
As your graph database queries grow more complex, having quick access to schema information, variables, and helpful feedback becomes increasingly important. In this release, we’ve refreshed the Reference Panel in the Query Editor to make it easier to access important information while writing your queries.
The updated Reference Panel brings together useful guidance and diagnostics in a single place, helping you stay focused on your queries without constantly switching between tools or views.
What’s New
This update introduces a more organized reference workspace within the Query Editor, including:
- Unified reference tabs within the panel, including:
- Schema
- Variables
- Tips
- Warnings
- Improved visibility into query health surfaced directly inside the panel.
- Warning indicators and badges that highlight when issues need attention.
- Faster access to query guidance, allowing you to understand schema structures and query context without leaving the editor.
Together, these improvements make the query-writing experience smoother and more efficient, particularly when working with larger schemas or more advanced queries.
The refreshed panel keeps helpful context close at hand, making it easier to write, review, and refine queries directly within the gdotv editor.
Let us know what you think of these updates!
Branding Update
![]()
This release includes a broad branding refresh across gdotv, replacing the G.V() naming with gdotv throughout the product and documentation.
You’ll see this reflected in several areas, including:
- Updated application naming in desktop windows and startup flows
- Refreshed diagnostics and system messaging
- Updated terminology across documentation and core guides
- New logo assets for a more consistent visual identity
These updates are part of an ongoing effort to make the product experience more cohesive and recognizable across the application, documentation, and support resources.
Conclusion
Well, there you have it: another gdotv release packed with exciting improvements!
This release introduces SPARQL query guardrails to help users write more reliable SPARQL queries, along with dashboards that transform graph query results into visual analytics for exploring patterns and insights in your data. We’ve also refreshed the reference panel in the Query Editor to provide faster access to schema guidance and query diagnostics, making the query-writing experience smoother and more efficient.
Alongside these features updates, the product now includes a branding refresh, transitioning from G.V() to gdotv across the application and documentation to create a more cohesive and recognizable experience.
With every release, gdotv continues to evolve into a more powerful environment for exploring, querying, and understanding your graph data.
The gdotv team is constantly working to improve the platform and bring new capabilities to the community, so keep an eye on this space – there’s plenty more to come!
What are you waiting for? Try out the latest version of gdotv today and see for yourself how it levels up your graph game in no time.


