QLever IDE
& Graph Visualization Tool
Explore, query and visualize your graph data in QLever with gdotv.
A Purpose-Built IDE for QLever Developers
QLever is a high-performance SPARQL engine developed at the University of Freiburg, designed specifically for querying large RDF knowledge graphs.
By connecting gdotv to a QLever endpoint, you can exploit a combination that is especially appealing in research and open data contexts, where datasets may contain billions of triples and you need to explore relationships across vast entity spaces.
QLever handles the heavy lifting of rapid query execution, while gdotv transforms the results into navigable, intuitive graph visualisations. gdotv also provides a host of features to make exploring your QLever graph data easier, including no-code graph data explorer, data schema view, syntax highlighting, SPARQL query guardrails and more.
For teams working with Linked Open Data at scale, QLever and gdotv together offer a strong foundation for both performance and visual insight.

An Overview of QLever
QLever is optimized for full-text search combined with SPARQL, making it particularly well suited to knowledge graphs that include large volumes of textual data, such as Wikidata or DBpedia. Its architecture prioritizes read-heavy analytical workloads, making it ideal for public knowledge graph exploration and research applications.
As an open source project with active academic development, QLever is a compelling option for researchers, data scientists, and organizations working with large-scale Linked Open Data, particularly where query performance over massive datasets is a primary concern.
What’s Possible with QLever + gdotv
Easy Installation & Setup
Effortlessly integrate gdotv with your QLever graph database with a simplified plug-and-play database connector. The gdotv database client provides straightforward database connection and configuration instructions to get you started in less than a minute.
This QLever IDE is available to download for Windows, macOS, and Linux with a one-click installer to get you started instantly.
Centralized Connection Management
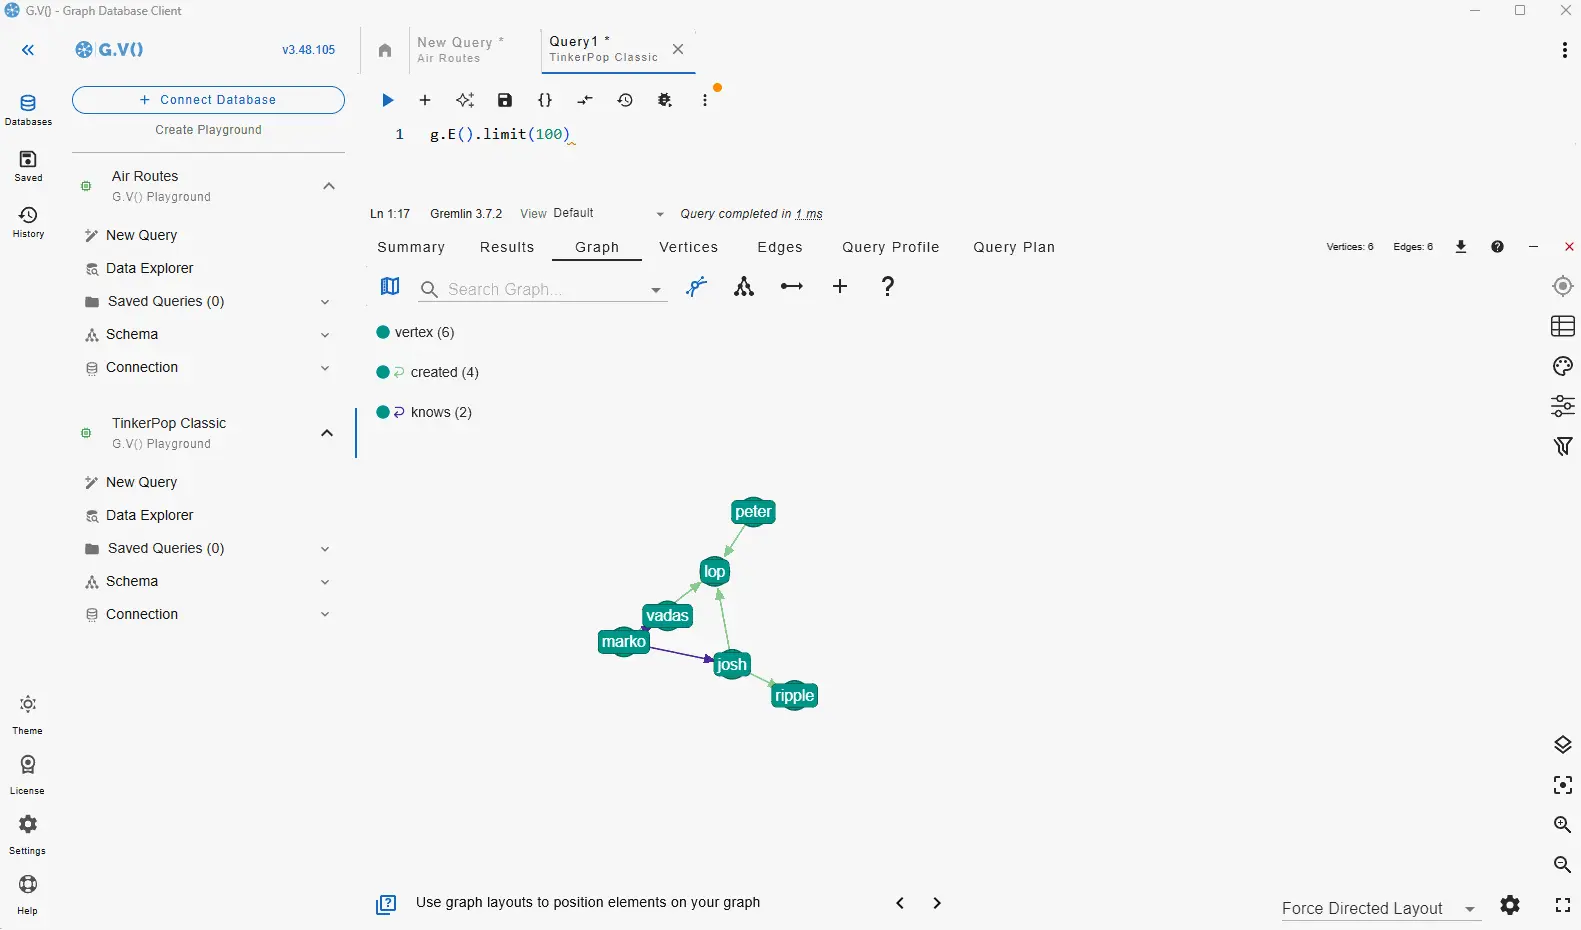
gdotv can be used to query and compare data from a huge range of graph database vendors – simultaneously! We don’t just work with QLever: gdotv data visualization tools fully integrate with various other graph technologies, including all Apache TinkerPop™ compatible graph databases and most LPG and RDF providers.
gdotv is fully compatible with query languages like SPARQL, Gremlin, Cypher, Google SQL, SQL:2023, and more. Using an intuitive UI, you can switch between your connections and queries seamlessly.
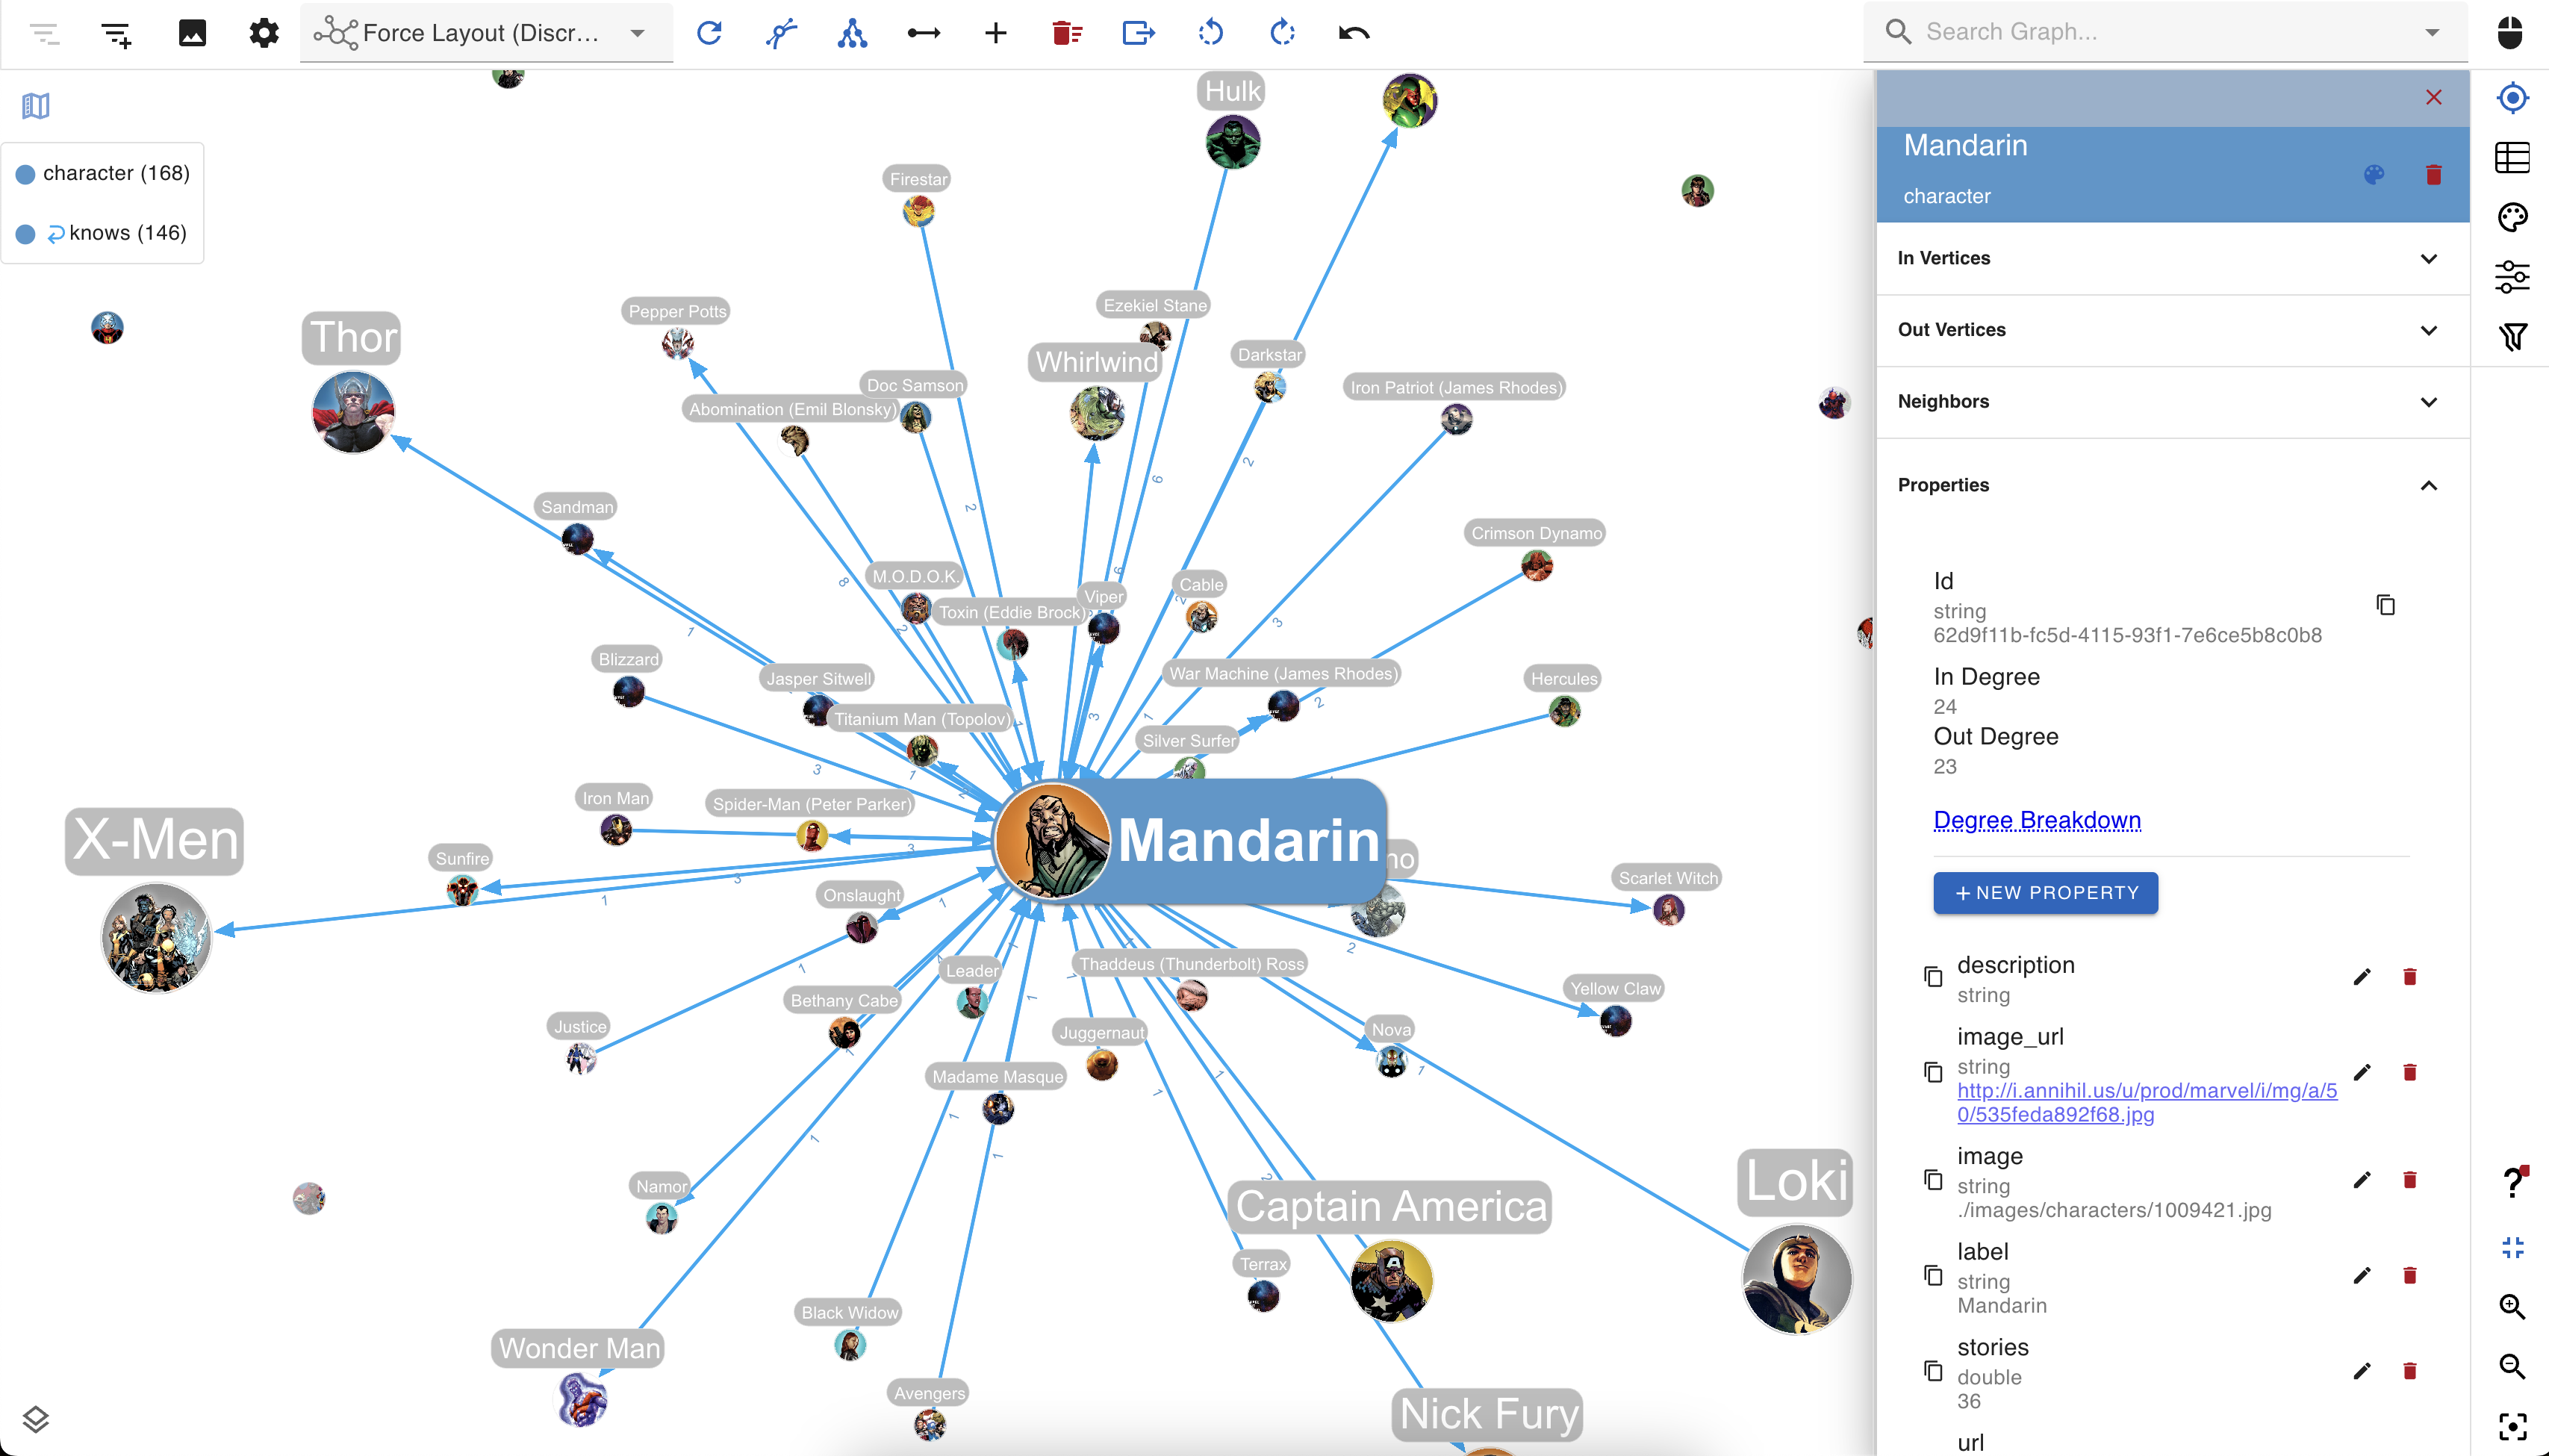
Customizable Data Visualization
You can create custom visualization rules for your QLever graph database with gdotv to determine the look and feel of your data.
The gdotv database client boasts easy-to-configure style options that you can use to customize vertices and edges based on their labels and property values.
You can choose any color, size, or background image and adjust other elements to match your preference.
No-Code Data Exploration with the gdotv Graph Data Explorer
Use the built-in gdotv Graph Data Explorer to navigate your QLever data without using queries.
The Graph Data Explorer allows you to define path patterns to query from your data, using filters on both your vertices and edges. Elements in the declared path can be filtering according to their label, direction, and property values, allowing you to perform complex path-pattern searches with no code.
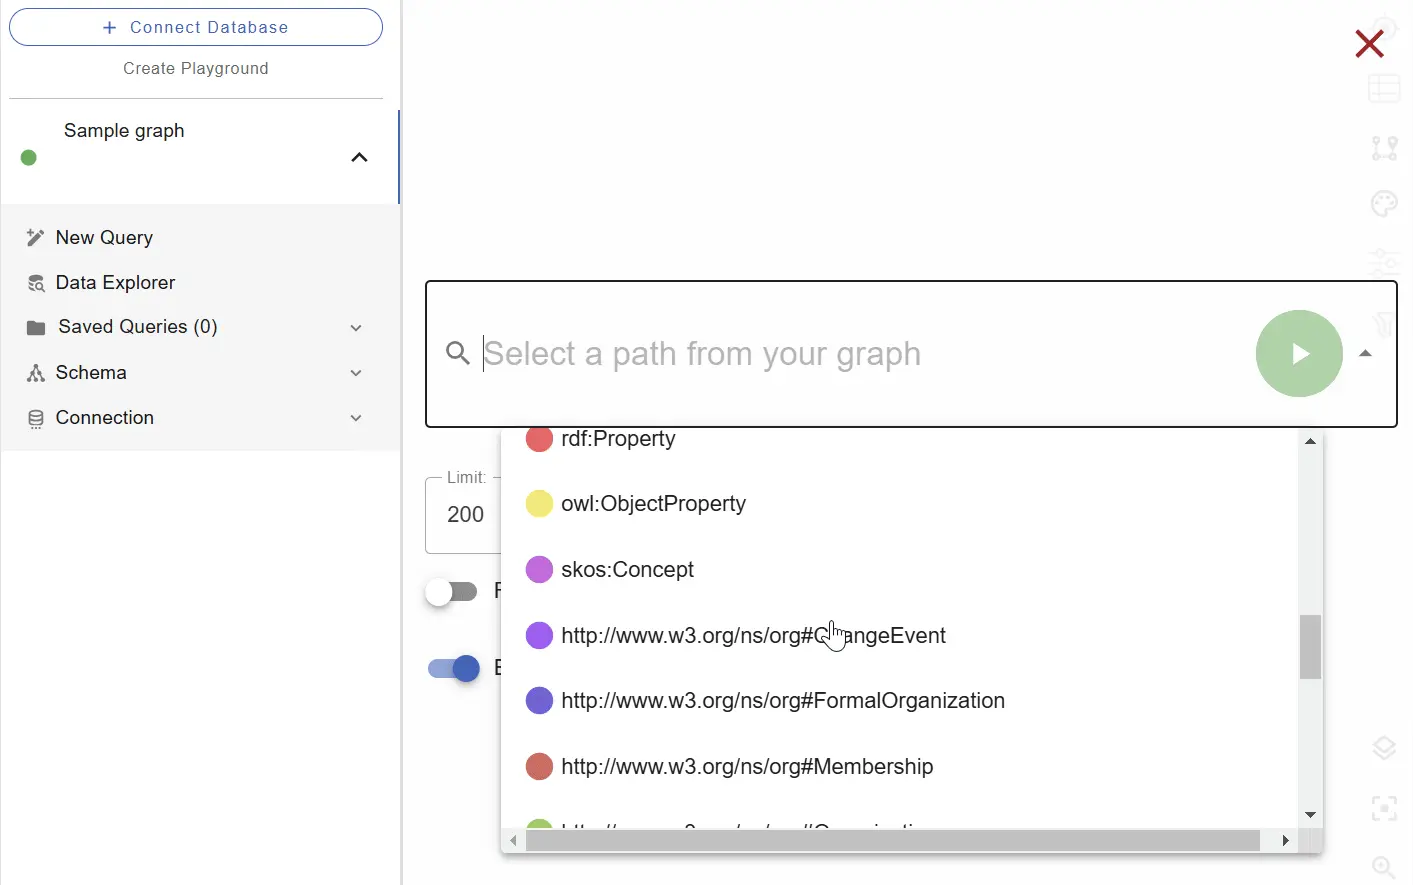
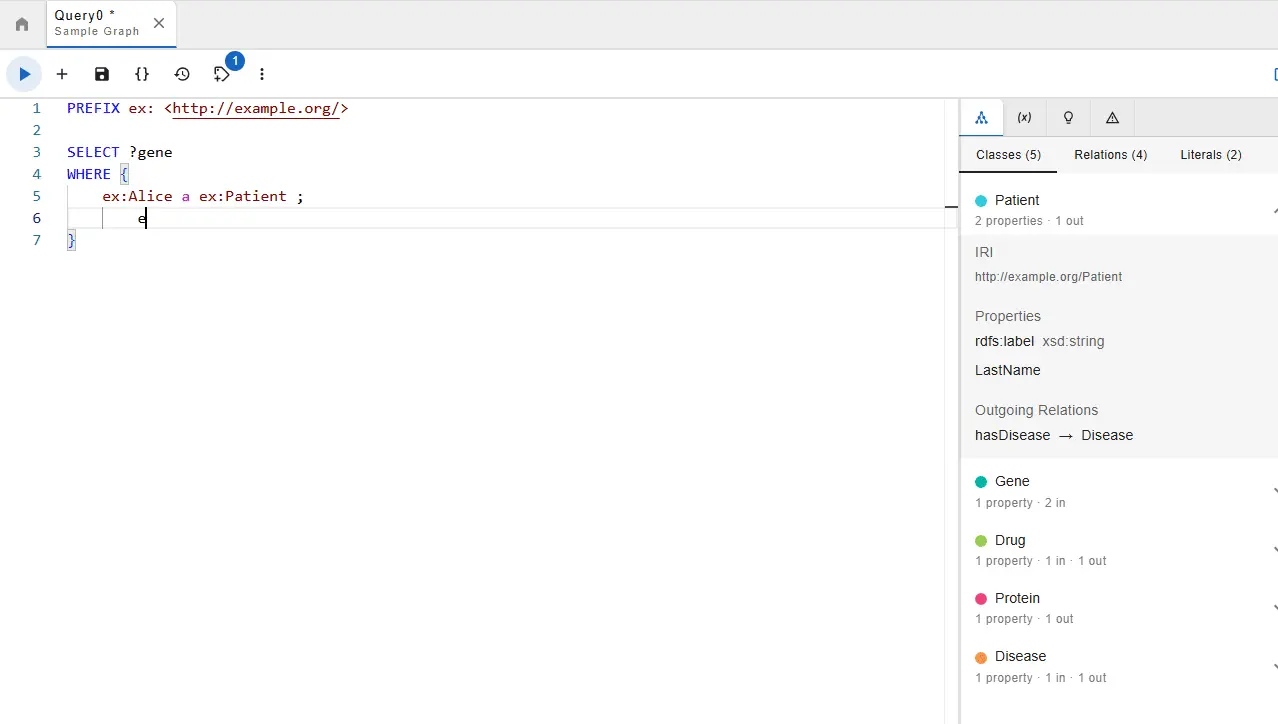
Instantly Load & View Your Data Model
It’s always important to understand and verify your data schema. This is why gdotv provides an overview of your data structure with the data model view.
For QLever, there are two methods to construct the data model. The first is that gdotv is able to directly retrieve the model, if available, using the QLever Schema API. Otherwise, gdotv can construct the data model directly from your data itself. This is always just a click away, meaning that you always have a bird’s-eye view of your vertices, edges, and properties right at your fingertips.

Modify Your QLever Graph Data Directly within gdotv
Want to adjust something in your graph? Take a hands-on approach and manage your QLever graph directly.
Using gdotv, you can directly create, modify, and delete the edges and vertices – as well as modify the properties associated with them – allowing you to make changes on the fly.
Take Advantage of Syntax Validation
Using gdotv language highlighting and syntax checking for SPARQL makes your code easier to understand and visually parse, warning you of any error that would prevent it from executing against your QLever instance.
Take Control of your Queries with the gdotv SPARQL Query Guardrails
Since RDF is fundamentally schema-optional, gdotv won’t enforce any schema against your graph. It will, however, check your SPARQL queries against the inferred schema, meaning it will automatically generate warnings if it detects potential ontology clashes.
This gives you additional insight into malformed queries, even when they execute normally against your RDF triplestore.
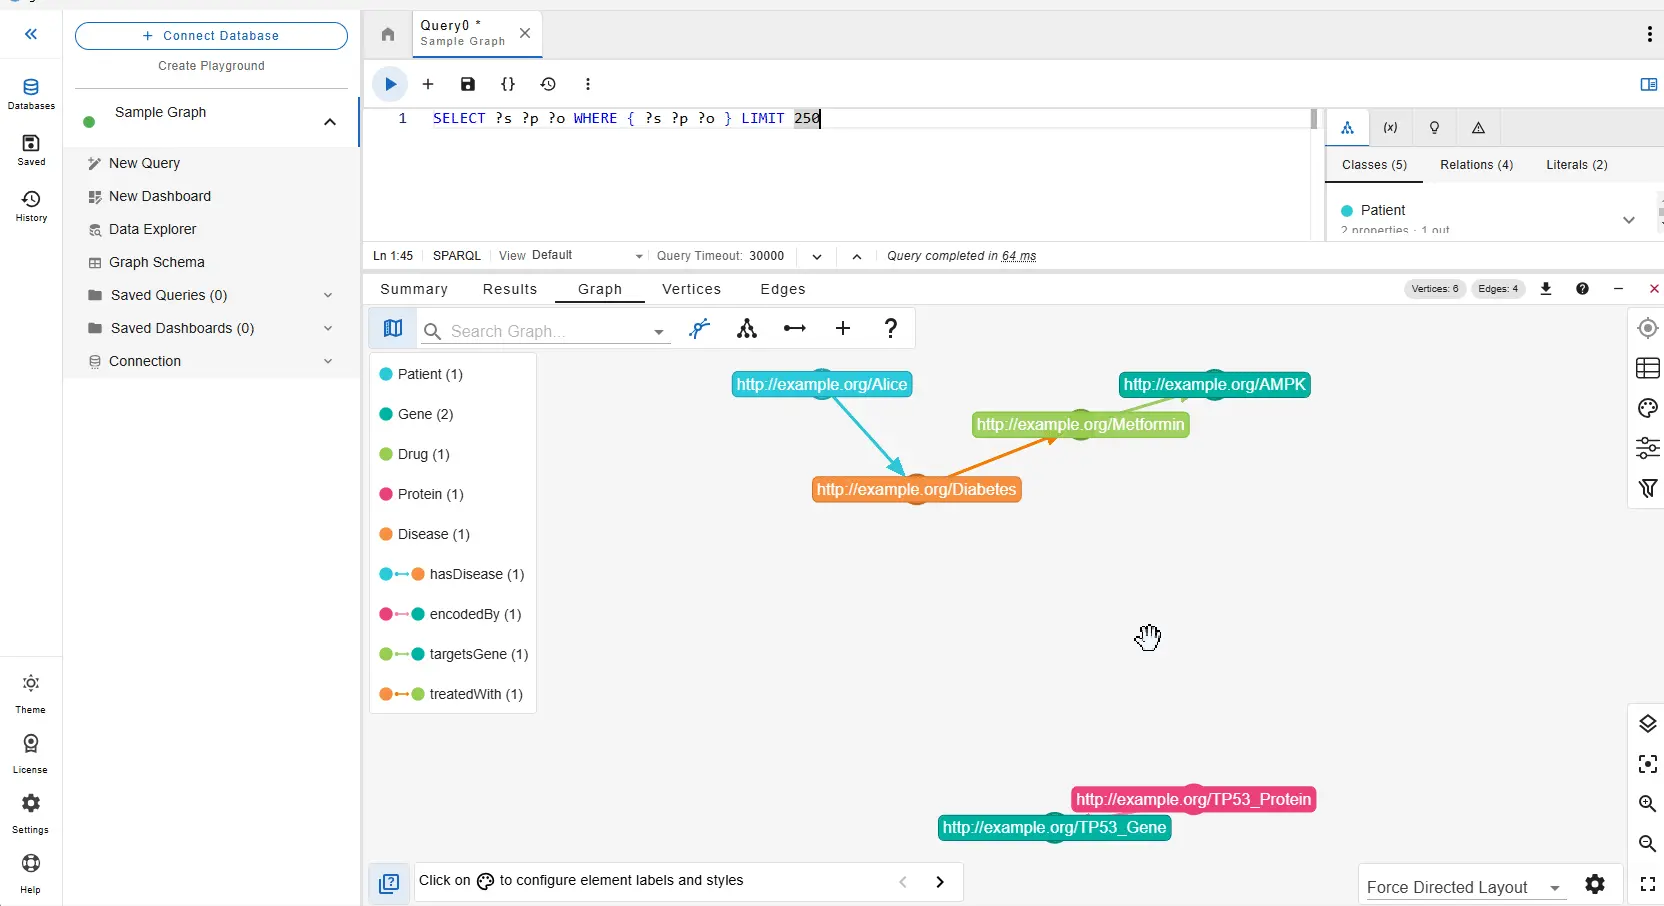
Visualization Optimized for RDF
gdotv offers graph visualization specially developed for RDF triplestores like QLever.
The nodes and edges are detected from your query results, and any literals will be interpreted as properties. To improve readability, gdotv has built in IRI shortening and prefix handling. You can customize your graph labels further using inferred schema from the graph, such as via RDFS statements.
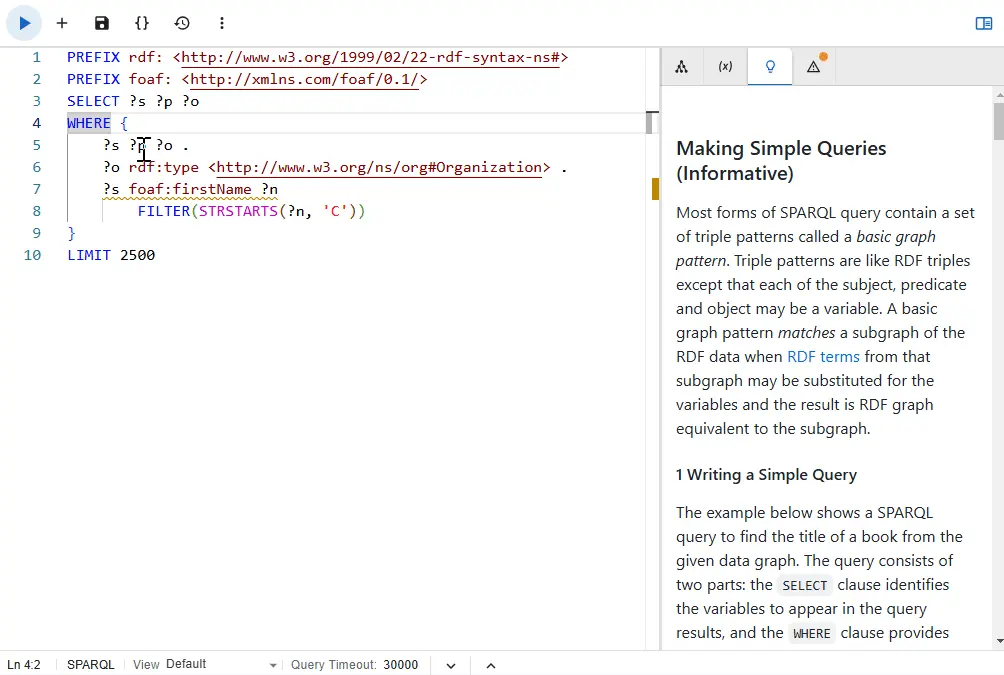
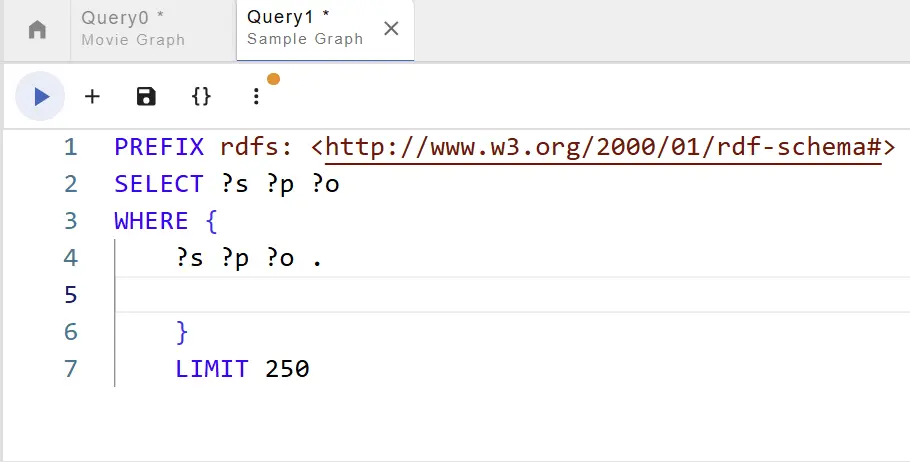
State-of-the-Art SPARQL Editor
The gdotv SPARQL code editor is the most powerful available – it offers data schema-accurate auto completion and embedded official documentation for SPARQL to give you all the information and suggestions you need to write your QLever queries faster and more effectively.
QLever + gdotv Blog Posts
![RDF Support Is Now Available in G.V() [v3.41.99 Release Notes]](https://gdotv.com/wp-content/uploads/2025/11/rdf-triplestore-sparql-support-gdotv-graph-database-IDE-1024x535.png "RDF Support Is Now Available in G.V() [v3.41.99 Release Notes]")
Frequently Asked Questions (FAQs)
gdotv: The QLever IDE
Turn your graph data into connected insights when you use gdotv to query, explore, and visualize your QLever graph database.
Sign up for a free trial today and discover how gdotv amps up your productivity as the perfect QLever IDE and graph visualization tool.
Or, prefer to talk with the gdotv team directly? Use the form below to get in touch.