Learning Graph Databases with G.V() and Practical Gremlin by Kelvin Lawrence
First steps with Apache TinkerPop and Gremlin
Are you new to Apache TinkerPop or Graph Databases in general? Are you looking for directions on how to get started with graph data and the Gremlin query language?
Then look no further than Kelvin Lawrence’s Practical Gremlin: An Apache TinkerPop Tutorial. It’s a free ebook that you can read right here from your browser. It covers the Apache TinkerPop framework and its querying language, Gremlin in great depth. Or as Kelvin describes it:
This book introduces the Apache TinkerPop 3 Gremlin graph query and traversal language via real examples featuring real-world graph data. That data along with sample code and example applications is available for download from the GitHub project as well as many other items. The graph, air-routes, is a model of the world airline route network between 3,373 airports including 43,400 routes
Practical Gremlin is packed full of example queries that will give you a comprehensive overview of the capabilities of the framework. It also discusses very concept behind graph databases and their advantages over traditional relational databases such as SQL. Each query presented in the book corresponds to a genuine use case The query description shows what the data is needed for, its format, and how it is written using Gremlin.
Practical Gremlin is much more than a book too; its Github repository contains not just the book but code samples, as well as the air routes dataset in a variety of formats, compatible for instance with Amazon Neptune.
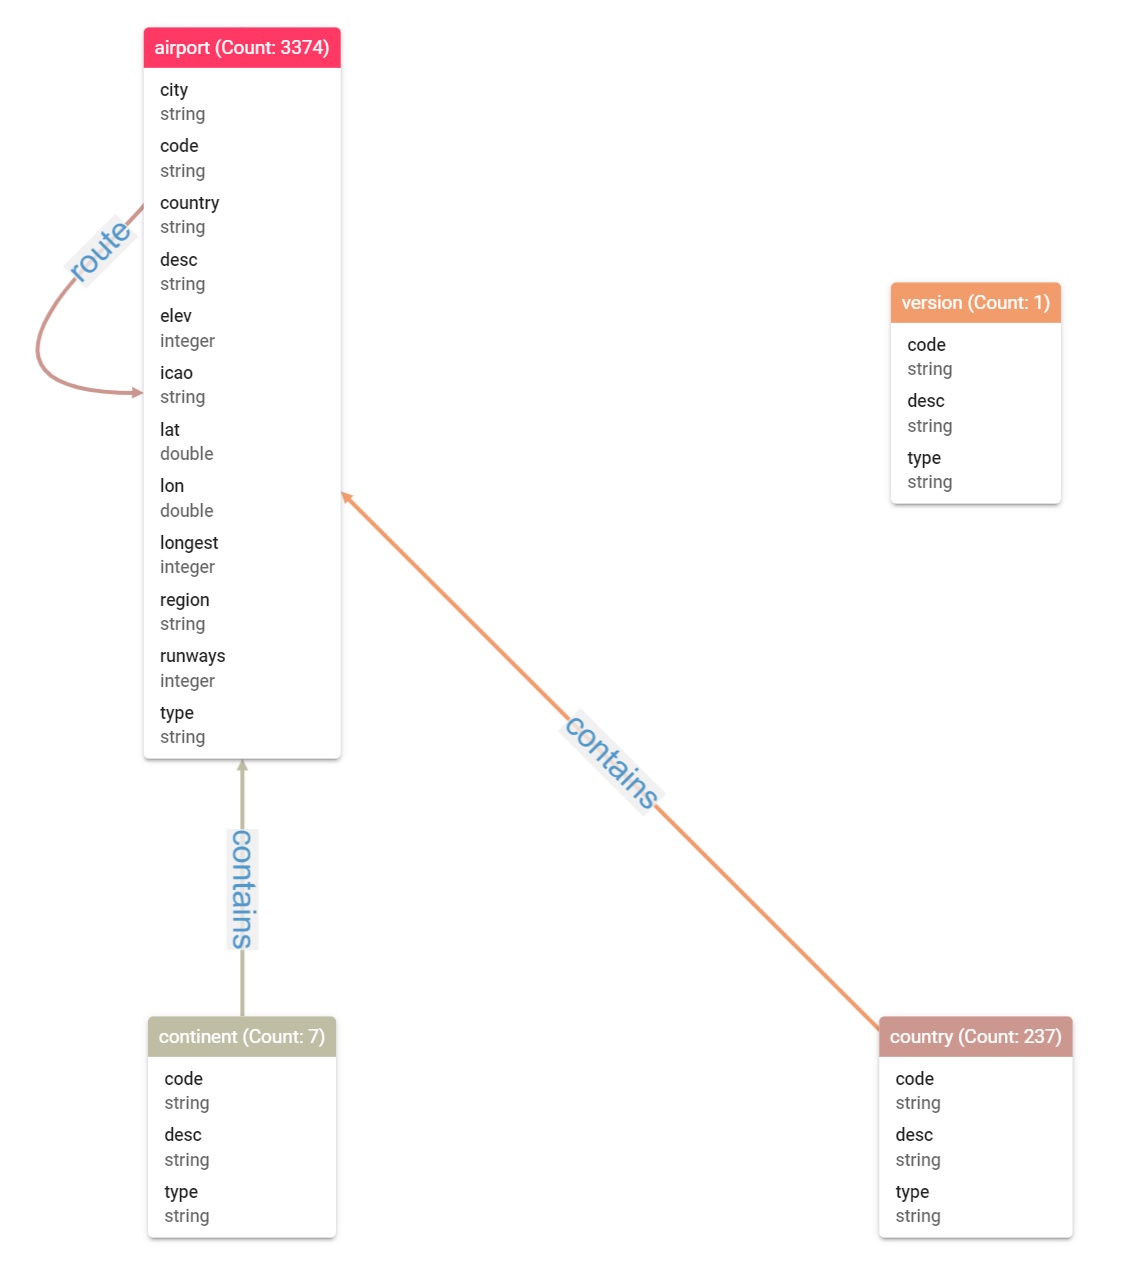
The Air Routes dataset is simple to understand and intuitive. It contains the relationship between Airports, Countries and Continents. A continent contains countries which contain airports which have air routes allowing travel between cities and countries across the world.
For reference, this is the structure of the Air Routes dataset represented as an Entity Relationship diagram using G.V()’s Data Model Explorer tool:
The graph use case is clear too, especially over the use of relational data. In order to calculate possible itineraries based on existing routes between Airports in different countries, a lot of joining operations are required. For instance when calculating all routes from Austin, Texas, USA to Paris, France, all relationships going out of Austin, into Paris, and potentially in between have to be evaluated as well. This approach would scale very poorly in SQL due to the immense amount of joining operations required. Additionally, the more hops are required in the data, the worse performance (and query structure) would get!
This works in graph because the relationships between entities are first-class entities too, the same way vertices are – you can query entities in a relational database, but you can’t directly query relationships without having to go through its entities (tables in this case, where relationships are the foreign keys).
We’ve covered the basics of our favorite Gremlin learning resource – now let’s use the best available tool (G.V() of course :D) to practice the contents of the book!
Getting started with G.V()
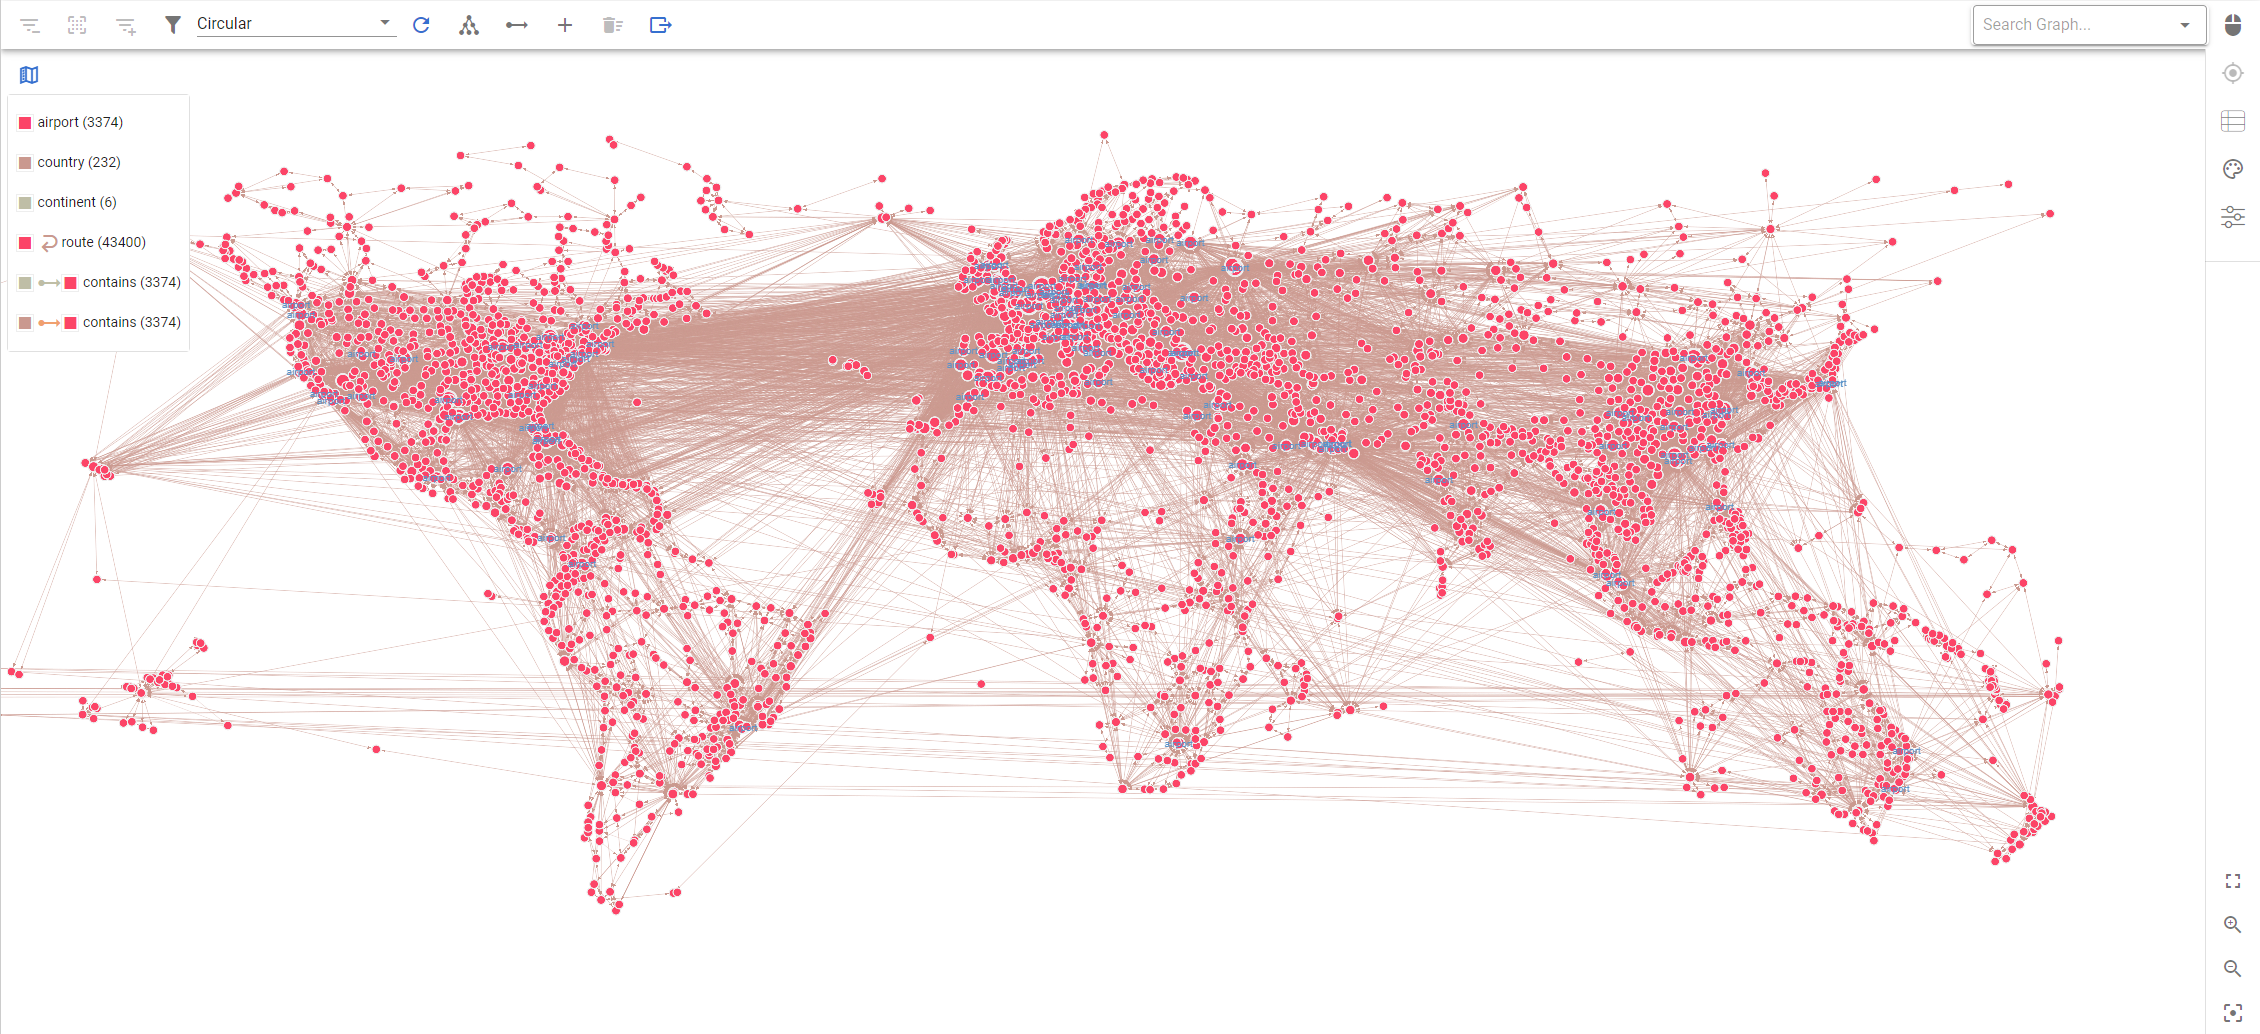
 The entire Air Routes Dataset display in G.V()’s Graph View – Now is it just me or does this look a bit like our world map?
Let’s get to work! First things first, you need to download and install G.V() – and don’t worry, this is all 100% free.
Once you’ve got G.V() installed, you’ll be presented with a Welcome Screen. We love Kelvin’s work so much that we’ve put it front and center on our application. Scroll down (if you’re on a small screen) and you’ll notice a Learn Gremlin With Kelvin Lawrence’s PRACTICAL GREMLIN section. Click on Open Practical Gremlin to open the book, if you haven’t already, and click on Create Air Routes Graph to create an in-memory TinkerGraph instance on G.V() with the air routes data set pre-loaded.
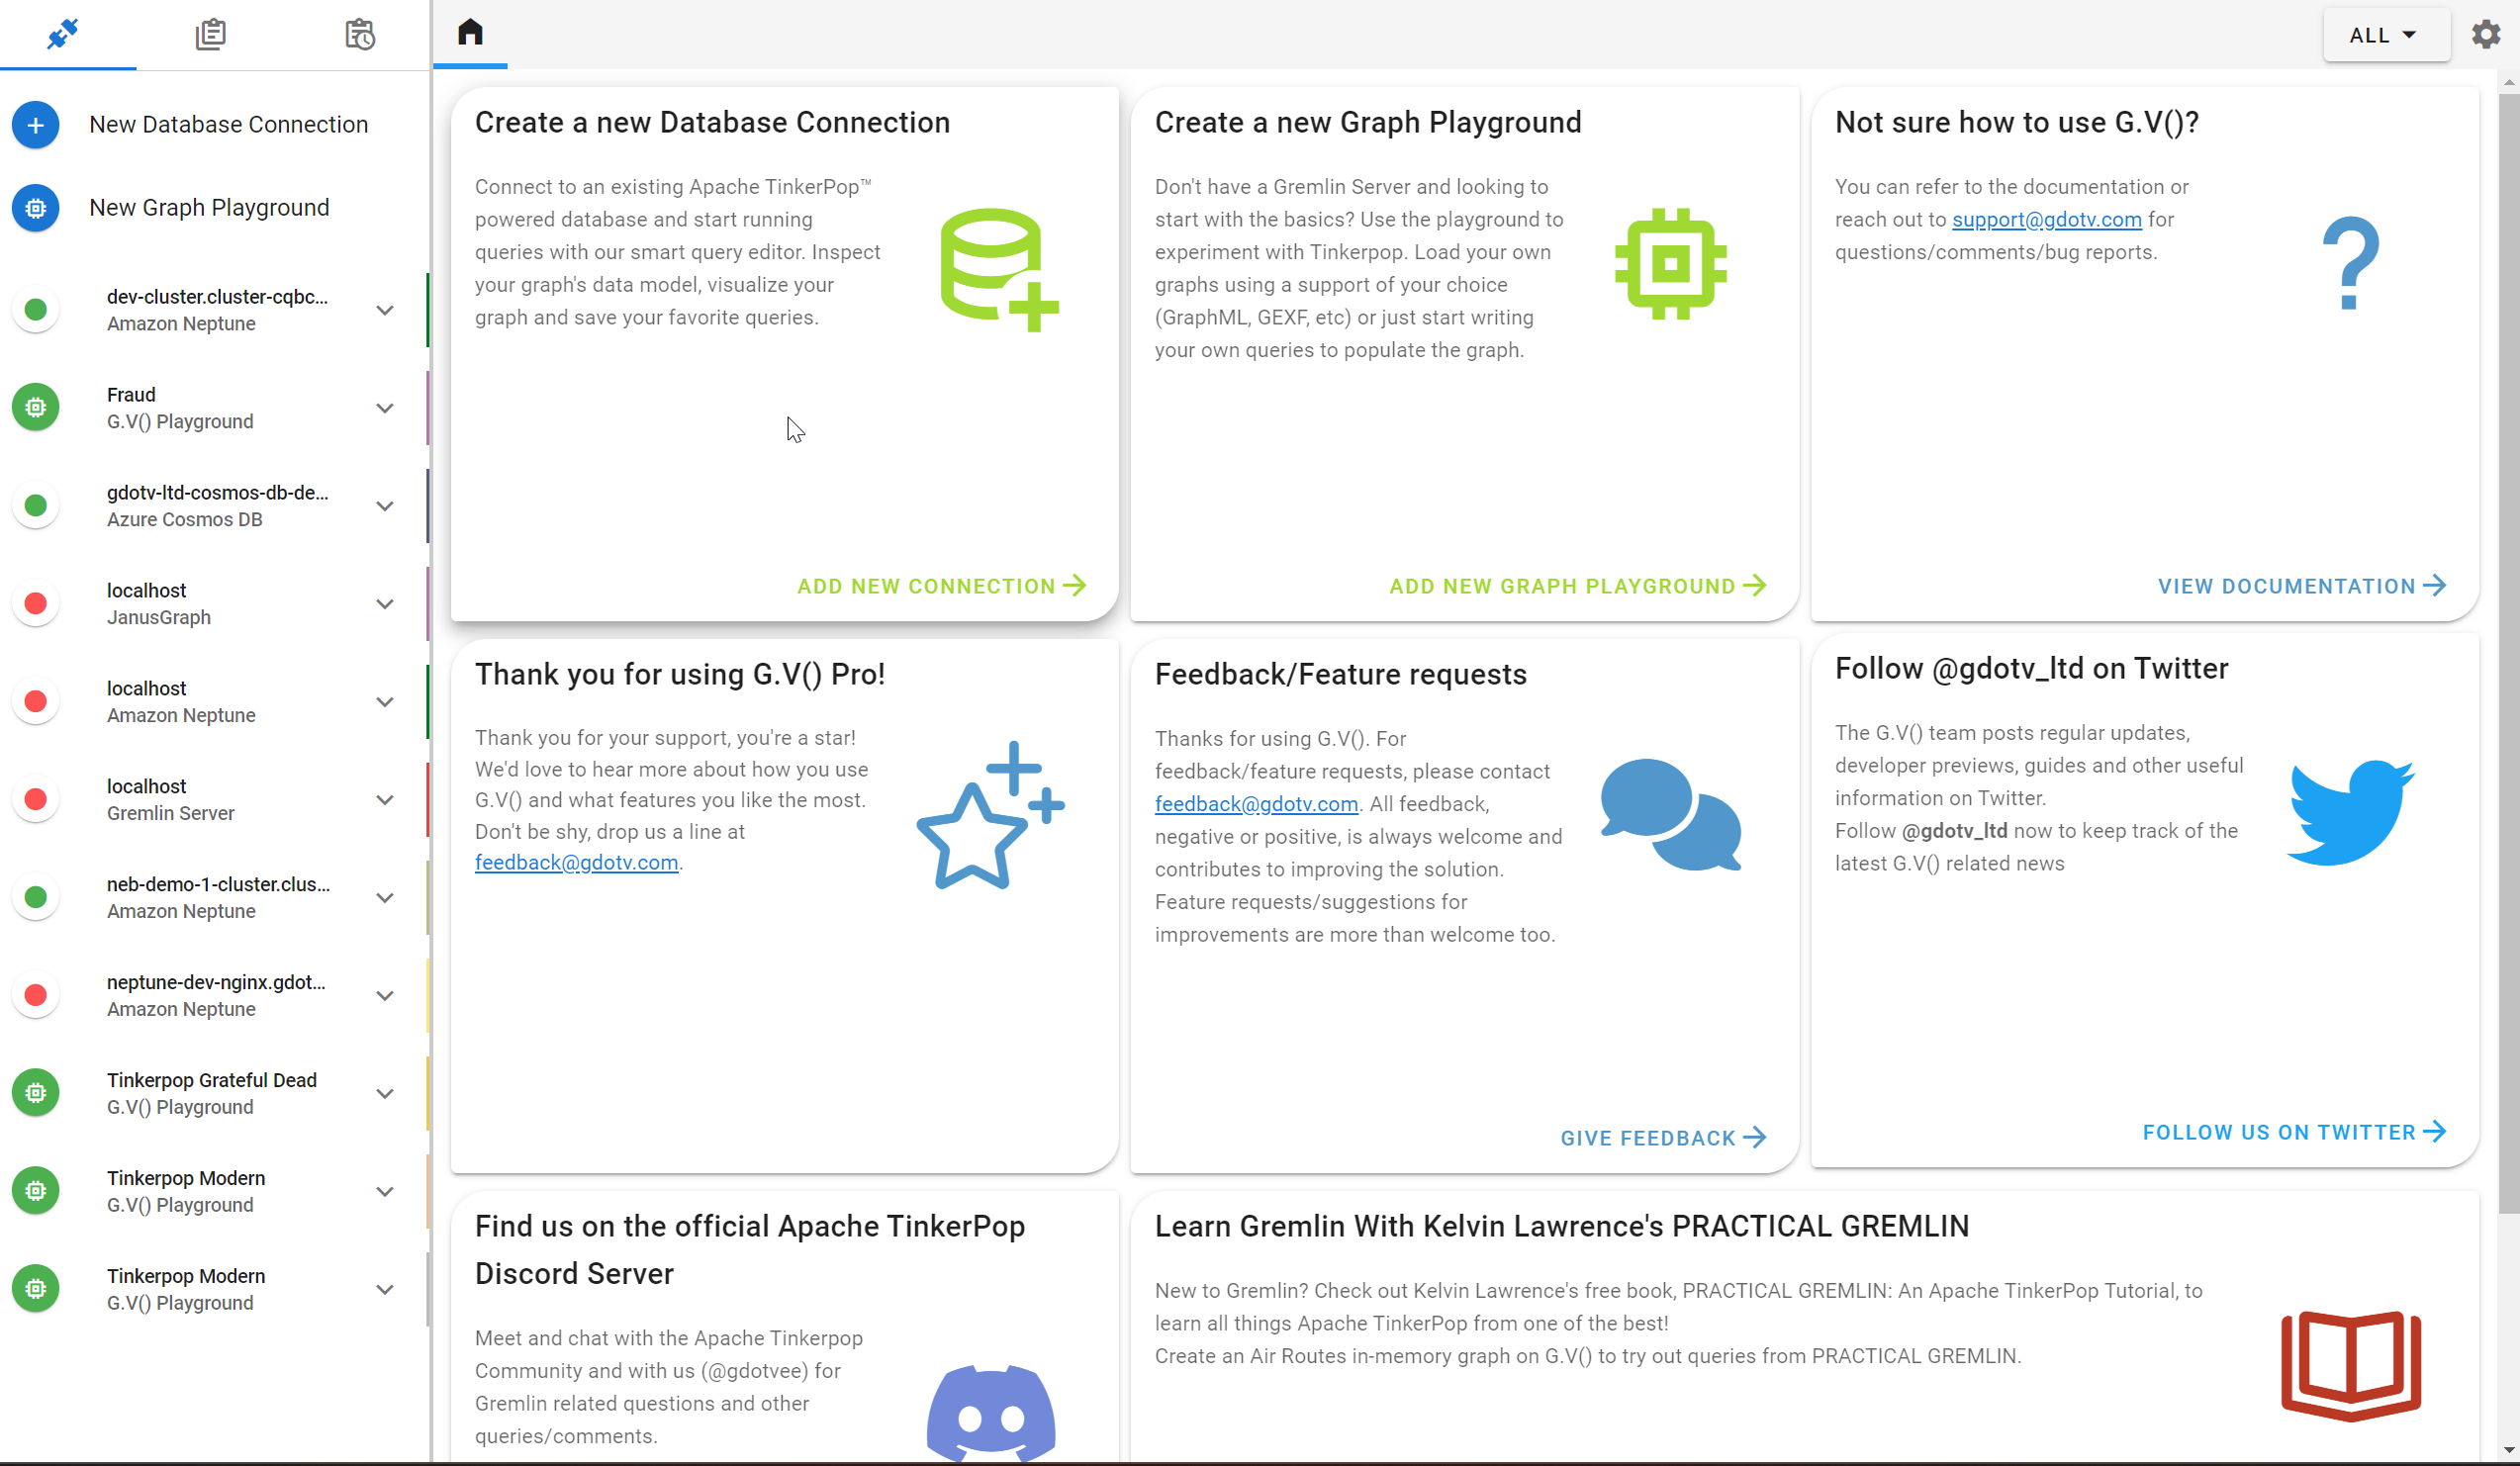
Quick editor’s note: you’ll be prompted to sign up for a G.V() Basic License – it’s free and permanent. We’re just asking for some basic details and we’ll not bother you unless you agree to be contacted by us!
Once you’ve created your air routes graph and signed up for a free G.V() Basic License, you’ll be presented with a query screen with the following query run for you:
g.E().limit(100)
This is a simple query that simply says “fetch me the first 100 edges in the database” – this allows G.V() to produce a nice little initial graph visualisation for you.
G.V() is a Gremlin IDE – long story short, it can do a lot. For the purposes of this blog post you can mostly just stick to this newly opened query tab to run queries from the book. Have a little click around the various result tabs showing (Query Output, Vertices, Edges) to get a better idea of what’s being displayed. You can also click on elements in the graph to view their details, modify their properties, etc.
Additionally, you can view your database’s graph schema by clicking “Open Data Model Explorer” on the left navigation pane. If you just want to explore the data in free form or query it without writing any actual query, you can also open a Graph Data Explorer, also in the left pane. Finally, you can open as many queries as you like, so you can easily compare them. Go ahead and click “New Query” on the left navigation pane under your Air Routes connection to create another query tab.
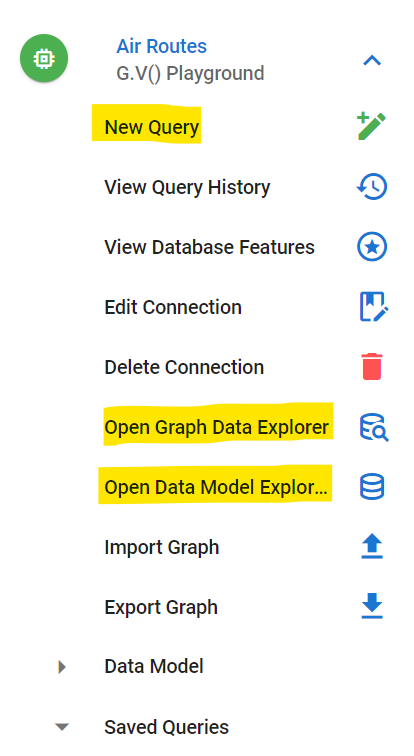
There’s a lot more functionality available but as far as this follow along with the book exercise is concerned, this should about do you! Feel free to have a play around though.
We’re all setup to follow along with the book now. Note that since we’ve already loaded Air Routes in a G.V() in-memory graph, you can just go ahead and skip section 2.6 and 2.7, but we recommend you have a read and give them a try at some point anyway! There’ll be plenty queries for you try from section 3 through to 5. Further sections of the book will give you a great start on developing a graph application, deploying a graph database, and what your options are!
Get reading, pop those queries in G.V() and give them a whirl! Try and type them manually in G.V() too so you can see our smart autocomplete feature in action!
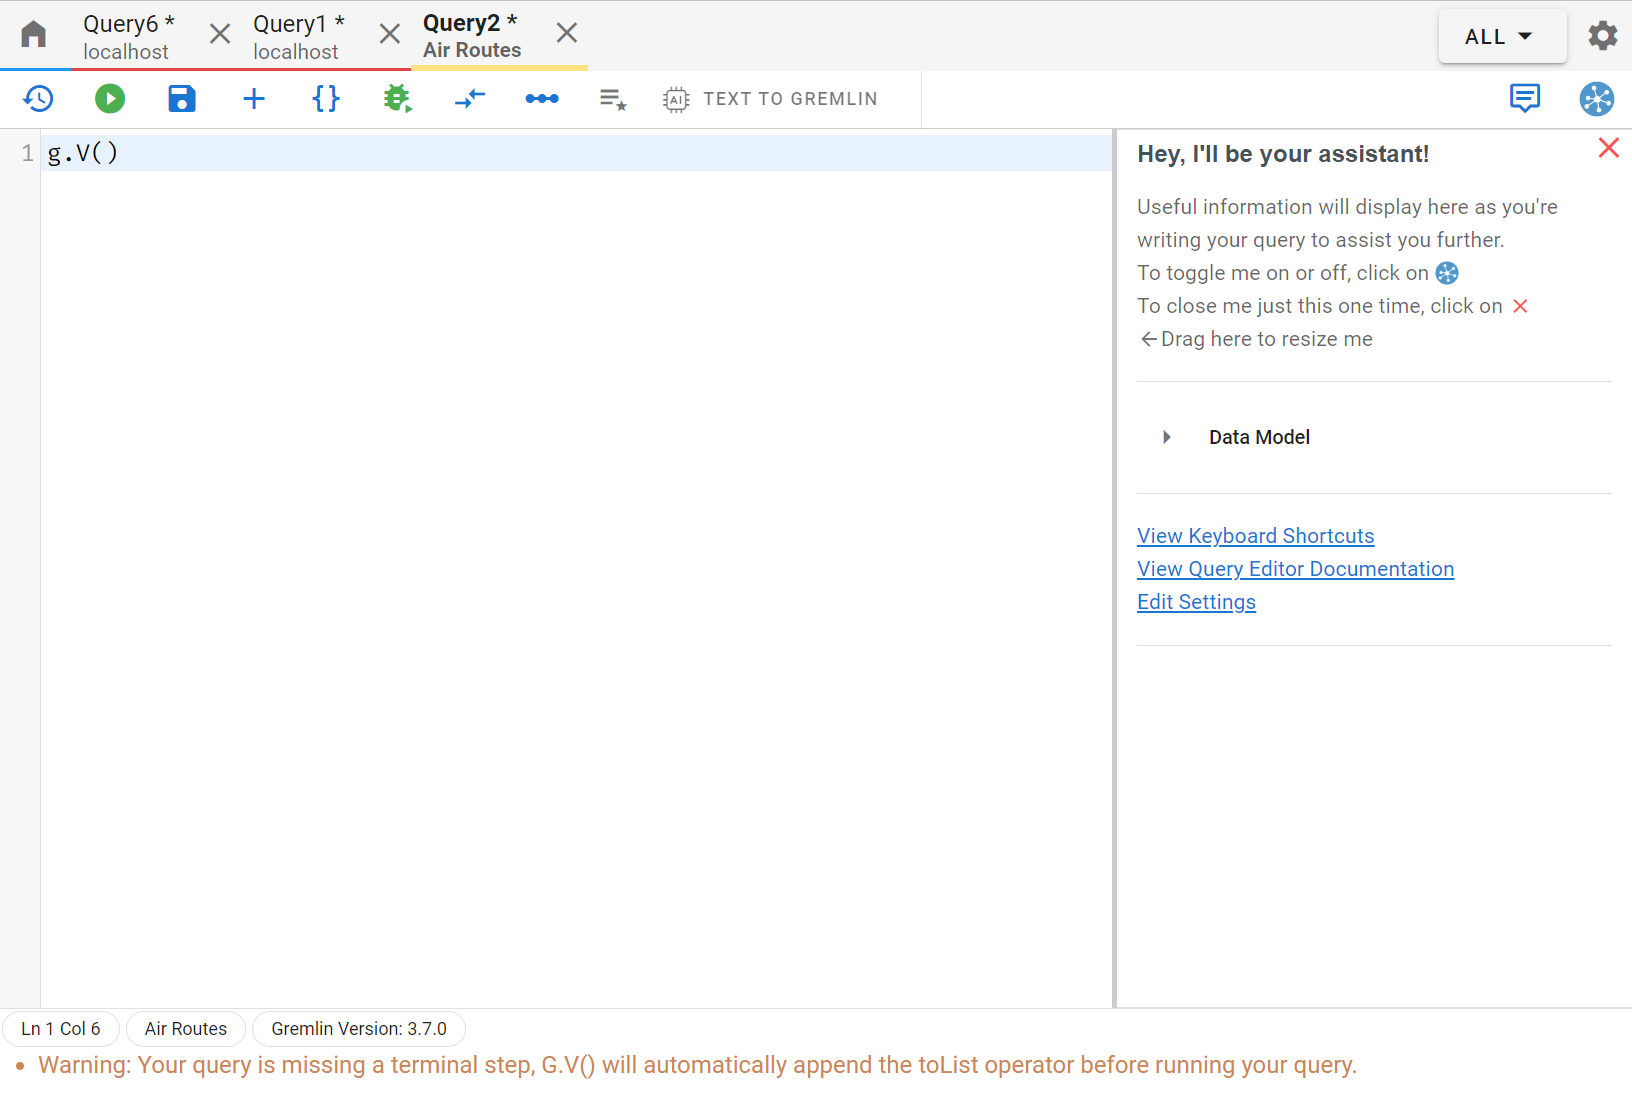
Graph Visualization Options
Here’s a few advanced configurations you can do in G.V() to improve your graph visualization. Open a graph data explorer for your Air Routes connection, as explained before, and click on Graph Styles as shown below:
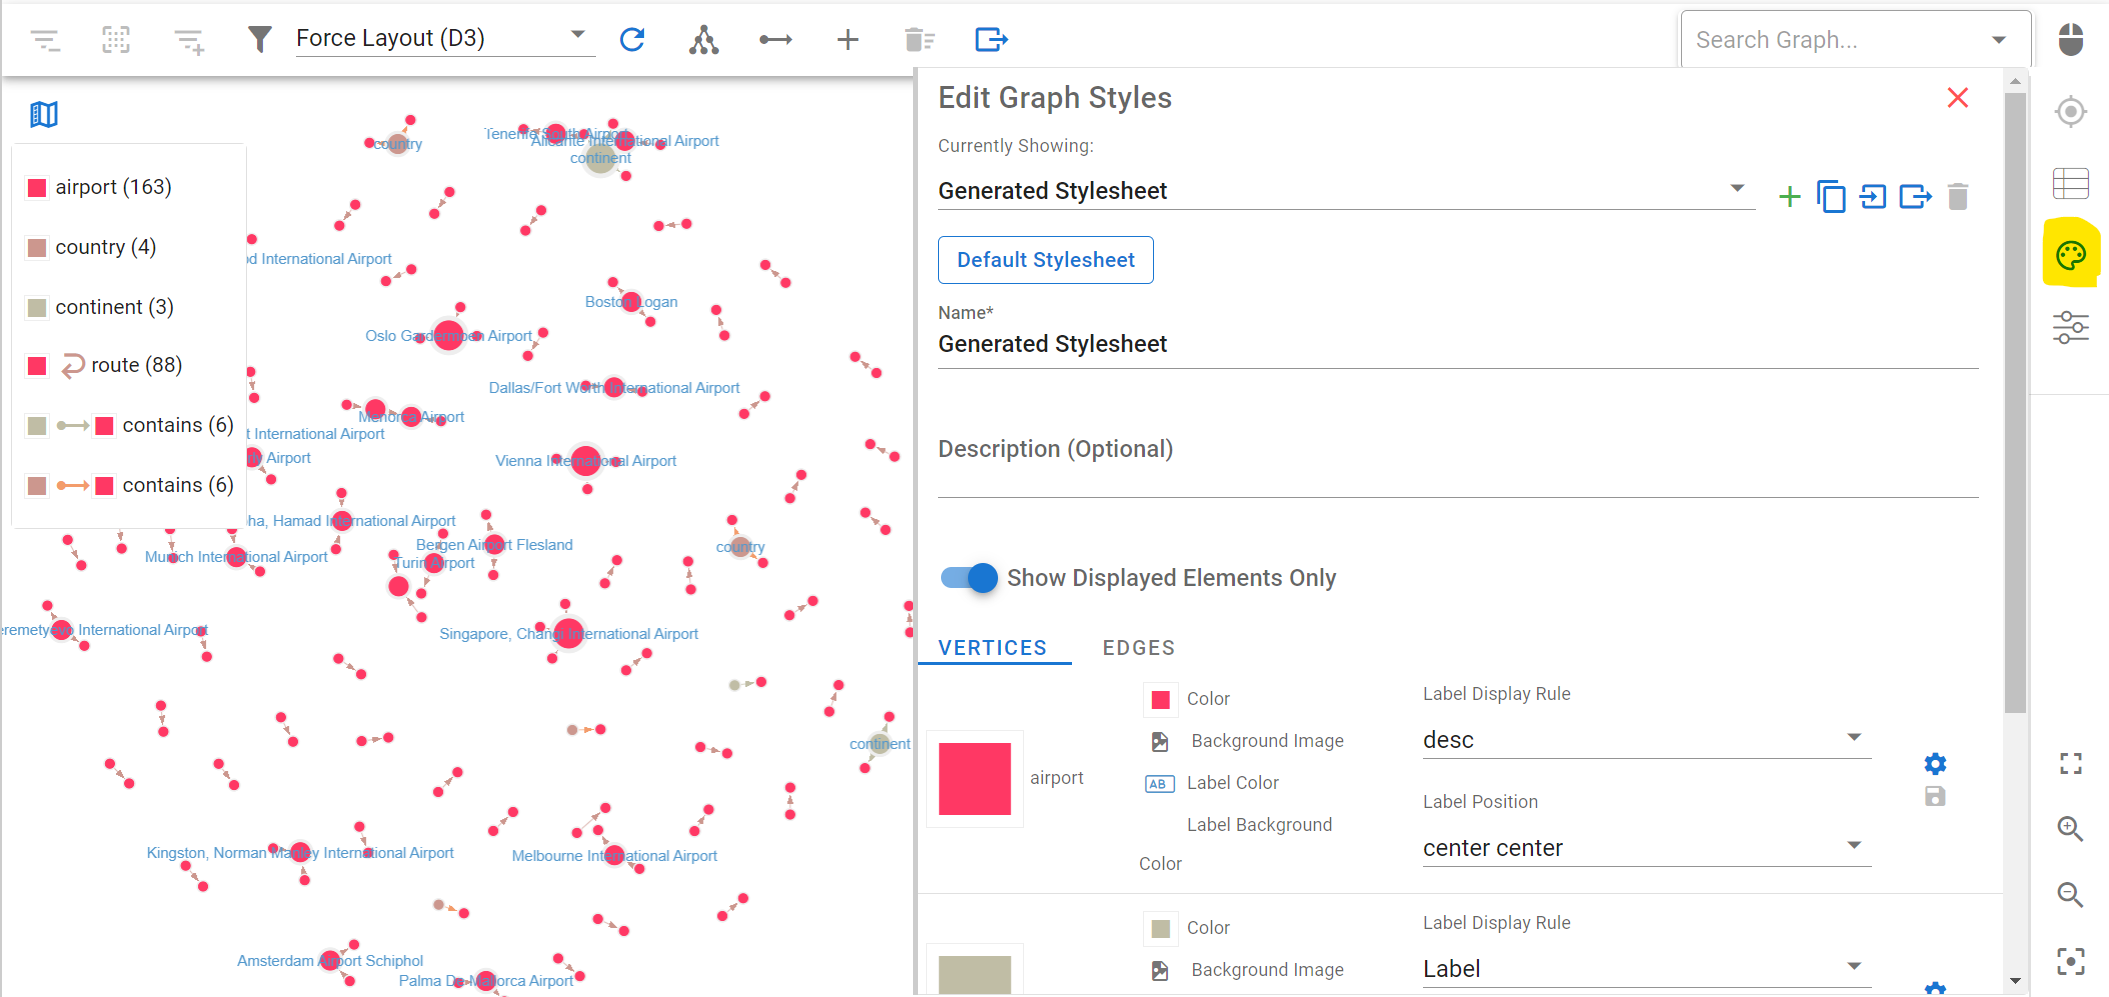
You can change the styles of your graph visualization. For instance, you can select what text to display on the vertex and edge labels. This is really useful to get quick and effective visual of your graph data. For your vertices, set the Label Display Rule value to “desc” (the name of the property in the graph containing the object’s name, e.g. country name or airport name) and click on “Save All”: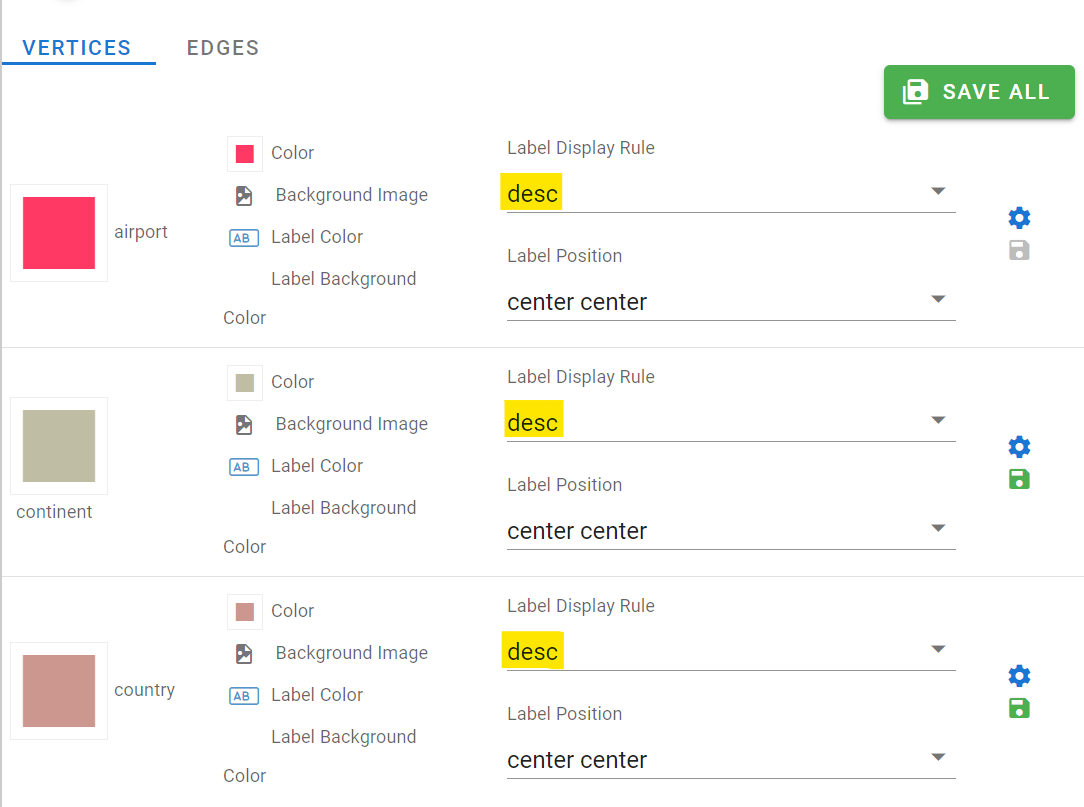
You can also set styles for your edges. Click on Edges, and for the “route” edge, select “dist” as the label display rule to display the route’s length (in miles) on the graph visualization.
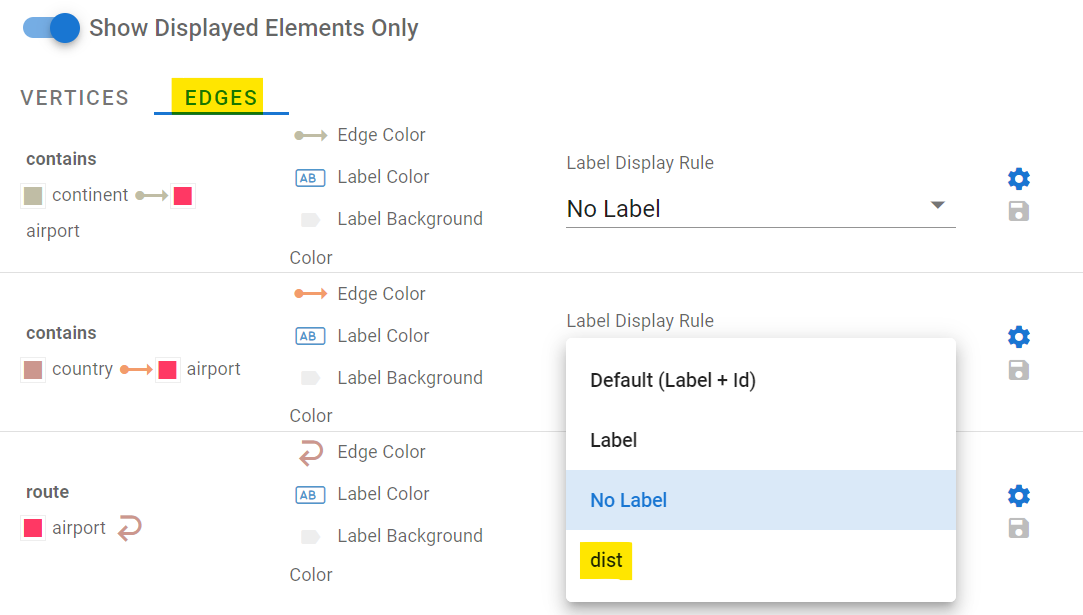
Change the label display rule and hit Save Changes again. The graph visualization will update in real time as you change these configurations. You can also create multiple stylesheets and swap between them. There’s a lot of options available which we’ll not list here, but have a play. You can even set images for your vertex backgrounds!
You can also change the graph layout algorithm displaying your data. This can be useful to de-clutter the visual and is typically highly dependent on the volume of the data on your graph as well as how interconnected it is, check it out:
Generating Gremlin queries on your dataset with OpenAI
If you’re not much in the mood for writing queries today, guess what? You can just ask an OpenAI Model to do it for you. Open a new query editor and click on “Text To Gremlin” in the toolbar. First off, you’ll need to configure your OpenAI key – check out the documentation linked in the popup on your screen for more information.
Once you’ve got your OpenAI API Key configured within G.V(), you’re ready to go. Note that you can also choose with GPT model to use – GPT3.5 Turbo , GPT3.5 Turbo 16k (useful for more complex data schemas) or GPT4.
Let’s pop some prompts in and let OpenAI work its magic:
We’ll start with the following prompt, using GPT4:
find all the routes between airports in London, Munich and Paris
It outputs the following query:
g.V().
has(‘airport’, ‘city’, within(‘London’, ‘Munich’, ‘Paris’)).as(‘a’).
out(‘route’).
has(‘airport’, ‘city’, within(‘London’, ‘Munich’, ‘Paris’)).as(‘b’).
path().
dedup().
toList()
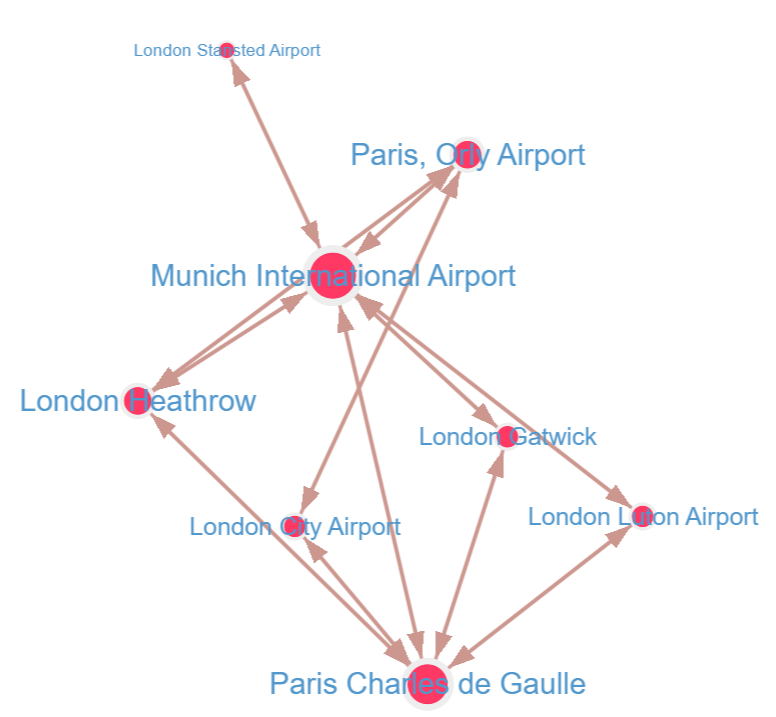
And we get the following graph display:
Comparing it to the query recommended in section 5.2.8 of Kelvin’s book, we get a similar result:
g.V().has('city',within('London','Munich','Paris')).aggregate('a').out().
where(within('a')).path()
Editor's note: taking out the by('code') from the query to allow it to output a graph visualization rather thanplaintext Airport codes
And we get the following visual:
It’s the same result! Uncanny….G.V() does a little bit of magic behind the scenes to ensure that the GPT prompt submitted to OpenAI contains the essential information it needs to generate a Gremlin query that is aligned to your graph data schema. Give it a try! It’s a great way to query your data without ever having to write a Gremlin query.
Everything else
G.V() is the most feature rich Gremlin IDE available – so we’re not covering everything it can do here. But have a look at our documentation to find out more and make sure to check our Blog regularly too for new content demonstrating the capabilities we have in store. We have monthly new feature releases so you can be sure there’ll always be more for you to do on G.V()!
Conclusion time
Graph databases are great – they’re still relatively new compared to titans such as SQL and that means it can be hard to unlearn years or relational data reflexes. Kelvin Lawrence’s Practical Gremlin: An Apache TinkerPop Tutorial is a great way to learn more about Graph Databases, Apache TinkerPop and the Gremlin query language. With G.V(), you can enhance your learning experience and start seeing the concrete benefits of using a graph database with cool visuals and features to match with your data, at no cost.
There are other learning resources available too of course – many of them just as great, for instance, Apache TinkerPop’s own Getting Started guide!
Who knows, with a bit of practice and learning you might find yourself developing and deploying your graph database to one of our many supported graph systems (Aerospike Graph, Amazon Neptune, Azure Cosmos DB, JanusGraph, and more)!
Did you like this post? Share it around and tell us your thoughts below!



![Amazon Neptune 101: Creating & Connecting to Your First Cluster [Developer Walkthrough] Amazon Neptune 101: Creating & Connecting to Your First Cluster [Developer Walkthrough]](https://gdotv.com/wp-content/uploads/2025/06/amazon-neptune-graph-database-developer-guide.png)