Fast, scalable graph querying and visualization with Kuzu and G.V()
")
Introduction
In a recent G.V() release, we announced our integration with Kuzu — an open source embedded graph database. In this post, we’ll dive into Kuzu’s core query capabilities and demonstrate how it pairs nicely with G.V()’s rich visualization tools.
Kuzu is built for speed, and you can feel it when using it with G.V() — every query finishes running faster than you can blink. We’ve sampled quite a few datasets and tried path queries of up to 30 hops, all running at milliseconds scale.
According to the Kuzu team, this performance is the result of techniques such as novel join algorithms, columnar storage, and vectorized execution that the team developed. It also requires strict types on node and relationship properties, which allows it to take advantage of the graph’s structure to optimize for speed.
Embedded Graph Database
Kuzu is an embedded graph database—meaning it runs directly within your application, without requiring a separate database server. This architecture, combined with its high-performance query engine, makes it a great fit for analytical graph queries. Below are some of its characteristics worth learning more about.
Usability
Kuzu supports the Cypher query language and can run in-process, in memory, or even in-browser via WebAssembly. This enables a lightweight setup with minimal dependencies and no server management overhead.
Interoperability
It’s designed to integrate with a wide range of data formats and external systems. It supports Parquet, Arrow, CSV, and JSON, and provides connectors for external databases such as DuckDB and PostgreSQL, as well as data lakes (Iceberg / Delta Lake).
Open source
Kuzu is open source and released under the permissive MIT license, making it easy to adopt for both commercial and proprietary applications. You can explore the project on GitHub.
Querying your Kuzu database in G.V()
To show G.V() and Kuzu working together, we’ll use the Connected Data London (CDL) Knowledge Graph Challenge dataset, which includes event transcripts, metadata, speakers, talks, and associated tags. The source data and code to create the graph in Kuzu is available here. We’ve already used the source code in the src/kuzu directory to populate a local Kuzu database that we can then use G.V() to query and analyze visually.
Since Kuzu databases are just directories on disk, connecting to one in G.V() is straightforward:
- Click “New Database Connection”
- Select “Kuzu” from the list of options
- Point to the full path of your local Kuzu database
You can choose between read-only or read-write mode. For this demo, we’ll use read-only mode. After selecting it, G.V() will display the Kuzu database version upon testing the connection.
Once connected, G.V() provides a default Cypher query for quick exploration:
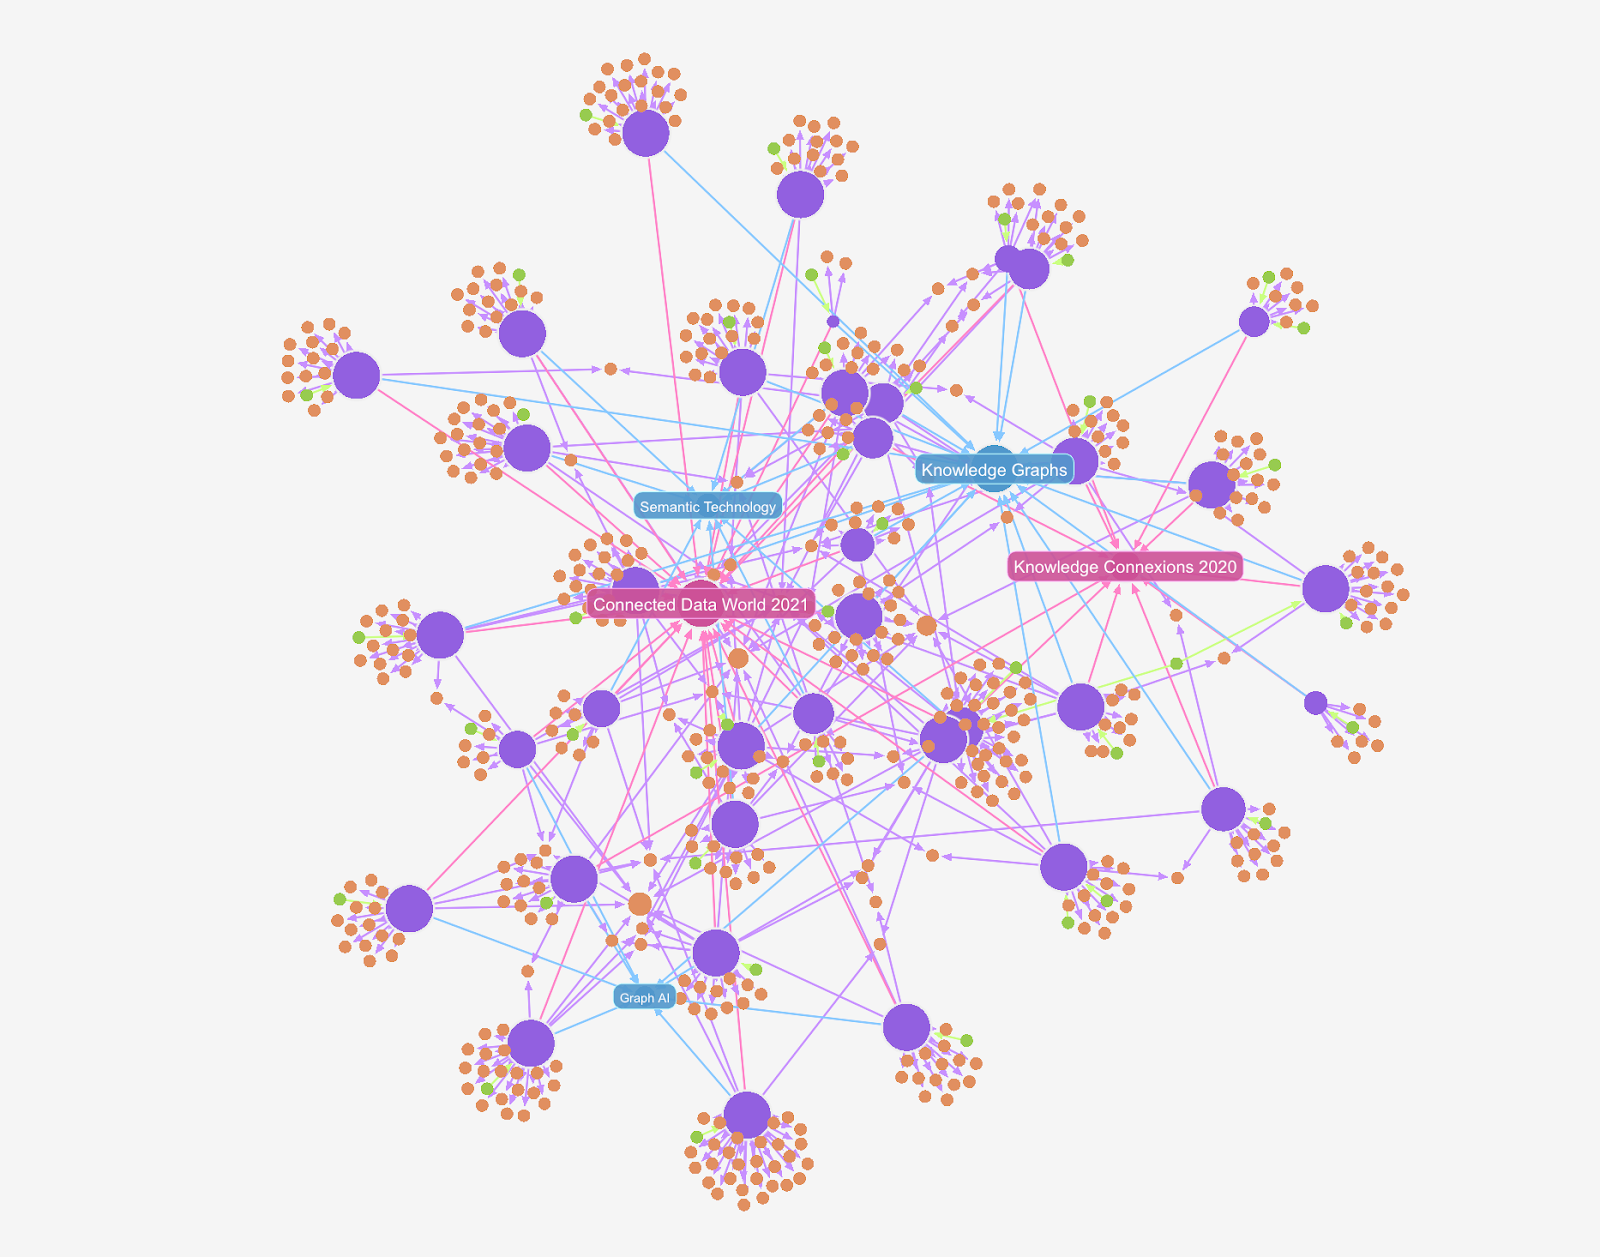
MATCH p=()-[]->() RETURN p LIMIT 100
This undirected path-finding query returns a subgraph with up to 100 paths. In the CDL dataset, this quickly reveals a graph of speakers, categories, events, talks, and the relationships between them.
To better understand the graph structure and available properties for querying, you can use the “View Graph Data Model” option in the left sidebar. The schema view shows details like the name property on Speaker nodes and various properties on Talk nodes. Since Kuzu uses a property graph model, relationships can also have properties—making it easier to write expressive Cypher queries over both structure and attributes.
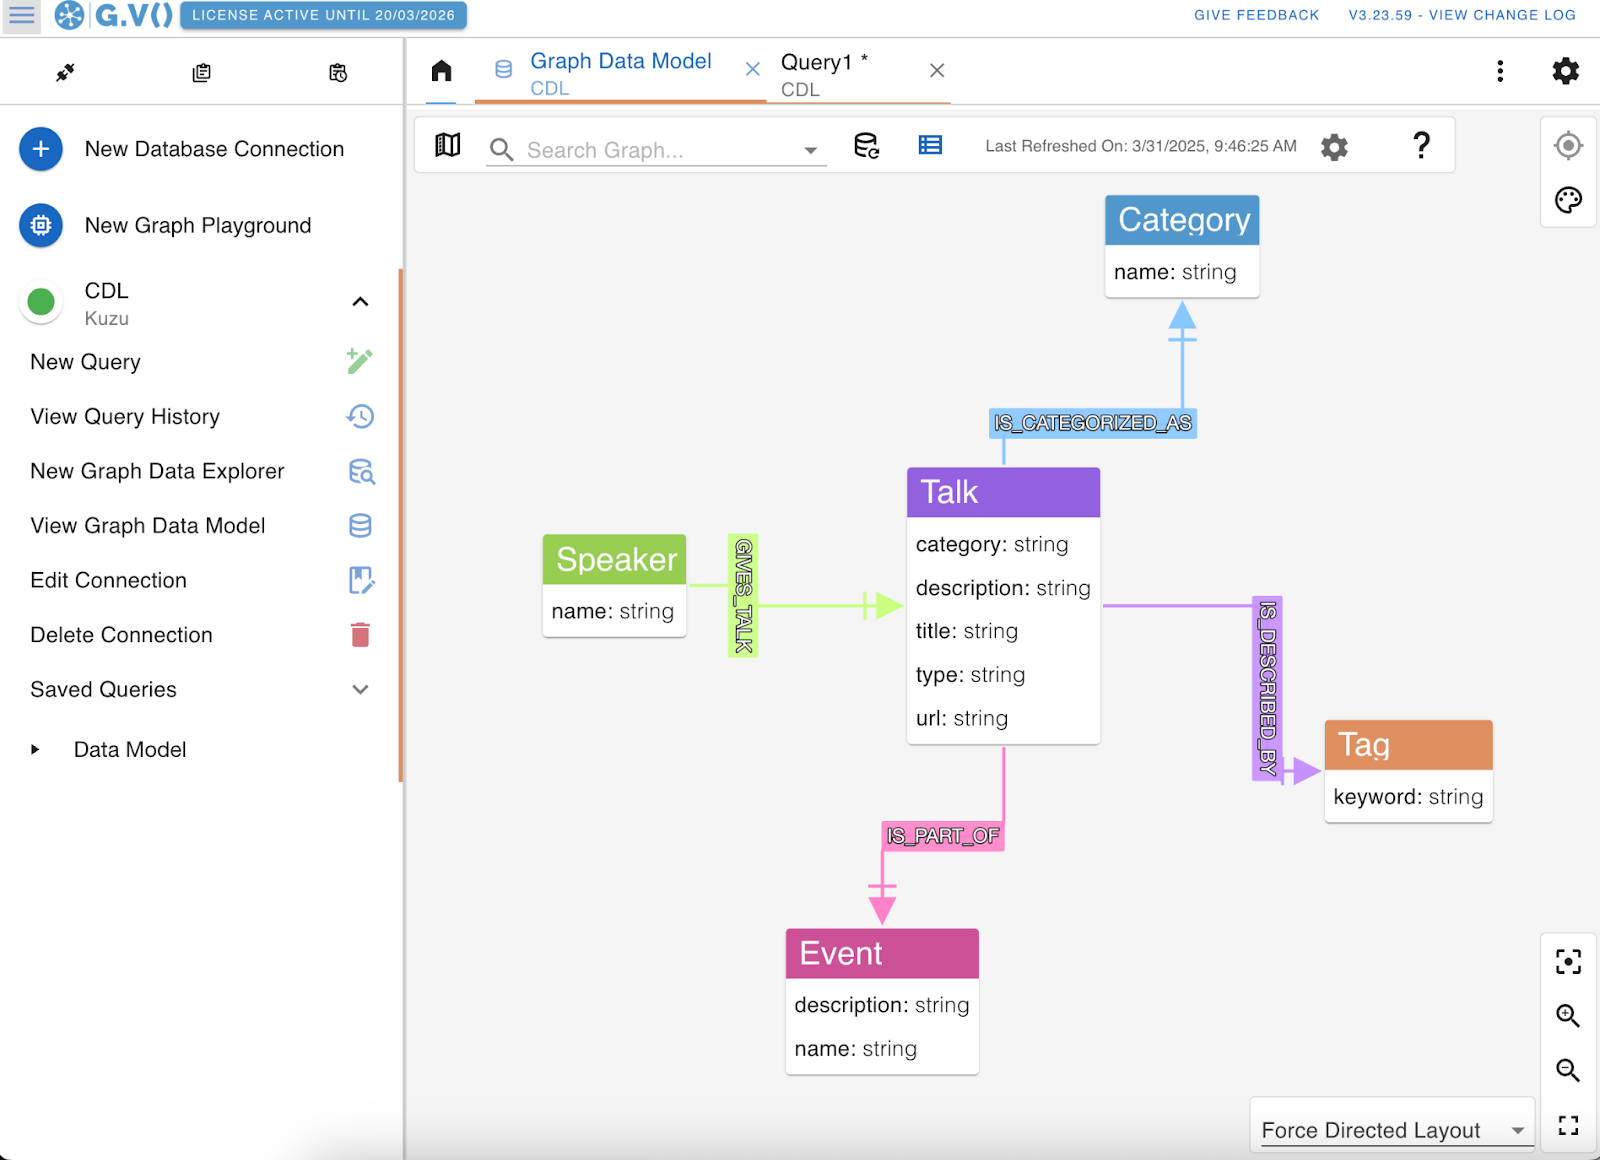
The Connected Data London Knowledge Graph (CDKG) contains data about two past events, “Connected Data World 2021” and “Knowledge Connexions 2020” with talks, speakers and keywords tags that describe the topics of the talks. Let’s use G.V() to uncover some insights.
Which speakers gave the most talks?
MATCH (s:Speaker)-[r:GIVES_TALK]->(t:Talk)
RETURN s.name AS speaker, COUNT(t) AS numTalks
ORDER BY numTalks DESC LIMIT 1;
[ {
“speaker” : “Atanas Kiryakov”,
“numTalks” : 2
} ]
Which talks in the event “Connected Data World 2021” have the keyword “RDF”?
MATCH (e:Event {name: $event})<-[r1:IS_PART_OF]-(t:Talk)-[r2:IS_DESCRIBED_BY]->(tag:Tag)
WHERE lower(tag.keyword) = lower($keyword)
RETURN t.title AS talkTitle, t.category AS category;
[ {
“talkTitle” : “Applying Semantic Web Standards for Knowledge Representation at Elsevier”,
“category” : “Semantic Technology”
}, {
“talkTitle” : “Knowledge Graphs: Moving Beyond RDF”,
“category” : “Knowledge Graphs”
}, {
“talkTitle” : “How a Knowledge Graph Can Support Advanced Price Analytics in Supply Chain Management”,
“category” : “Knowledge Graphs”
}, {
“talkTitle” : “One graph to bind them all! Linking data & apps for event-driven interoperability”,
“category” : “Knowledge Graphs”
}, {
“talkTitle” : “Graph Abstractions Matter”,
“category” : “Semantic Technology”
}, {
“talkTitle” : “RDF Leveled the Advantages of LPG and Keeps 3 Key Benefits: Standards, Semantics & Interoperability”,
“category” : “Semantic Technology”
} ]
It’s easy to write Cypher queries in the G.V() editor to analyze paths, run aggregations, and dig into your graph. The built-in autocomplete makes the whole process quick and smooth.
As can be seen, it’s simple to enter Cypher queries in the G.V() query editor to answer questions involving paths and aggregations. G.V()’s autocomplete options make this super easy:
Custom Graph Layouts
One of the benefits of using G.V() with Kuzu is the ability to easily apply custom graph layouts—even for large visualizations with thousands of nodes. In the example below, we show a horizontal tree layout to visualize paths connecting events, talks, and speakers.
At a glance, it’s easy to see that only a few talks are about the topic “Graph AI,” while many more are about “Knowledge Graphs.” The speaker nodes (shown in green) reveal that just one speaker, Atanas Kiryakov, was at both events—visible from the grey edges coming from a single green node connecting to both right and left side.
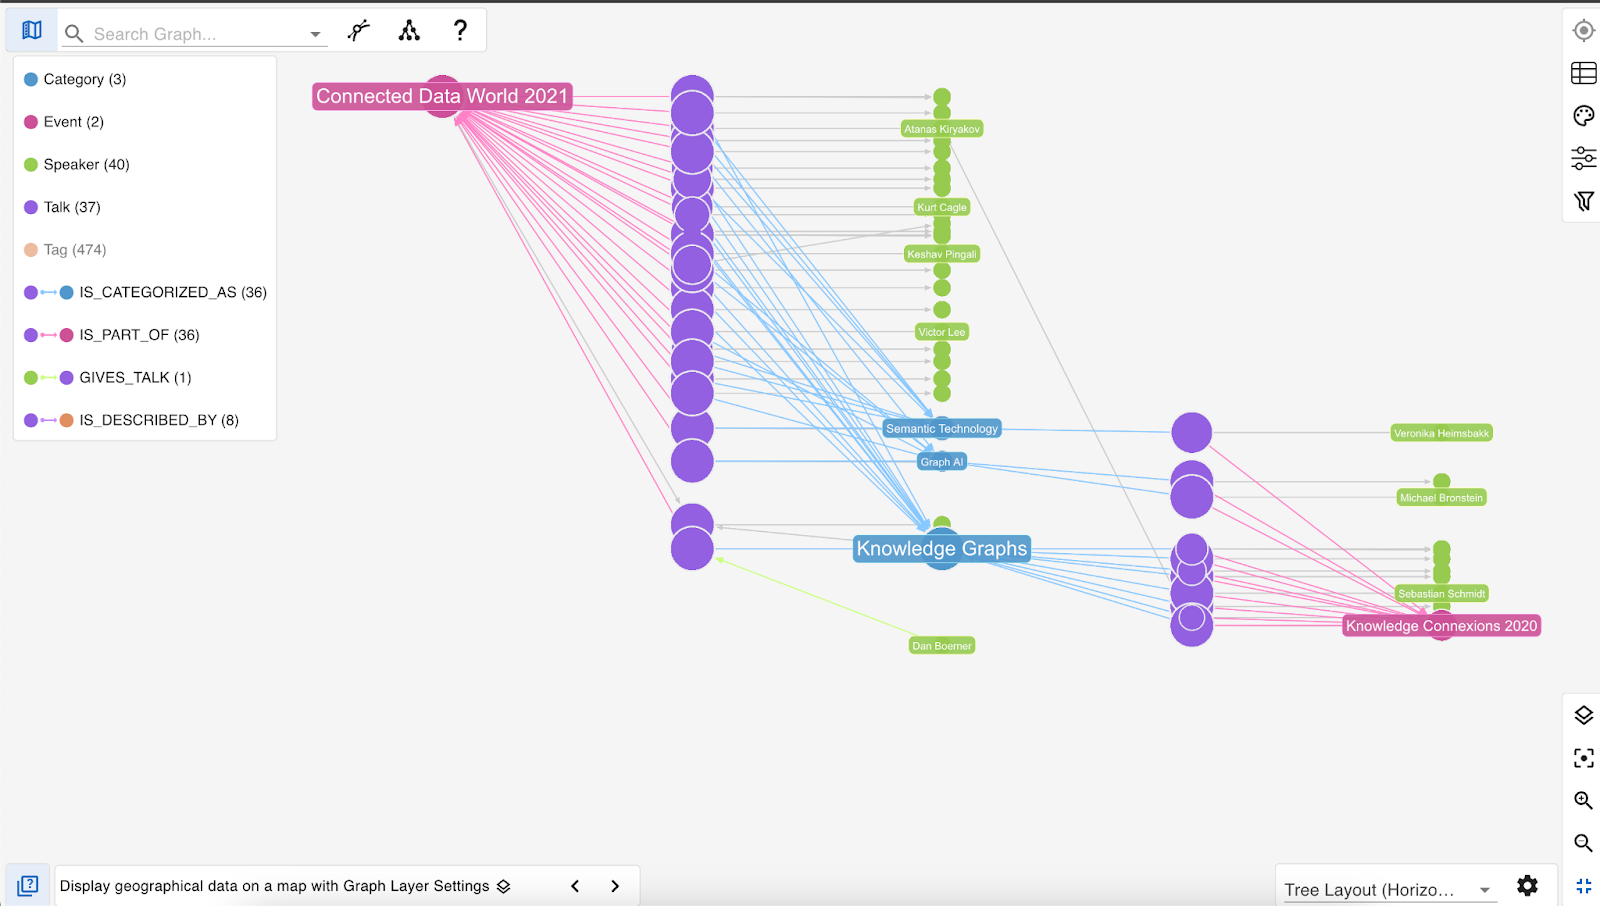
Using G.V()’s custom layout options, it becomes much easier to spot notable patterns and insights in your graph data.
Conclusion
Kuzu is an open source, superfast, embedded graph database that works beautifully with G.V(). It’s also entirely free to use, and evolving rapidly. If you’re looking for a cost-effective alternative to cloud-hosted graph databases, without compromising on usability or visualization capabilities, we think this is a winning duo.
We’re continuing to enhance G.V() with even more usability features for Cypher-based databases—stay tuned!


