Why is GraphRAG so hard? Find out in this Neo4j Fujitsu knowledge base

I asked Fujitsu’s open-source GraphRAG pipeline what stops the Ubuntu Live CD installer from running, a question its own Neo4j knowledge graph holds the answer to. It generated valid Cypher, retrieved nothing, and replied: “I don’t know the answer.” Figuring out why requires a deep dive into the foundations of how GraphRAG works. Today I’ll take a closer look at the Knowledge Data pipeline devised by Fujitsu.
This Knowledge Data pipeline is an example of GraphRAG system built on top of a Neo4j graph database. Fujitsu is a well-known Japanese multinational, and one of the largest IT companies in the world, and have released this pipeline as an open-source tool for those interested in GraphRAG.
The idea is that this repository will showcase their system applied to a number of graph databases, most of which are targeted at Root Cause Analysis. Today, I will examine one of these graphs, inspect it with gdotv, and then run the GraphRAG pipeline to see how it behaves. As we’ll see, optimal methodology for GraphRAG isn’t yet solved, but this pipeline is an interesting conceptual demo.
But first, let’s talk about GraphRAG! We’ll discuss the general principles, the implementation, and then we’ll take a look at the actual knowledge graph.
The Problem with RAG
Given appropriate instructions, compute and context, LLMs are now able to synthesize information and trigger many computational tasks in a convincingly human-like manner. This knack for mimicry, coupled with speed, suggests that they may plausibly provide useful functions in human society. That said, the inherently non-deterministic nature of LLMs creates a fundamental limit on the ability to predict their behavior, which compromises their reliability as computational tools. The lack of any generalized accountability mechanism further complicates the picture when entrusting LLMs with important tasks, including information retrieval.
Retrieval-Augmented Generation (RAG) can and does significantly align LLM outputs more closely with trusted sources. However, even when overall LLM behavior is largely ‘accurate’ i.e. aligns closely with trusted sources, accountability issues remain intractable. Generally, the only method to verify the accuracy of any given LLM output, for most users, is to manually compare each LLM output with the trusted source on a case-by-case basis. Doing so is frequently time-consuming, and can easily negate efficiency gains of LLM use in the first place. Neglecting to do so means accuracy cannot be guaranteed by the user.
Of course, the significance of this observation depends on the application. The unpredictability of unchecked LLM behaviour may be considered an acceptable risk if the incidence and consequence of bad behavior is sufficiently low. In these cases, errors without attribution may be accepted as instances of bad luck, like poor weather. In many high-impact domains, such as government, healthcare, and engineering, the consequences of even slight failure can be extremely high. In other domains, the minimum allowed level of unpredictability may be negotiable.
In any case, regardless of how much non-deterministic behavior is judged acceptable in any given information retrieval system, the optimal methodology to minimize such behavior is still an open problem. All domains considering RAG integration in any form have a vested interest in improving the accuracy and efficiency of RAG systems. It is to address this interest that GraphRAG solutions have been proposed.
What GraphRAG adds to RAG
GraphRAG, described here, combines RAG technologies with graph-based connections that LLMs can parse in fewer tokens than lengthy documents. Though GraphRAG does not inherently improve accuracy by itself, graphs have two features that can increase accuracy of the LLMs which use them.
The first is that graphs represent connections between information directly via encoded relationships. An LLM which can traverse these relationships well is able to access relevant information more quickly without ingesting large amounts of irrelevant context. The second is that graphs can directly encode the nature of relationships. For example an error can be linked to its cause. This semantic structure lends itself naturally to logical reasoning. Though LLMs cannot actually reason themselves, having a predefined schema can aid the LLM in identifying information that is logically connected.
Naturally, the efficiency and accuracy of GraphRAG depends on the underlying knowledge graph. Graphs which are robust, readable, and accurately reflect the structure of underlying knowledge, will provide the best chance for LLMs to produce usable results. The question of how to produce optimal knowledge graphs for GraphRAG applications is another open question. Manual construction by humans is slow and labor-intensive, while automated construction by LLMs often produces unsatisfactory and inconsistent results.
In this case, the knowledge graphs we will look at today are pre-built by Fujitsu Research. The graphs were constructed from their own source documents, using their own proprietary knowledge graph generator. They are now published as Neo4j exports that you can download and re-import to Neo4j to examine directly.
That’s what I’ll do today, and I’ll show you what I find. We’ll run the demo, examine the construction of a graph, then connect to gdotv to view the structure directly. If you’d like to follow along, you can get started with gdotv, and connect gdotv to your own Neo4j graph.
What Fujitsu published
The knowledge graphs themselves have been published as datasets on Hugging Face under Fujitsu. Each repository contains the knowledge graph itself and, in many cases, the source document the graph was generated from.
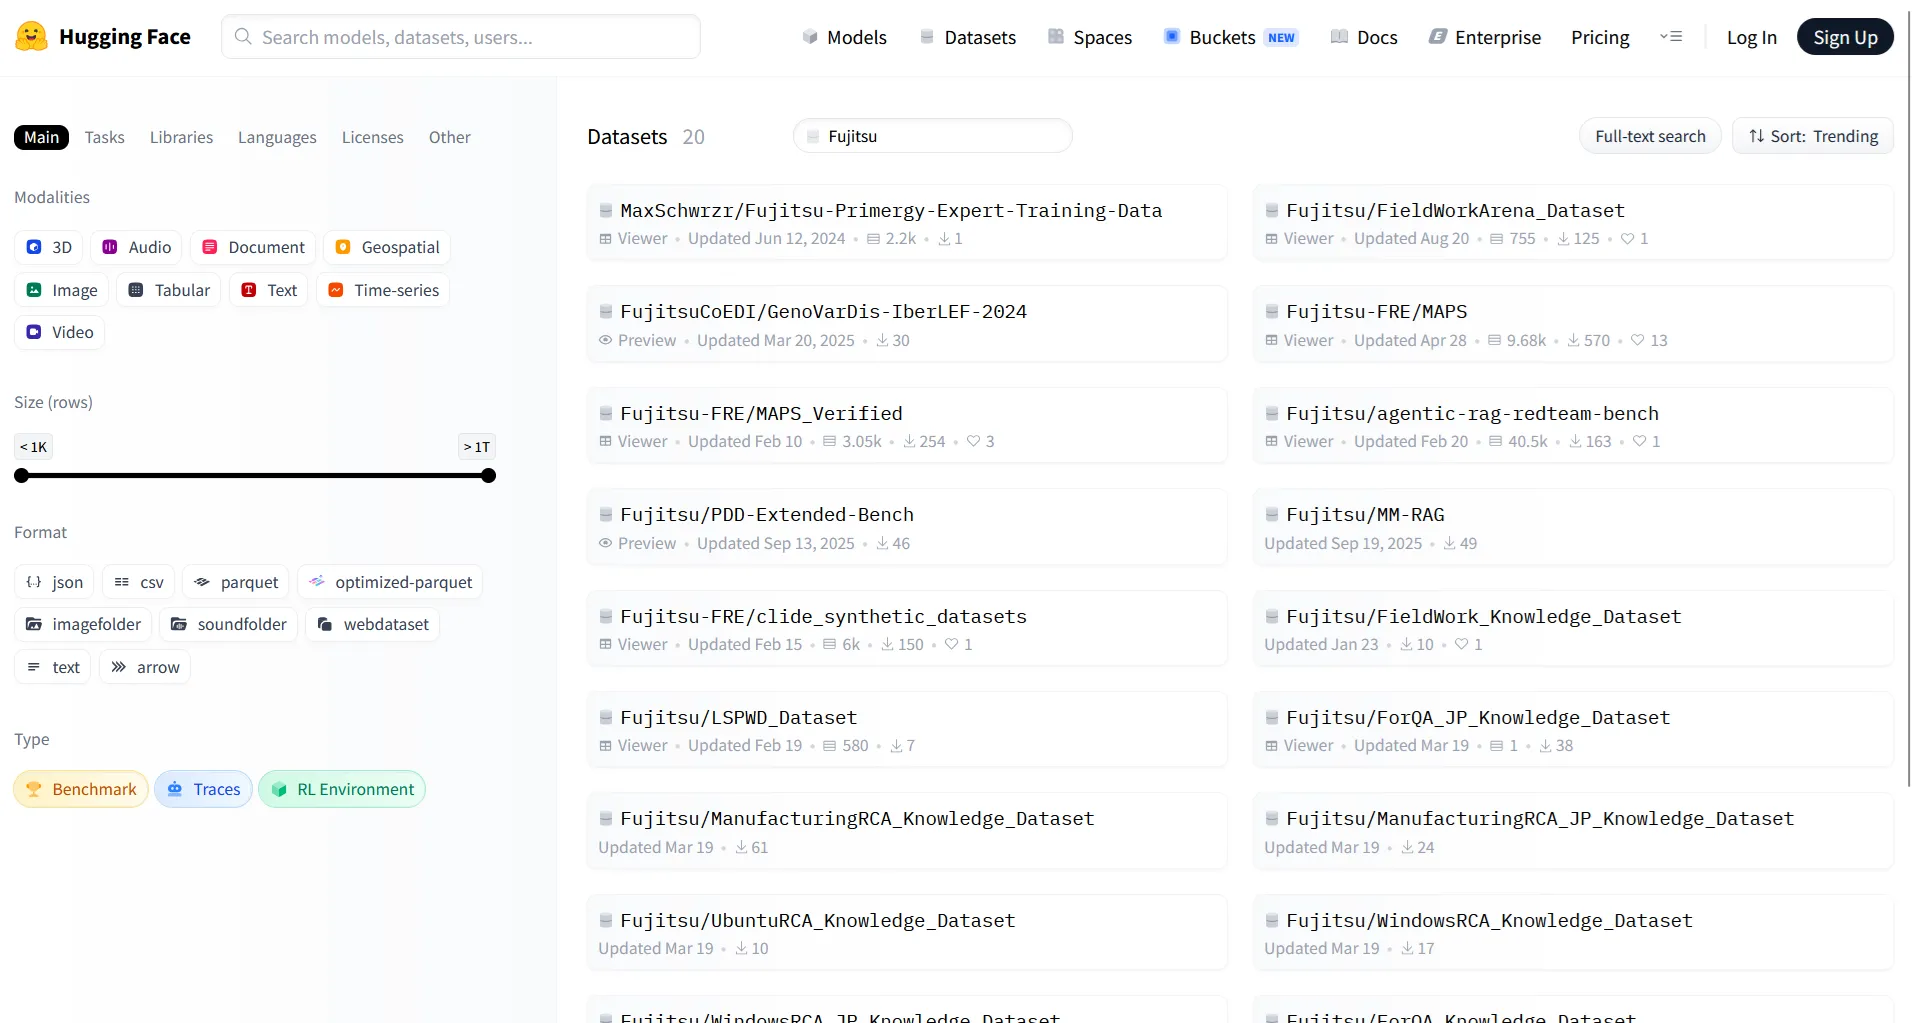
The pipeline published on GitHub is designed to process a particular subsection of these datasets, detailed on the README:
- Root Cause Analysis:
UbuntuRCA,WindowsRCA,WindowsRCA_JP,ManufacturingRCAandManufacturingRCA_JP. These graphs describe faults, causes and resolution procedures in line with root-cause analysis. - Question and Answer:
ForQAandForQA_JP. These graphs were generated from business documents to support a chat-style question answering system. - Vision Analytics:
FieldWork_Knowledge_Dataset. This graph describes the contents of workplace video footage.
The final knowledge graph in bullet point three requires you to submit a separate application through the FieldWorkArena page to use it, so we’ll skip that one for now. We’ll also skip the Question and Answer datasets, though they are included in the repository, so in principle you could follow the same procedure to examine them.
N.B. Some of these datasets have different names in the documentation from the Hugging Face repositories. In some cases the Hugging Face instance contains an additional _Knowledge_Dataset suffix.
Setting up the pipeline
We’ll primarily look at just one of the RCA knowledge graphs: UbuntuRCA_Knowledge_Dataset.
You can begin by cloning the code repository:
git clone https://github.com/FujitsuResearch/Knowledge_Data.git
cd Knowledge_Data
Make sure to download the relevant graphs from Hugging Face into the neo4j_import/ directory.
Use the .env file to configure your environment with the location of your Neo4j database and your model details:
OPENAI_API_KEY="sk-..."
HOST_NEO4J_PORT=7488
HOST_NEO4J_HTTP_PORT=7588

NEO4J_URI=bolt://localhost:7488
NEO4J_USER=neo4j
NEO4J_PASSWORD=your-password
From there, start Docker and your Neo4j database.
Importing the graph
The import is driven by script/run_import.sh, which holds the path to the graph file in a single variable which it then passes to import_db.py.
FILE_PATH="UbuntuRCA_Knowledge_Dataset/db_dir/neo4j.graphml"Once you have set your path, run the two scripts from inside the script/ directory:
cd script
bash run_clear.sh
bash run_import.sh
run_clear.sh empties the database by running MATCH (n) DETACH DELETE n. Clearing is required when switching between datasets, because the import adds to the existing contents of the database rather than replacing them.
run_import.sh then calls apoc.import.graphml.
Inside the graph
We can see an overview of this graph by examining it with gdotv’s graph schema view:
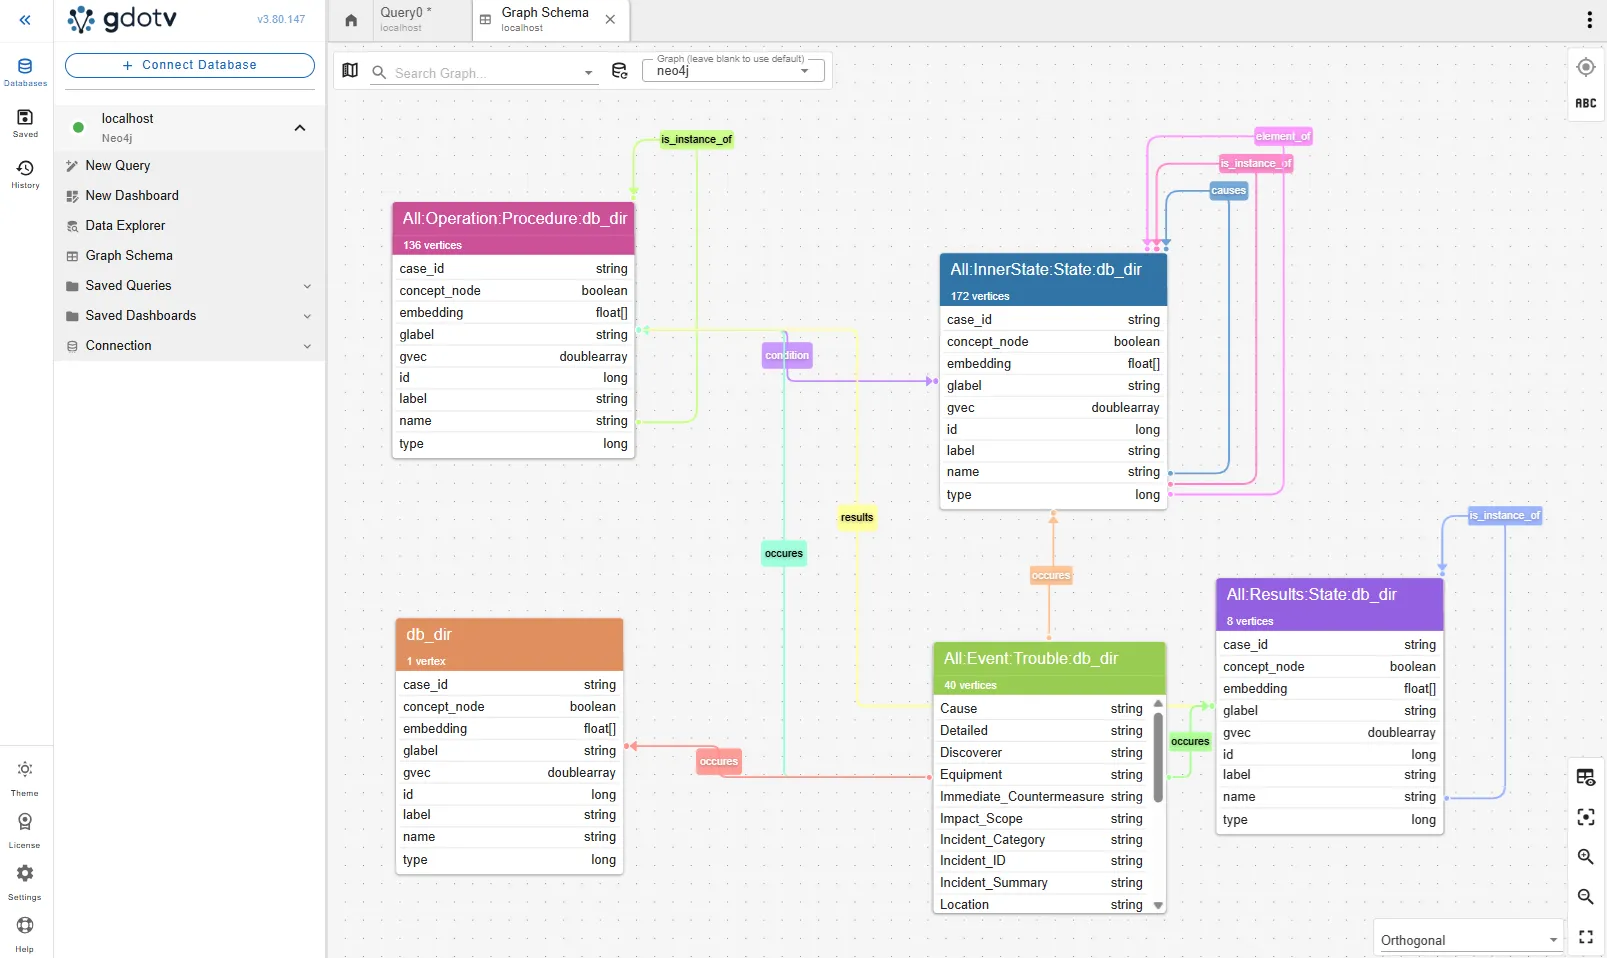
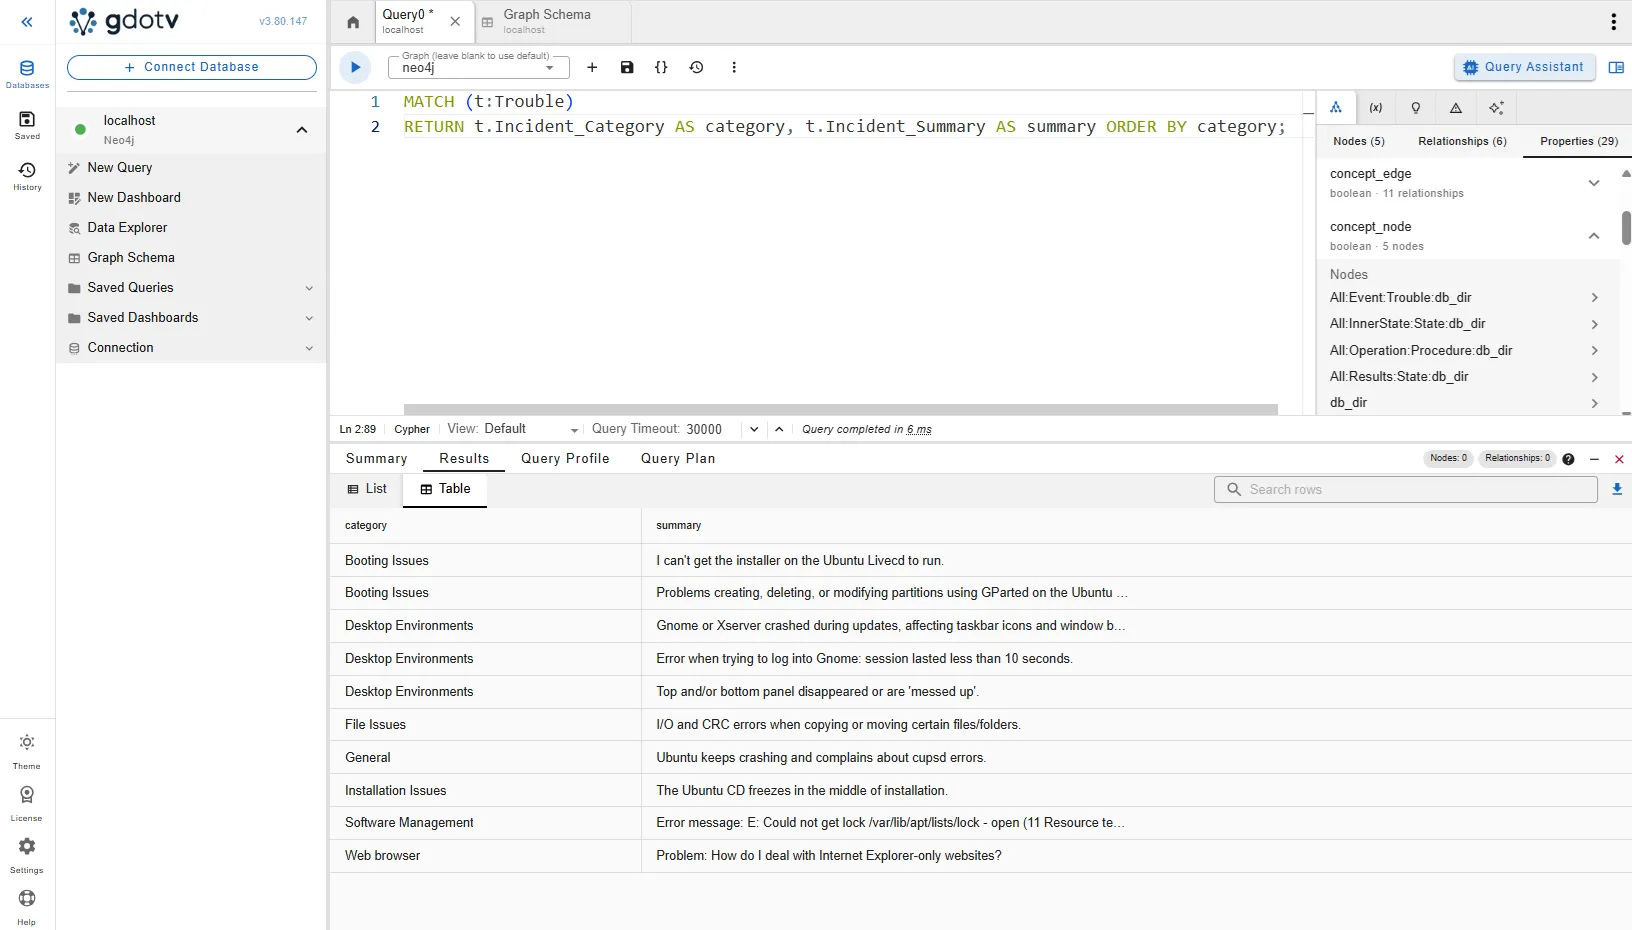
This is a knowledge graph built from support tickets. We can see some example issues people had by listing the Trouble nodes:
MATCH (t:Trouble) RETURN t.Incident_Category AS category, t.Incident_Summary AS summary ORDER BY category;This gives us a list of example incidents:
The graph itself contains two layers, the instance layer and the concept layer. All the nodes and edges in the graph are divided into one of these two layers via the concept_node and concept_edge boolean properties. These two layers are not entirely separate, however, as entities between the two are often interlinked.
The instance layer records statements from the documentation. It contains nodes with the concept_node property set to False. The instance layer contains three primary kinds of node: Trouble, State and Procedure.
The concept layer records an abstraction of the same content with concept_node set to True. These are restatements of the same information as the instance layer, re-interpreted through the LLM. This layer contains State and Procedure nodes.
As we can see, the two layers share a schema. Other than the boolean concept_node and concept_edge properties, the two layers sit together within the same graph.
Looking at a sample case
Let’s examine a particular example, case ea717748-8bbc-40a6-91ba-67fd07a2d741.
MATCH (n {case_id: 'ea717748-8bbc-40a6-91ba-67fd07a2d741'})
OPTIONAL MATCH (n)-[r]->(m)
WHERE m.case_id = 'ea717748-8bbc-40a6-91ba-67fd07a2d741'
   OR m.concept_node = true
RETURN n, r, m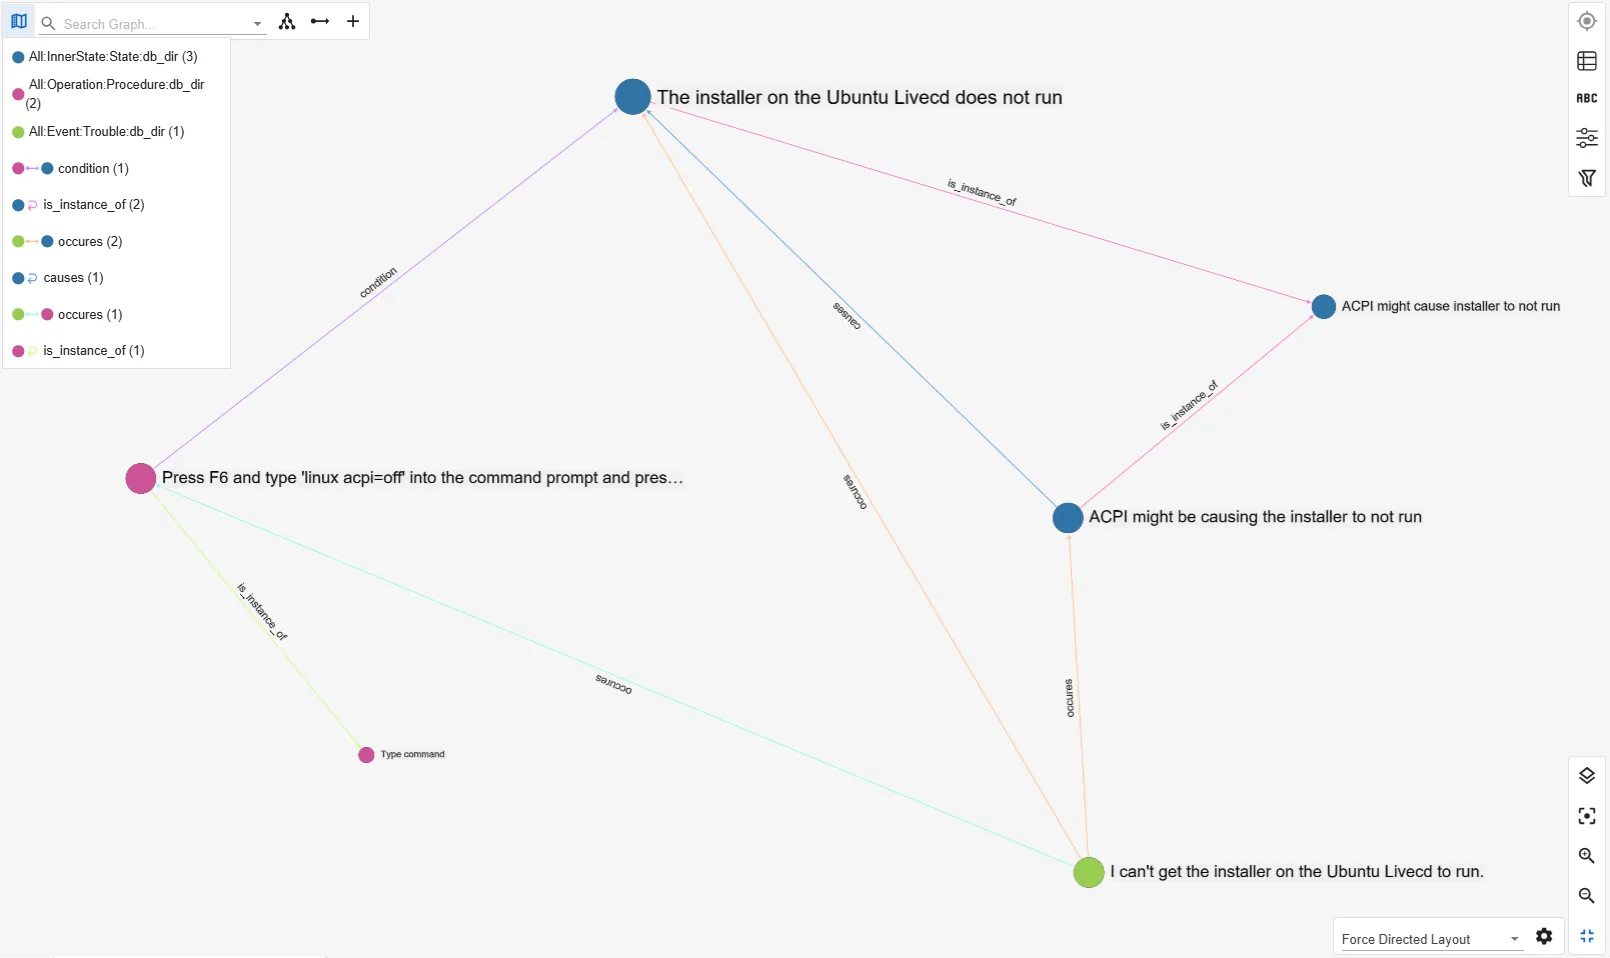
We can examine if these nodes are part of the concept layer by displaying the concept_node property:
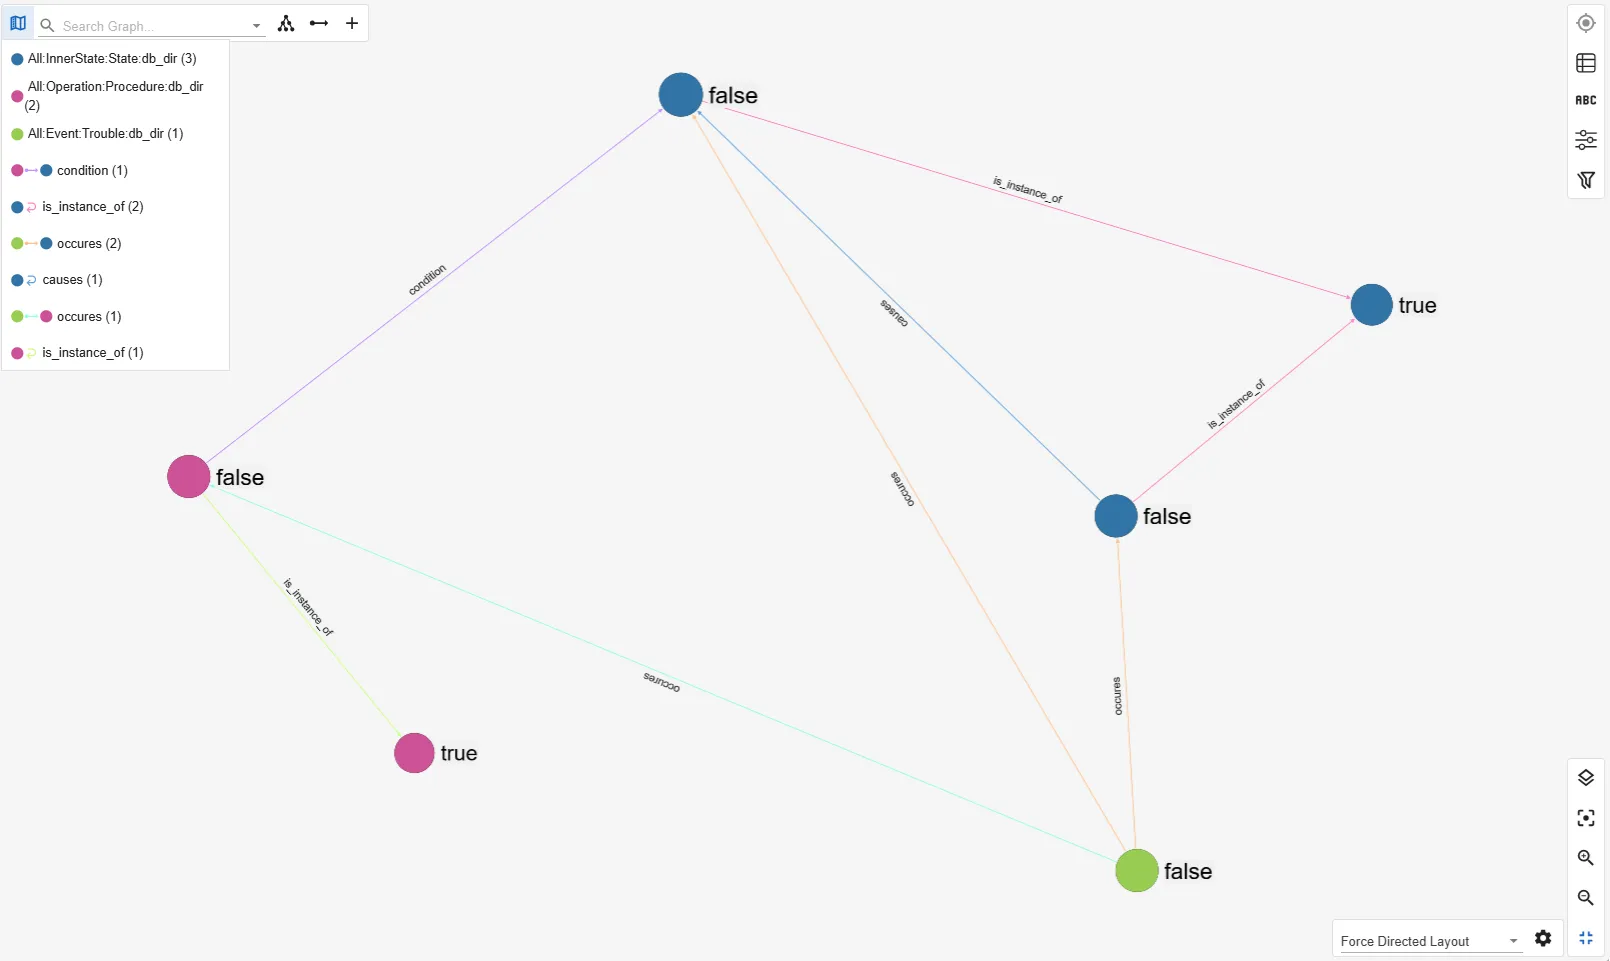
The instance layer is therefore a Trouble node connected to two State nodes and a Procedure node.
The instance layer
Let’s examine the three edges that constitute the instance layer for this case:
| Node | Edge | Node |
|---|---|---|
Trouble - “I can’t get the installer on the Ubuntu Livecd to run.” |
occures [sic] |
State - “ACPI might be causing the installer to not run” |
Trouble - “I can’t get the installer on the Ubuntu Livecd to run.” |
occures [sic] |
State - “The installer on the Ubuntu Livecd does not run” |
Trouble - “I can’t get the installer on the Ubuntu Livecd to run.” |
occures [sic] |
Procedure - “Press F6 and type ‘linux acpi=off’ into the command prompts and press . . . “ |
Each of the above statements are taken from the source document. Searching the source document myself, this seemed to be the original comment:
Problem: I can’t get the installer on the Ubuntu Livecd to run. Solution : This is one of many possible solutions. If you have a laptop, the ACPI might be causing the installer to not run. At the initial boot screen(where one can see options like “Install to the hard disk, Check cd for defects, etc.”) press F6 and type the following code into the command prompt and press Enter. The installer should be able to run now. ‘linux acpi=off’
As we can see, the nodes and edges map fairly well onto the source fragment. Notably, however, they do not map exactly. In particular, the State and Procedure nodes both show at least some rewording/inference from the source quote. We can tell therefore that the LLM is not exactly duplicating source fragments during knowledge graph construction, even in the instance layer. There is still some level of abstraction happening. This makes sense, as human-written text fragments will not always fit the intended graph structure, but also indicates this step will need careful verification to ensure errors are not introduced.
It also seems that the State node has a fairly broad scope, as one State node describes an actual state of the system (“The installer on the Ubuntu Livecd does not run.”) while the other describes the nebulous possibility of two states having a causal link (“ACPI might cause installer to not run”). Without knowing what criteria the generating LLM was given to determine a State node, it is difficult to determine if these fall within expected scope. I found other instances of State nodes with non-state like descriptions like “There could be a hard disk error issue like bad sectors” which describes a hypothetical with a suggested example of the hypothetical.
It is possible that the retrieving LLM is expecting to resolve semantic ambiguity on its own, or that this inconsistency is a quirk of early-stage development.
Two additional edges link the State and Procedure nodes back together again:
| Node | Edge | Node |
|---|---|---|
State - “ACPI might be causing the installer to not run” |
causes |
State - “The installer on the Ubuntu Livecd does not run” |
Procedure - “Press F6 and type ‘linux acpi=off’ into the command prompts and press . . . “ |
condition |
State - “The installer on the Ubuntu Livecd does not run” |
In the first row we see that the causes edge links the two different State nodes, such that the conditional described in the first State node effectively becomes a potential reason for the state described in the second State node. In this case we can see that causal chain from the source fragment seems well-encoded.
In the second row, it seems that the State node serves as a condition to prompt the action described in the Procedure node. In this case, this does seem to be an accurate depiction of the troubleshooting response that was recommended in the source fragment.
We notice though, that this second row illuminates another strange feature in the structure of this graph. Twice we have seen the symptom (i.e. the installer on the Ubuntu Livecd not running) rather than the cause (i.e. ACPI) linked to the solution (i.e. setting acpi=off). Because both symptom and cause are described by State nodes, the graph schema treats them interchangeably, and there is nothing preserving the logical chain which should link solution to the root cause.
This would have little effect on a singular, linear logical chain like this, but could easily block identification of logical solutions in more complex RCA. If more than one cause can create the same symptom, then a graph that does not link solutions to causes would not be able to troubleshoot effectively.
The concept layer
Next, I examined the concept layer to see if this provided more information on our example case:
| Node | Edge | Node |
|---|---|---|
State “ACPI might be causing the installer to not run” |
is_instance_of |
State - “ACPI might cause installer to not run” |
State - “The installer on the Ubuntu Livecd does not run” |
is_instance_of |
State - “ACPI might cause installer to not run” |
Procedure - “Press F6 and type ‘linux acpi=off’ into the command prompts and press . . . “ |
is_instance_of |
Procedure - “Type command” |
N.B. Only the edges and the target nodes on the right are part of the concept layer, the three nodes on the left are from the instance layer.
As we can see, the two layers seem to carry very similar information. It is not clear to me that there is any semantic role being played by the very similar State “ACPI might be causing the installer to not run” (instance layer) and State - “ACPI might cause installer to not run” (concept layer) existing as unique nodes on separate layers. This seems to be a redundancy introduced by the LLM during construction, one that worsens the symptom/cause ambiguity we’ve seen already.
The Procedure - “Type command” node is a true abstraction, one we could imagine linking to other procedures. I investigated this with the query:
MATCH q=(p)-[]-() WHERE p.name = "Type command" RETURN q;Where I did discover this node was linked to another similar Procedure node, but was surprised to discover this node is also connected to two seemingly unconnected State nodes.
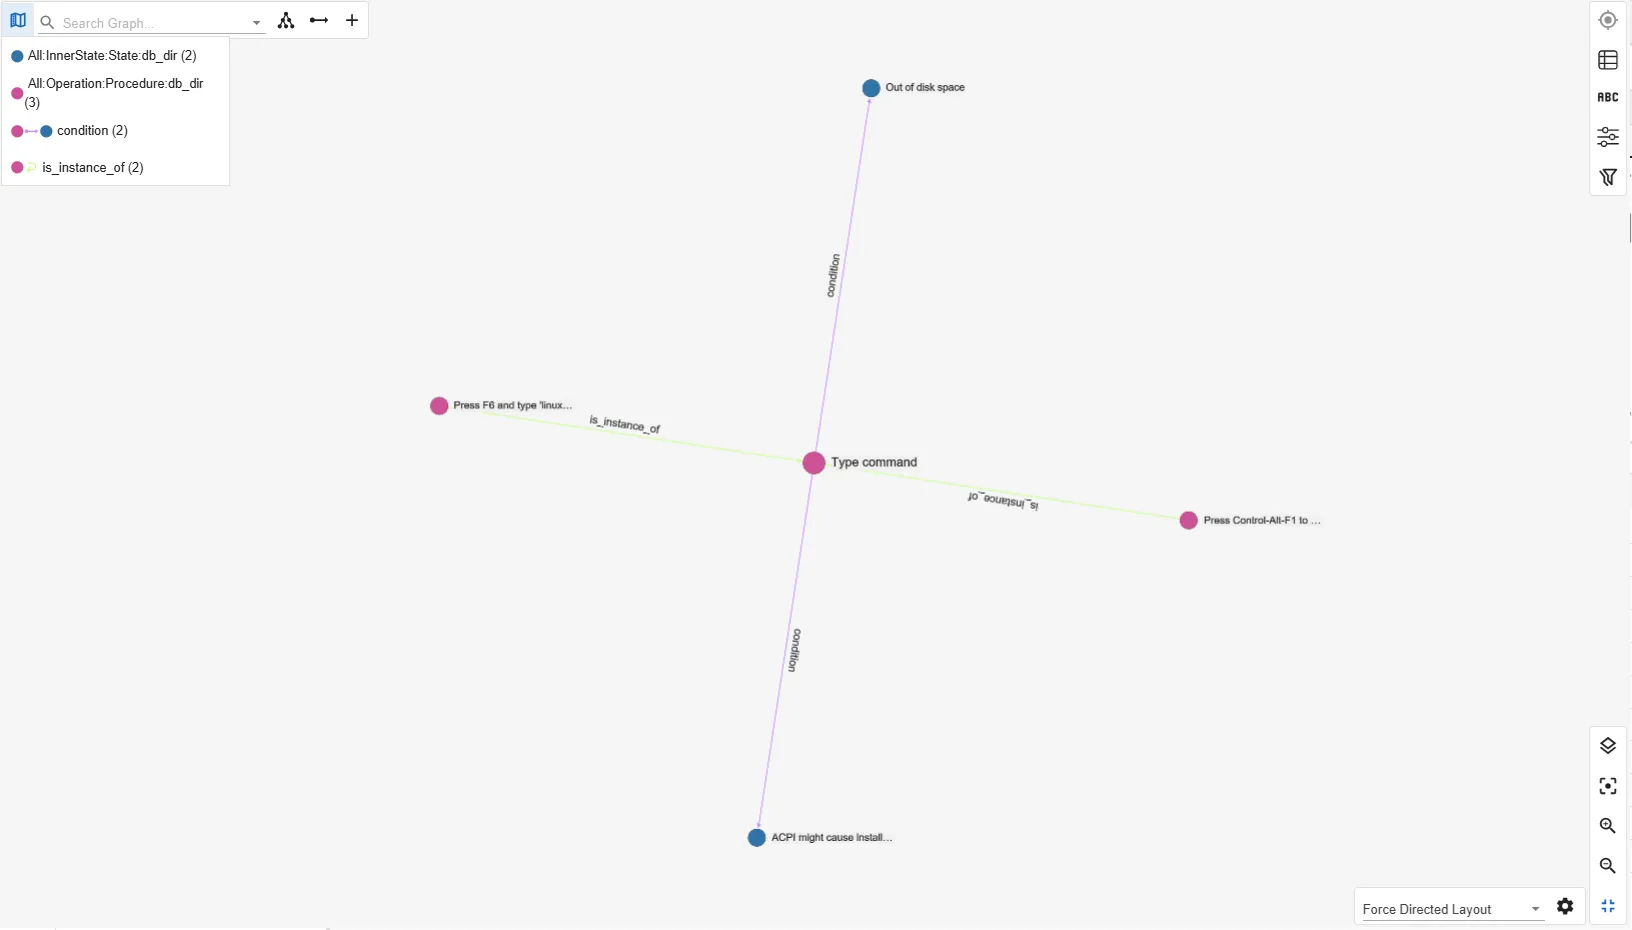
These condition edges also seem to collapse meaning, linking to states that happen to resolve by typing a command, but are not causally linked. This may have been inferred from the similar condition edge in the instance layer, but it does not seem to add meaningful information to the graph. Rather, it seems to confuse the situation further.
It is not apparent exactly how the KG-generating LLM constructs these layers, as Fujitsu has not described the generation process. It is possible, though, that these strange edges are another example of the LLM interpreting the graph schema in an unexpected way. This illustrates one of many hazards related to LLM knowledge graph construction.
Fujitsu’s blog series
In October 2024, Fujitsu began publishing a six-part series related to their graph technology for use in various different domains.
- Part 1: Root Cause Analysis
- Part 2: Question & Answer
- Part 3: Software Engineering
- Part 4: Vision Analytics
- Part 5: Log Analysis
- Part 6: Usable Knowledge
The first part seems very closely aligned to what we have covered today, I took a closer look to see if it could illuminate the situation further.
Back then, Fujitsu described their vision for using GraphRAG for RCA using the following diagram:
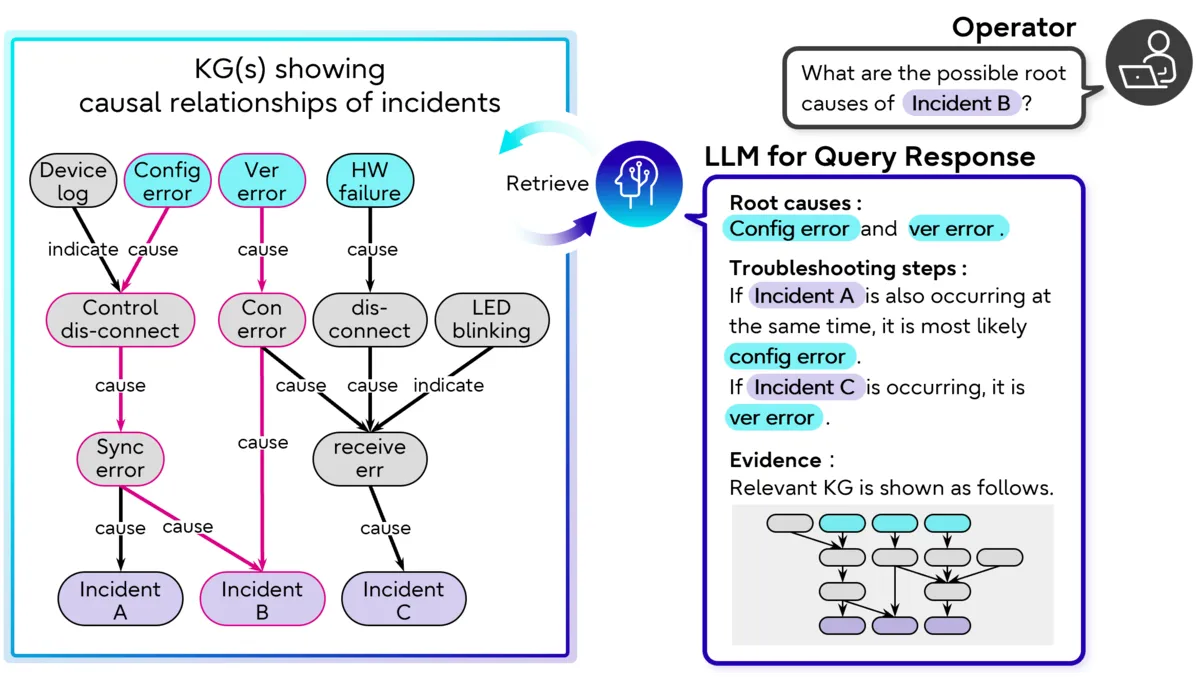
In this case, the knowledge graph on the left is an example graph (not a schema) which an LLM is expected to query. The user queries the LLM with a natural language question (e.g. “What are the possible root causes of [INCIDENT]?”) and the LLM traces a graph to produce a natural language response.
Fujitsu then defines the general schema they use to build the graph:
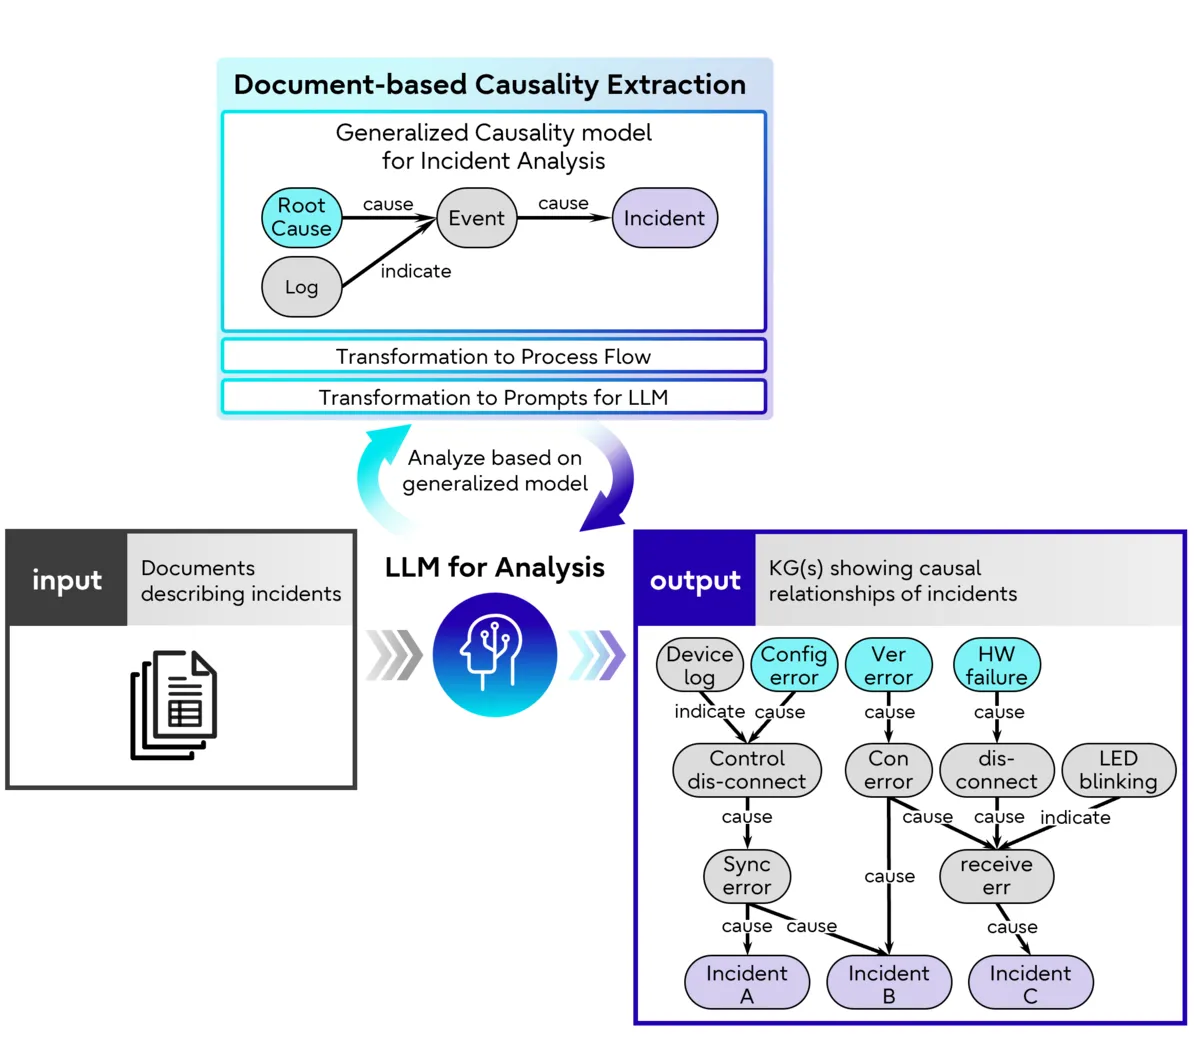
Which here is shown as Log, Root Cause, Event and Incident nodes.
This is similar to, but still distinct from, the graph schema we saw earlier. I did a brief check of the other Fujitsu RCA datasets available, and none of them matched this example. This suggests that perhaps the example graphs were produced according to a slightly different procedure than was described in the blog post.
Unfortunately then, though the blog post describes the general motivation and structure of their GraphRAG approach, it is limited in what it can tell us about this pipeline or these specific datasets.
Running a GraphRAG query
Now that we have examined the underlying structure of the graph, it’s time to actually use the GraphRAG part.
The prompt to generate a Cypher query is given in kg_rag.py here:
Task: Generate a Cypher statement to query a graph database.
Instructions:
- Use only the provided relationship types and properties in the schema.
- Be sure to remove the property of "embedding".
- Do not use any other relationship types or properties that are not provided.
- IMPORTANT: You MUST respond with ONLY a valid Cypher query. Do NOT include any explanation, apology, or natural language text.
- If you cannot generate a valid Cypher query, respond with: MATCH (n) RETURN 'Unable to generate query for this question' AS message LIMIT 1
- The query must start with one of: MATCH, OPTIONAL, WITH, UNWIND, CALL, CREATE, MERGE, RETURN
The LLM is then fed the live schema directly from the graph. We can see therefore that the LLM is tasked with translating the user’s natural language query into a Cypher query, but does not have additional instructions telling it how to interpret the structure of the data. The LLM has only the raw schema itself as context.
Regarding the requirement that the LLM actually produces valid Cypher, there is a validate_cypher_query function in the code, however I couldn’t find where it is used, if anywhere. It is possible it has not been implemented yet, or has been left to the user to implement.
Regarding our particular case, ea717748-8bbc-40a6-91ba-67fd07a2d741, I tried to run a relevant query against the LLM. I stuck to their recommended phrasing (i.e. “What are the possible root causes of [INCIDENT]?”), sending the prompt “What might be the root cause of Ubuntu Livecd not running?” for which I already knew the correct answer (ACPI) from our previous inspection of the graph and source files.
This was the output:
PS ..\Knowledge_Data\script> python kg_rag.py --query "What might be the root cause of Ubuntu Livecd not running?"
Connecting to Neo4j at bolt://localhost:7488...
Successfully connected to Neo4j
Initializing LLM...
Creating RAG chain...

Executing query: What might be the root cause of Ubuntu Livecd not running?
--------------------------------------------------------------------------------


> Entering new GraphCypherQAChain chain...
Generated Cypher:
MATCH (n:All {name: 'Ubuntu Livecd'})<-[:causes]-(c:All)
RETURN c.name AS root_cause
Full Context:
[]

> Finished chain.

================================================================================
RESULT:
================================================================================
Query: What might be the root cause of Ubuntu Livecd not running?

Answer: I don't know the answer.
Unfortunately the LLM was not able to produce the expected answer.
The LLM generated the following syntactically valid and plausibly correct Cypher query:
MATCH (n:All {name: 'Ubuntu Livecd'})<-[:causes]-(c:All)
RETURN c.name AS root_cause
However it seemingly did not have the necessary information to produce syntax and content which matched the graph. There are several issues with this query. Among them are the unjustified search for a Node with the exact title Ubuntu Livecd, when nothing in the prompt or graph schema suggests that such a node might exist. Another problem is the structure of the query, which looks for only a single hop, even when we have seen that the root cause of a query can be an arbitrary number of hops away.
This is a generic issue in GraphRAG, as it is challenging for an LLM to respond to natural-language questions that do not adhere to the schema information they already have within their context. It’s worth noting that I only used a local Ollama model (qwen2.5-coder:7b) to run this pipeline. It is possible, and likely, that a more powerful model could produce a more appropriate query. For example, a search for nodes that contain Ubuntu Livecd, rather than an exact match, would have been a better starting point. Though, query quality is hard to guarantee, and model upgrades always carry a compute cost. The more complex the graph, the harder it will be for even a powerful LLM to infer the correct query without appropriate guidance.
In this case, it seems the pipeline is a one-shot attempt. If the initial query is not well-formed, the retrieval fails. Though this will not always produce the desired information on the first attempt, one positive is that it is a highly transparent process that allows the user a high degree of control in their querying. This failure mode allows the user to build their own understanding of the system through trial and error.
One could imagine a multi-query pipeline where a model could both run initial information-gathering queries and re-prompt itself when a query does not behave as expected. This would, again, be a trade-off, where you consider how much compute and control you wish to give to the LLM. A multi-query pipeline may produce more plausible results, but be computationally inefficient and obscure the process by which results were obtained.
I checked that the chain did work as expected when using a natural language query that more closely adhered to the expected schema:
PS ..\Knowledge_Data\script> python kg_rag.py --query "List the name of every State node that causes another state, with what it causes."
Connecting to Neo4j at bolt://localhost:7488...
Successfully connected to Neo4j
Initializing LLM...
Creating RAG chain...

Executing query: List the name of every State node that causes another state, with what it causes.
--------------------------------------------------------------------------------


> Entering new GraphCypherQAChain chain...
Generated Cypher:
cypher
MATCH (s1:State)-[:causes]->(s2:State)
RETURN s1.name AS causing_state, s2.name AS caused_state

Full Context:
[{'causing_state': 'ACPI might be causing the installer to not run', 'caused_state': 'The installer on the Ubuntu Livecd does not run'}, {'causing_state': 'The CD image was probably corrupted during download or burn[&]You do not have enough RAM (less than 256 MB) to run the Desktop CD', 'caused_state': 'The Ubuntu CD freezes in the middle of installation'}, {'causing_state': 'Ubuntu Live CD keeps auto-mounting partitions, thus deleting or altering a partition via GParted on Live CD has no effect', 'caused_state': 'Cannot create, delete, or modify partitions using GParted on the Ubuntu Live CD'}, {'causing_state': 'cupsd errors occur', 'caused_state': 'Ubuntu keeps crashing'}, {'causing_state': 'Gnome or Xserver crashed during updates', 'caused_state': "When an application or window is open, it doesn't have an icon on the taskbar"}, {'causing_state': "When an application or window is open, it doesn't have an icon on the taskbar", 'caused_state': 'The close, maximise, and minimise buttons in all applications and windows are gone or have changed position on the menu bar'}, {'causing_state': 'Out of disk space', 'caused_state': 'Error when trying to log into Gnome: session lasted less than 10 seconds'}, {'causing_state': 'If you use Xubuntu and Xfce, this will happen sooner or later', 'caused_state': "Top and/or bottom panel disappeared or are 'messed up'"}, {'causing_state': 'Process using lock file', 'caused_state': 'Error message: E: Could not get lock /var/lib/apt/lists/lock - open (11 Resource temporarily unavailable)'}, {'causing_state': 'The disc might be damaged', 'caused_state': 'There could be a hard disk issue like bad sectors'}]

> Finished chain.

================================================================================
RESULT:
================================================================================
Query: List the name of every State node that causes another state, with what it causes.

Answer: ACPI might be causing the installer to not run, which leads to the installer on the Ubuntu Livecd not running. The CD image was probably corrupted during download or burn, or you do not have enough RAM (less than 256 MB) to run the Desktop CD, which causes the Ubuntu CD to freeze in the middle of installation. Ubuntu Live CD keeps auto-mounting partitions, thus deleting or altering a partition via GParted on Live CD has no effect, which leads to not being able to create, delete, or modify partitions using GParted on the Ubuntu Live CD. CUPSd errors occur, which causes Ubuntu to keep crashing. Gnome or Xserver crashed during updates, which leads to when an application or window is open, it doesn't have an icon on the taskbar. When an application or window is open, it doesn't have an icon on the taskbar, which leads to the close, maximise, and minimise buttons in all applications and windows being gone or having changed position on the menu bar. Out of disk space, which causes an error when trying to log into Gnome: session lasted less than 10 seconds. If you use Xubuntu and Xfce, this will happen sooner or later, which leads to top and/or bottom panel disappearing or being 'messed up'. A process using a lock file, which causes an error message: E: Could not get lock /var/lib/apt/lists/lock - open (11 Resource temporarily unavailable). The disc might be damaged, which could lead to a hard disk issue like bad sectors.
In this case, the generated Cypher query was able to return the desired result:
MATCH (s1:State)-[:causes]->(s2:State)
RETURN s1.name AS causing_state, s2.name AS caused_state
And the LLM parsed the result into an approximately human-readable form. It’s worth noting that only the first ten Cypher results were parsed by the LLM, due to a top_k=10 flag in kg_rag.py. This is likely to avoid overloading the context window of the LLM. This parameter can be easily adjusted, but it’s not indicated anywhere in the output, so watch out for it. This flag also illustrates that context limitations are still a consideration in GraphRAG.
Conclusion
This repository from Fujitsu serves as an interesting proof-of-concept for GraphRAG applications. It’s an easy-to-use framework that illustrates the bones of GraphRAG.
At the beginning, we discussed the many limitations of emerging RAG systems, and how GraphRAG may be able to solve them by providing an easily traversable base of logically connected data. In this case, we have seen that many of the issues are not inherently solved by GraphRAG. We’ve seen that the unpredictability of LLM inference can still pose a serious problem in such systems. This is present in both the graph construction and graph query stage.
The system does have the benefit that it directly provides the query results directly from the graph. This enables transparency and efficient validation against the graph layer in the retrieval layer. A similar stage in the construction layer would likely strongly improve performance. Human-led or human-assisted verification of content or schema helps ensure robust graphs, and, as we’ve seen, gdotv is a great tool for this kind of inspection. Without that kind of care and attention, you may still find yourself back where you started: manually checking LLM outputs against prose documents!
These are already well-known issues in GraphRAG, and ones that anyone building a GraphRAG system will have to contend with sooner or later. In this sense, what at first seems to be a weakness of this pipeline might actually be a strength. The fact that these features are so apparent, and so close to the user, makes this pipeline a perfect playground for researchers to experiment. This is a minimal working example that lets you troubleshoot established GraphRAG issues from the ground up, and you can similarly use gdotv to inspect your graph as you go.
Which is why the real strength of this pipeline is that it’s open-source, pre-built and accessible. That leaves you free to modify this pipeline and try out new graphs and processes to see how you can make GraphRAG work for you. If you do build anything with this framework, please get in touch, I’d love to see what you develop!
About the author

Dr. Amber Lennox
Developer Relations Engineer
Amber manages developer relations at gdotv and (when not deep-diving into documentation) can be found wild swimming in questionable weather and working on personal programming projects like developing software for language learning. With a PhD in Astrophysics, Amber is particularly drawn to the mathematical and scientific aspects of graph theory and analytics.