G.V() is now Available for Hypermode Graphs & Dgraph
Introduction
G.V() is now compatible with Dgraph and Hypermode Graphs. With this partnership we bring a wealth of new tooling and features for Dgraph users to explore and visualize their graph data like never before.
Dgraph is a graph database most commonly used for building knowledge graphs. It is the only open, complete graph database used at terabyte-scale to power real-time use cases.
In this blog post, we’ll be demonstrating the key features G.V() offers for Dgraph and Hypermode Graph users.
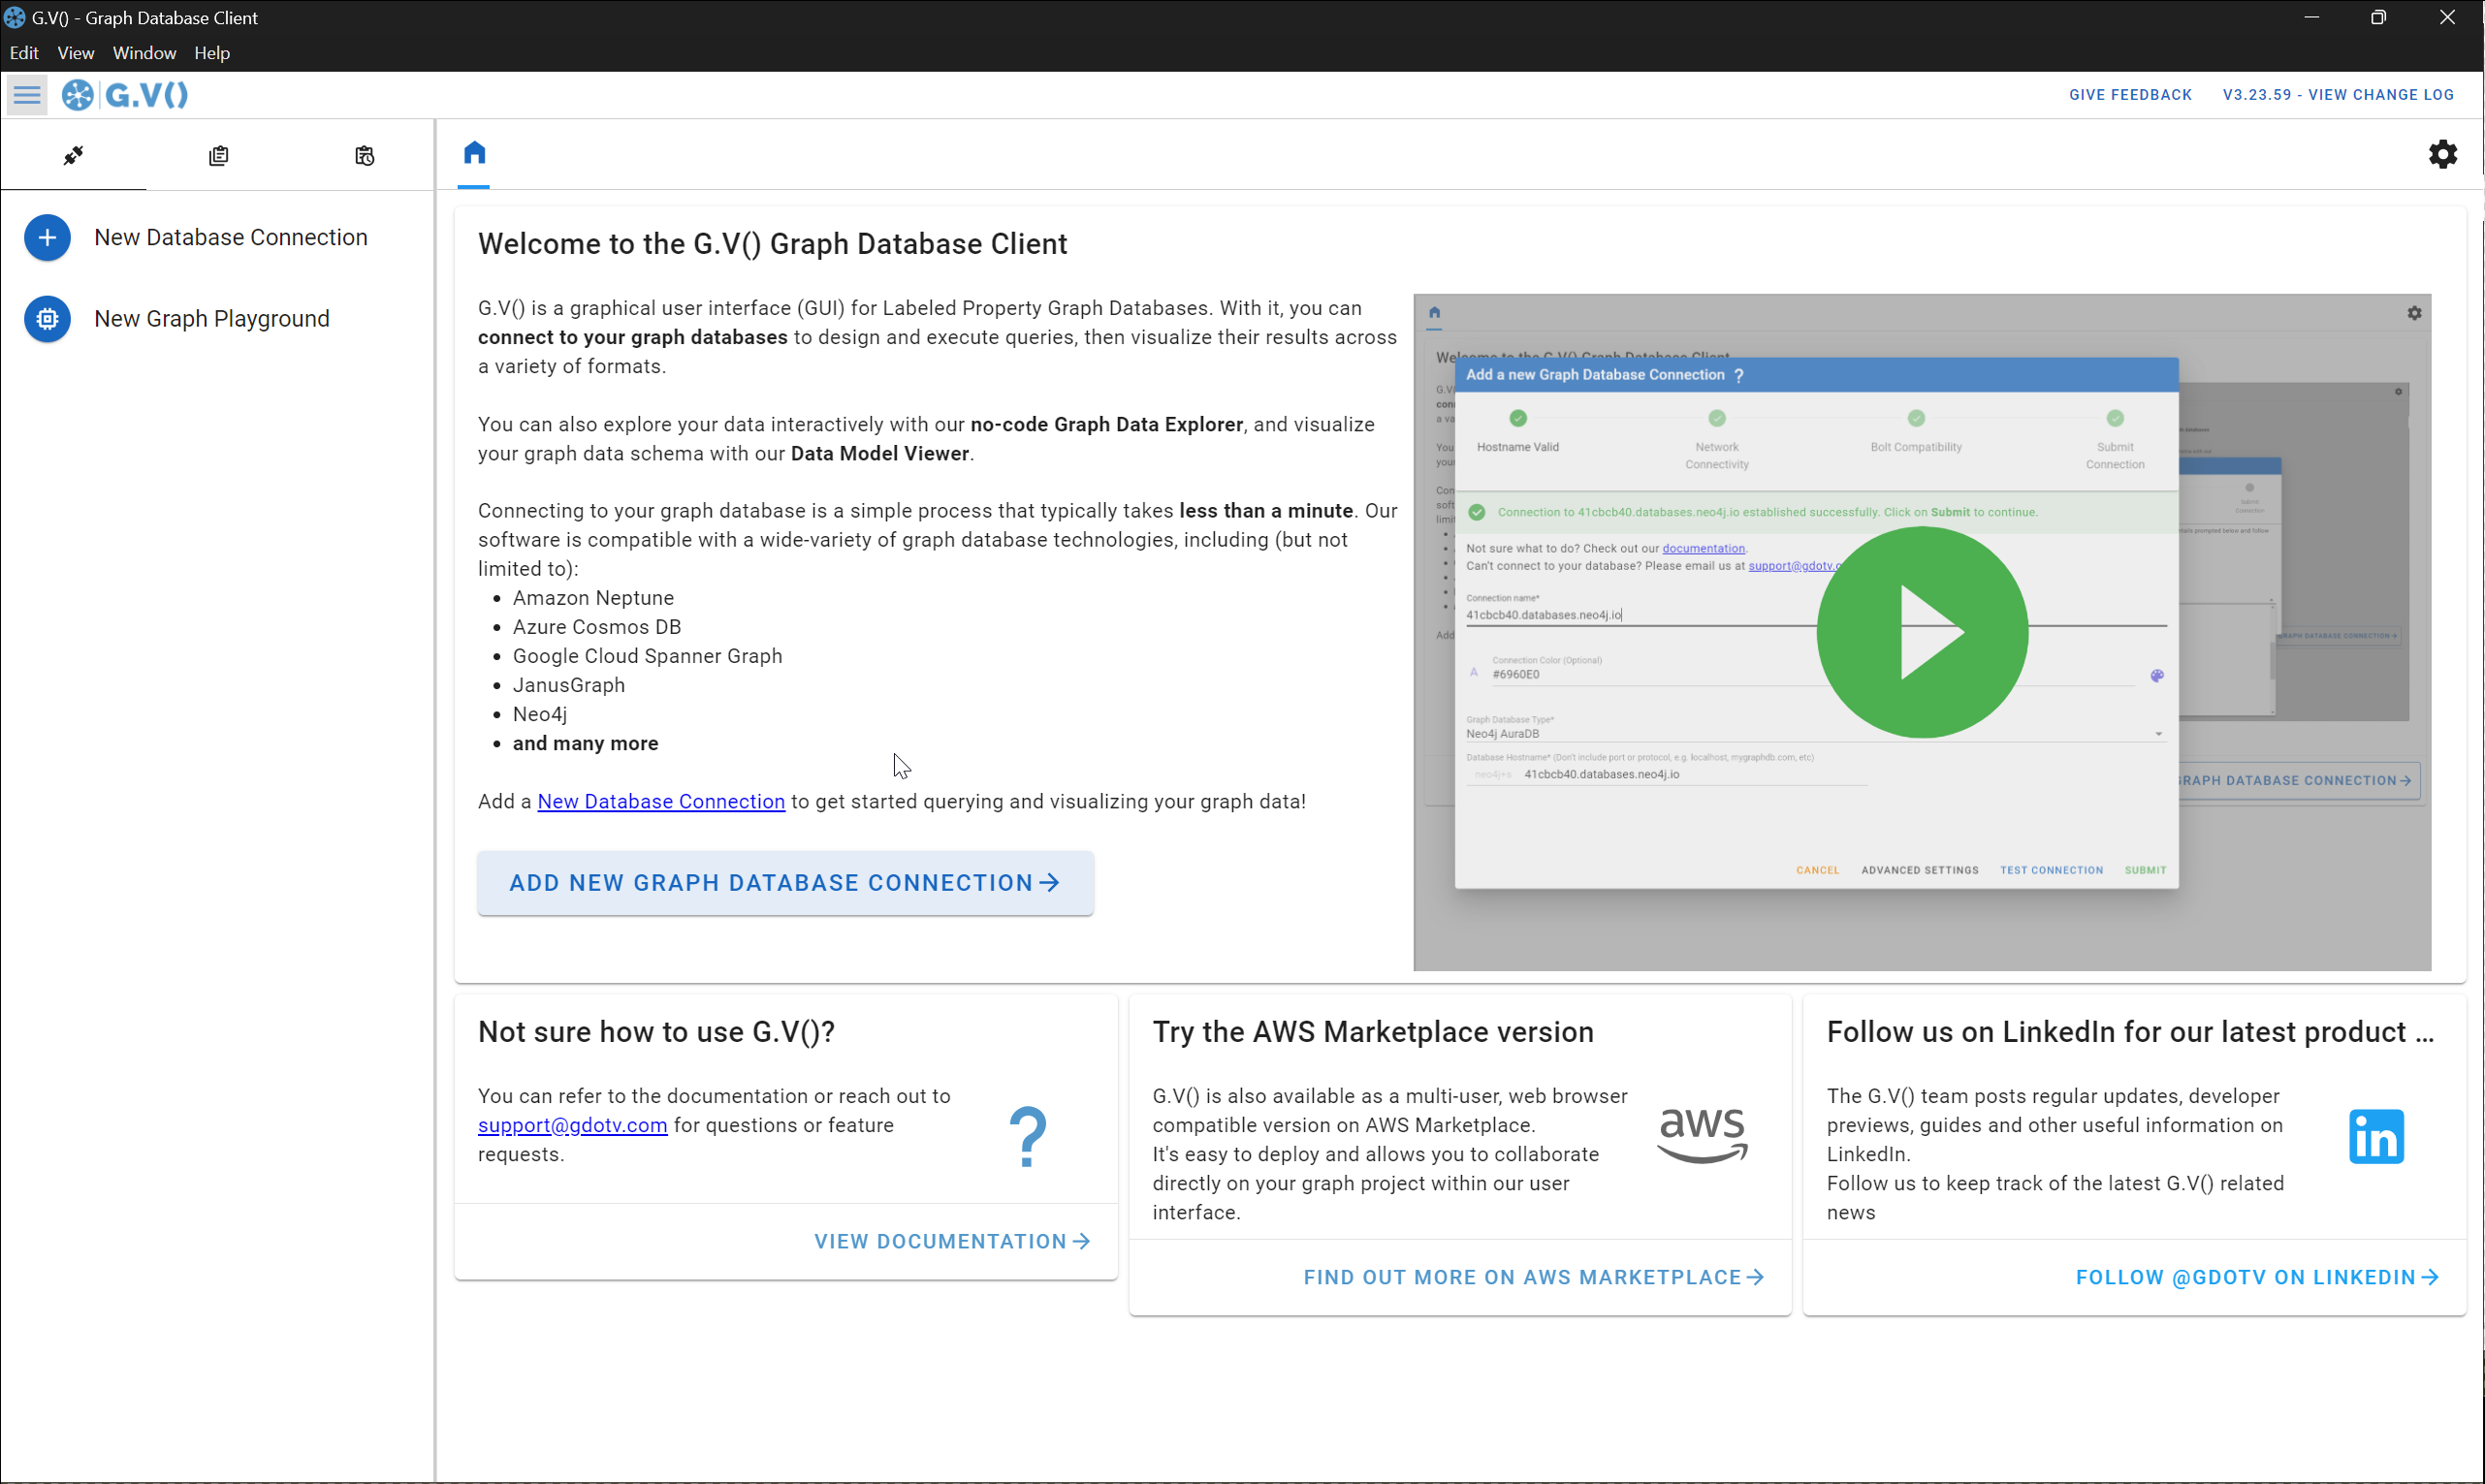
Instant Connection Setup
Centrally manage and query your Dgraph instances
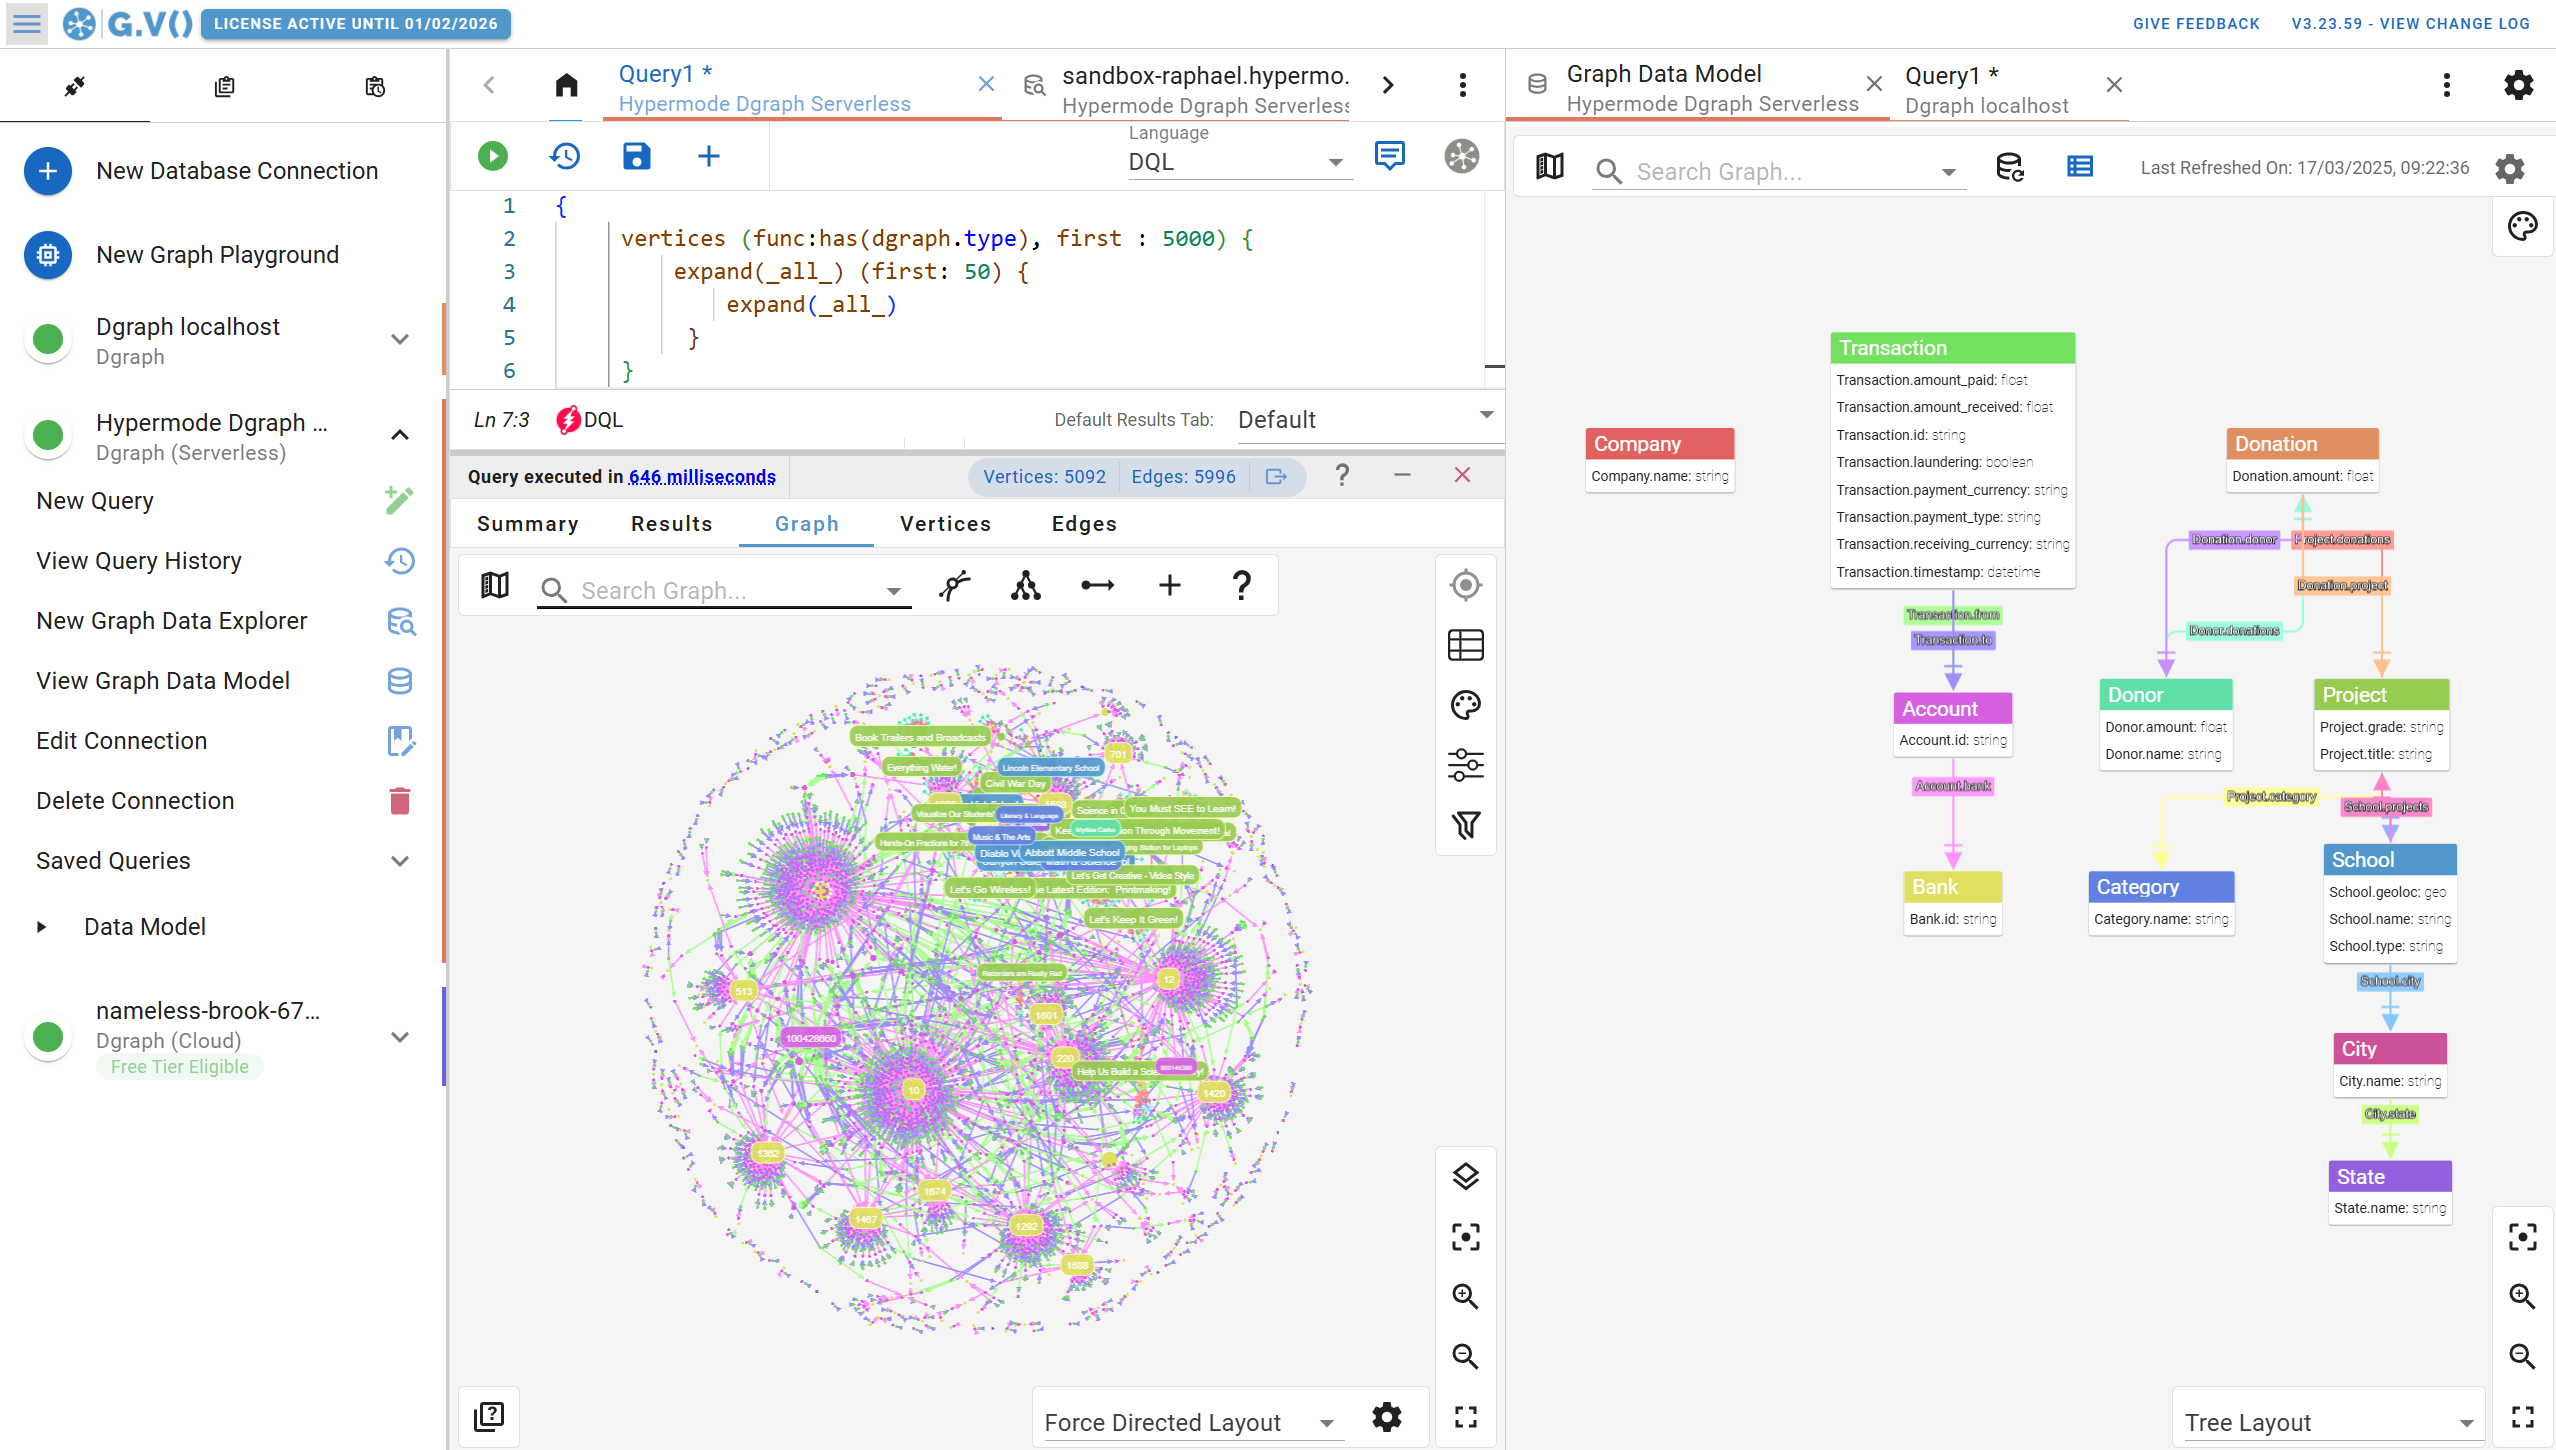
Are you working across multiple Dgraph instances? No problem! With G.V(), you can connect concurrently to as many instances as you need, giving you a one stop shop to work across all your graph databases.
Each database connection comes with its own settings, saved queries and stylesheets, that you can seamlessly switch between with our tabs system.
Query multiple Dgraph instances, visualize results in parallel for an easy comparison between datasets.
High-performance interactive graph visualization
With G.V(), you can turn DQL query results into interactive graph visualizations, with support for displaying tens of thousands of elements. Our GPU-based rendering engine offers optimal performance whilst allowing for in depth customization of styles for your graph.
Multiple layout algorithms are available to organise your graph display according to its structure (e.g. tree, cluster, force-directed), making it easier to navigate and interpret visually.
Nodes and edges can be created, updated and deleted interactively from our user interface to simplify small editing tasks for your data. Graph data can also be filtered and explored interactively, with the ability to load vertex neighbours directly from your Dgraph instance in just a couple of clicks.
Navigate Dgraph data without writing queries
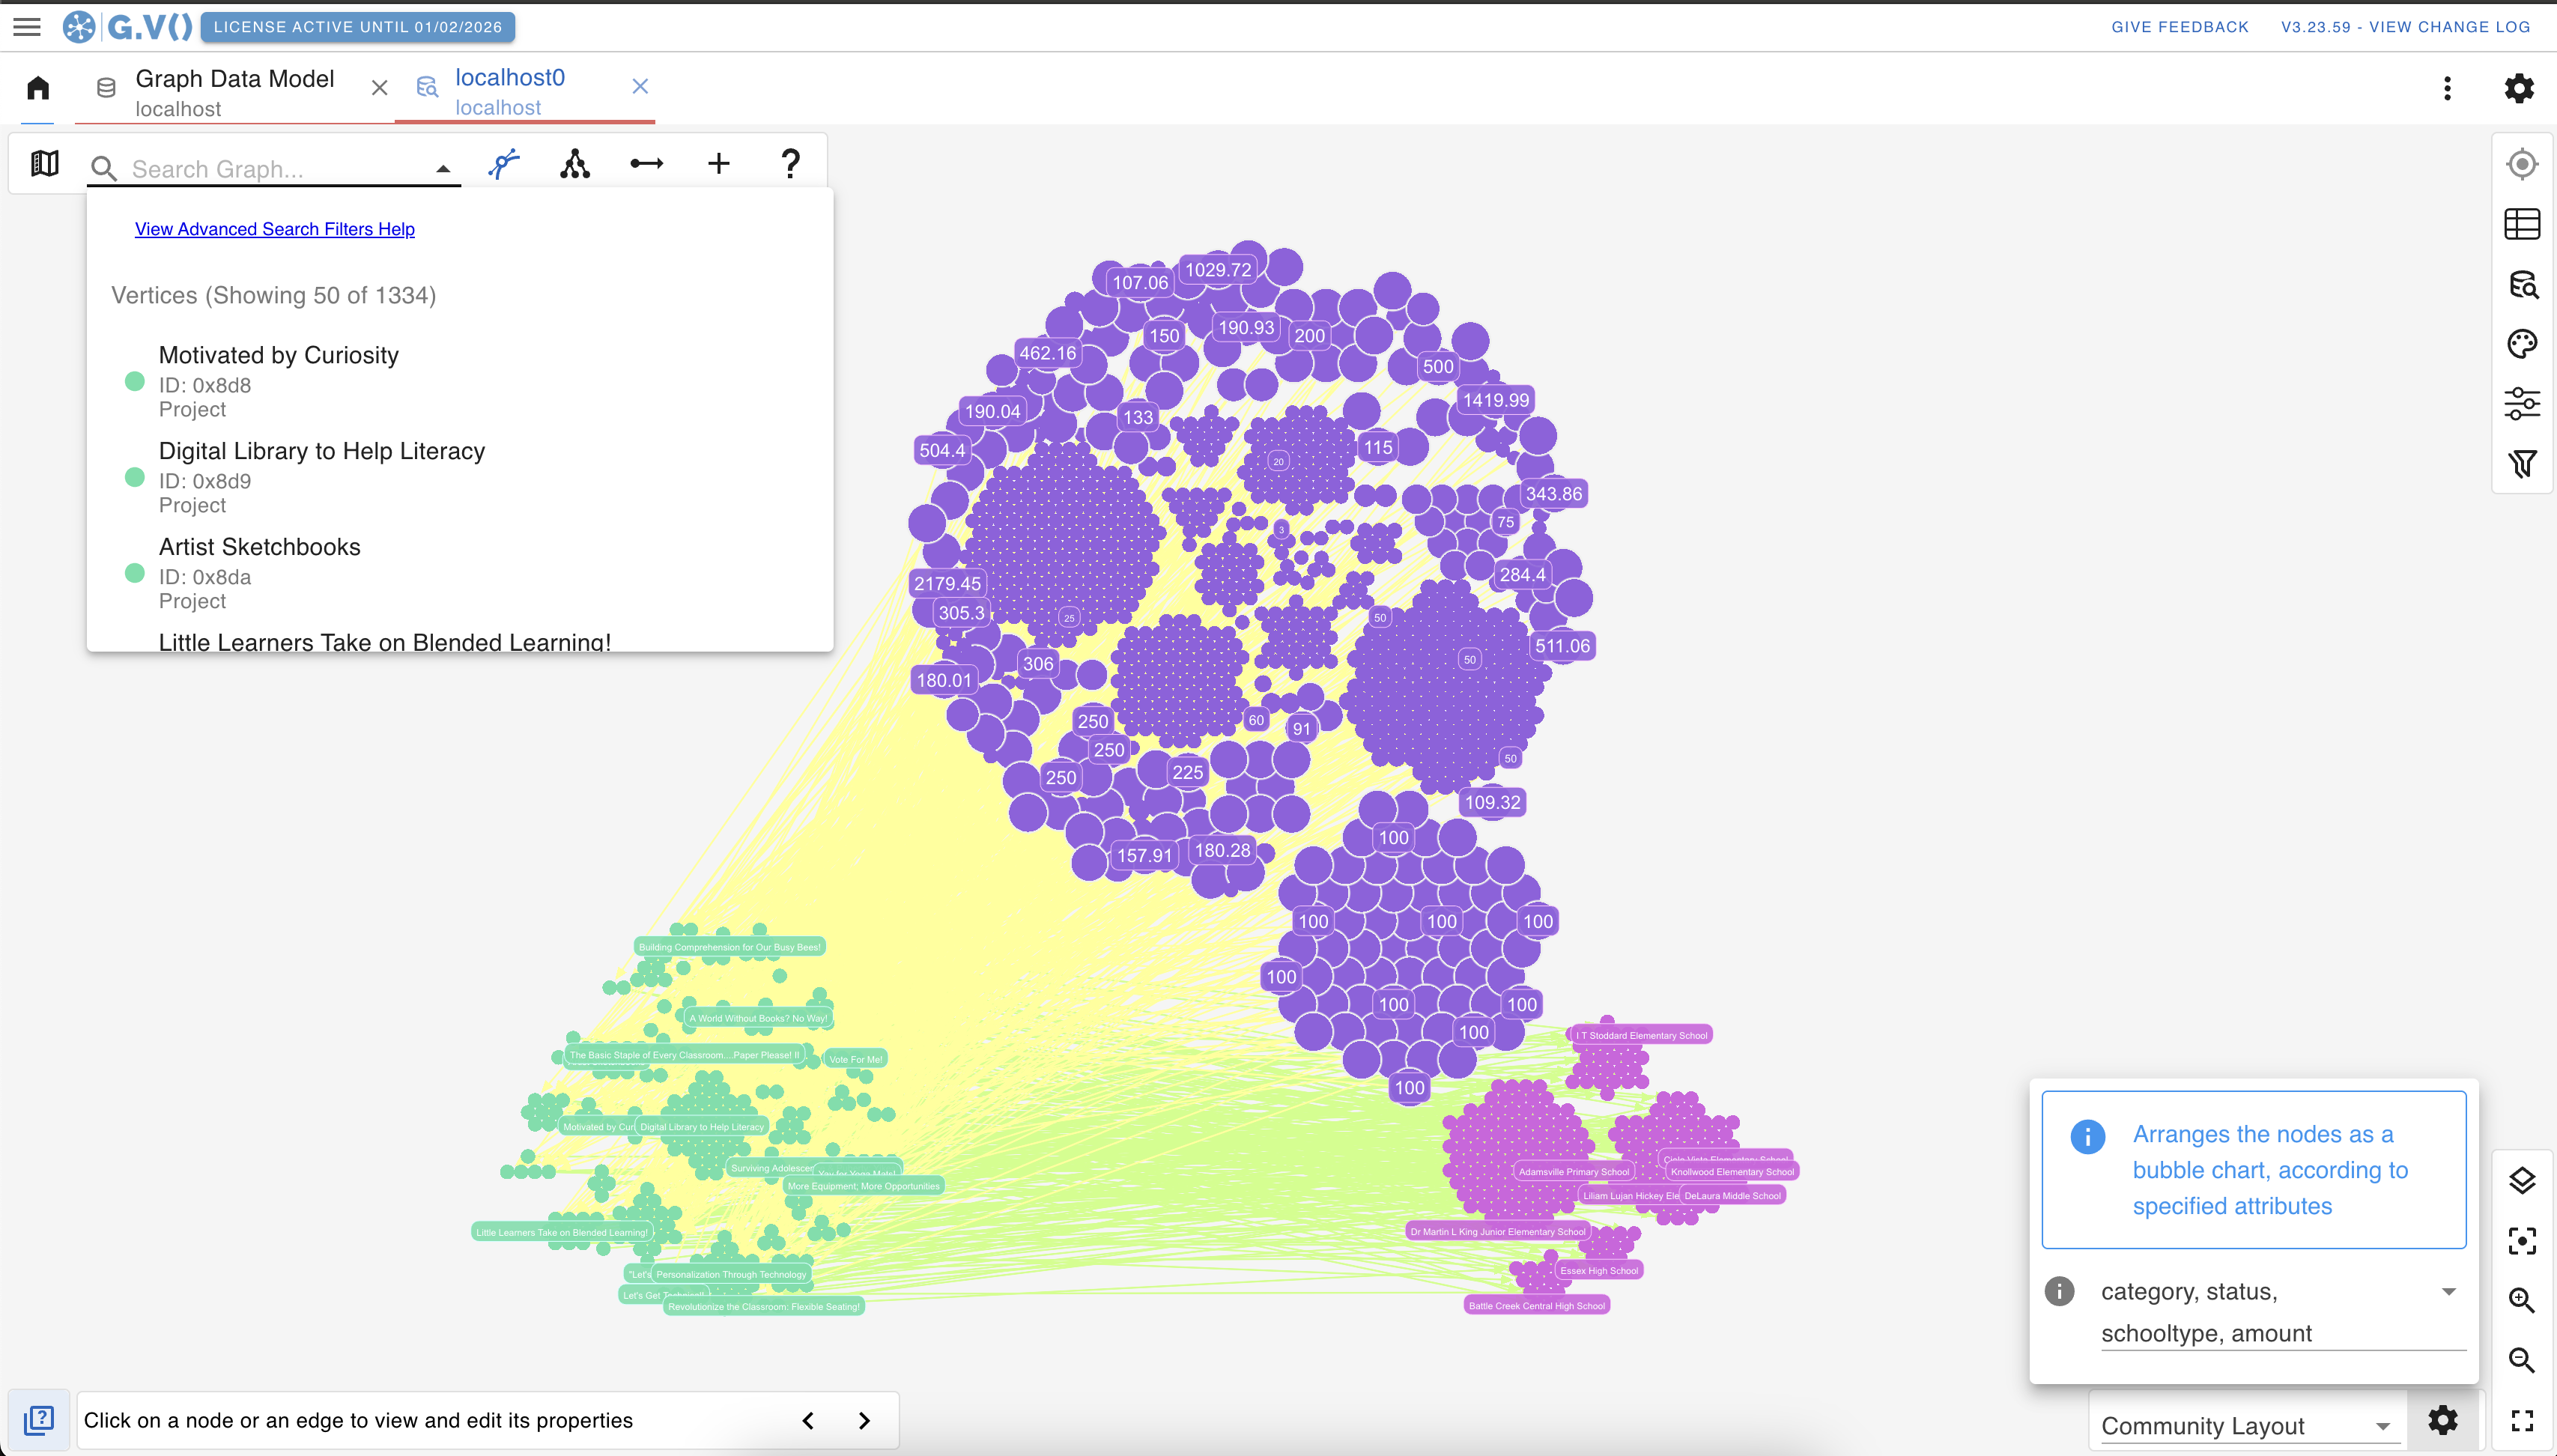
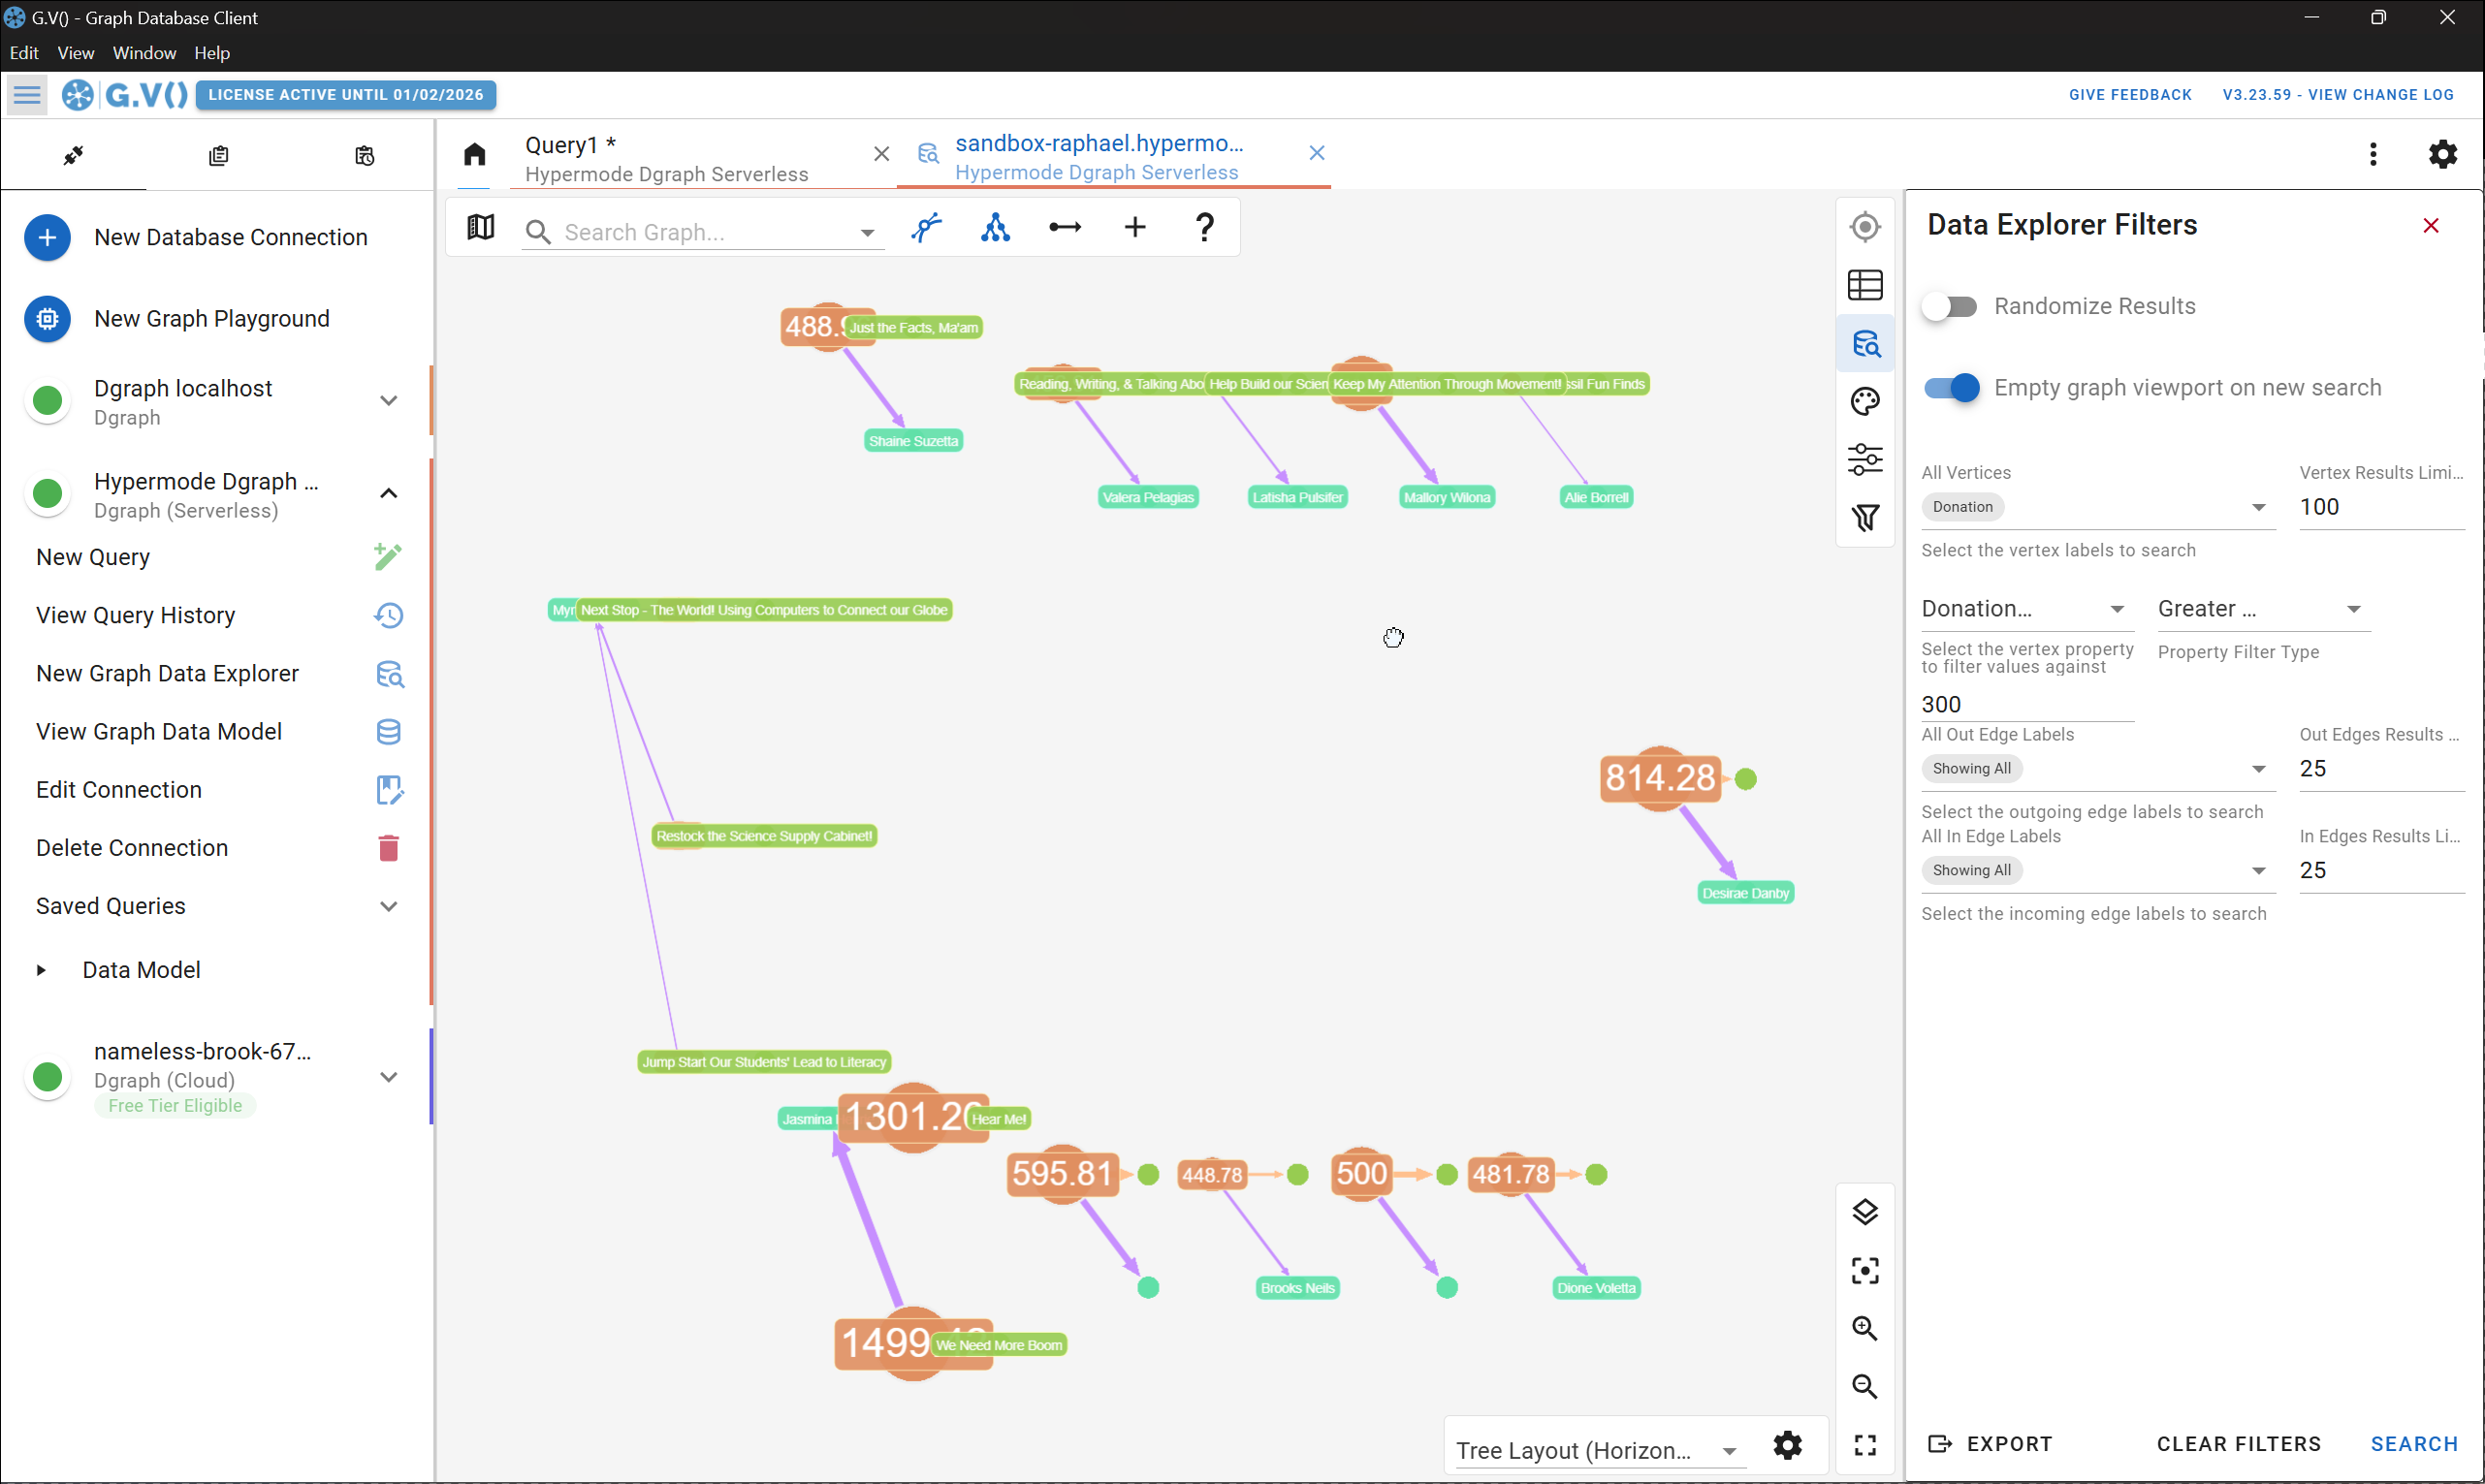
If you’re just looking to quickly get to parts of your graph using filters, G.V() has you covered. Our no-code graph data explorer lets you query your Dgraph data from simple filters, without the need to write DQL queries. From there, you can search, filter and further explore your graph, as well as use the full set of functionalities our graph visualization tool offers.
It’s the simplest way to turn your data to visual insights. See for yourself:
One-click Dgraph Schema visualization
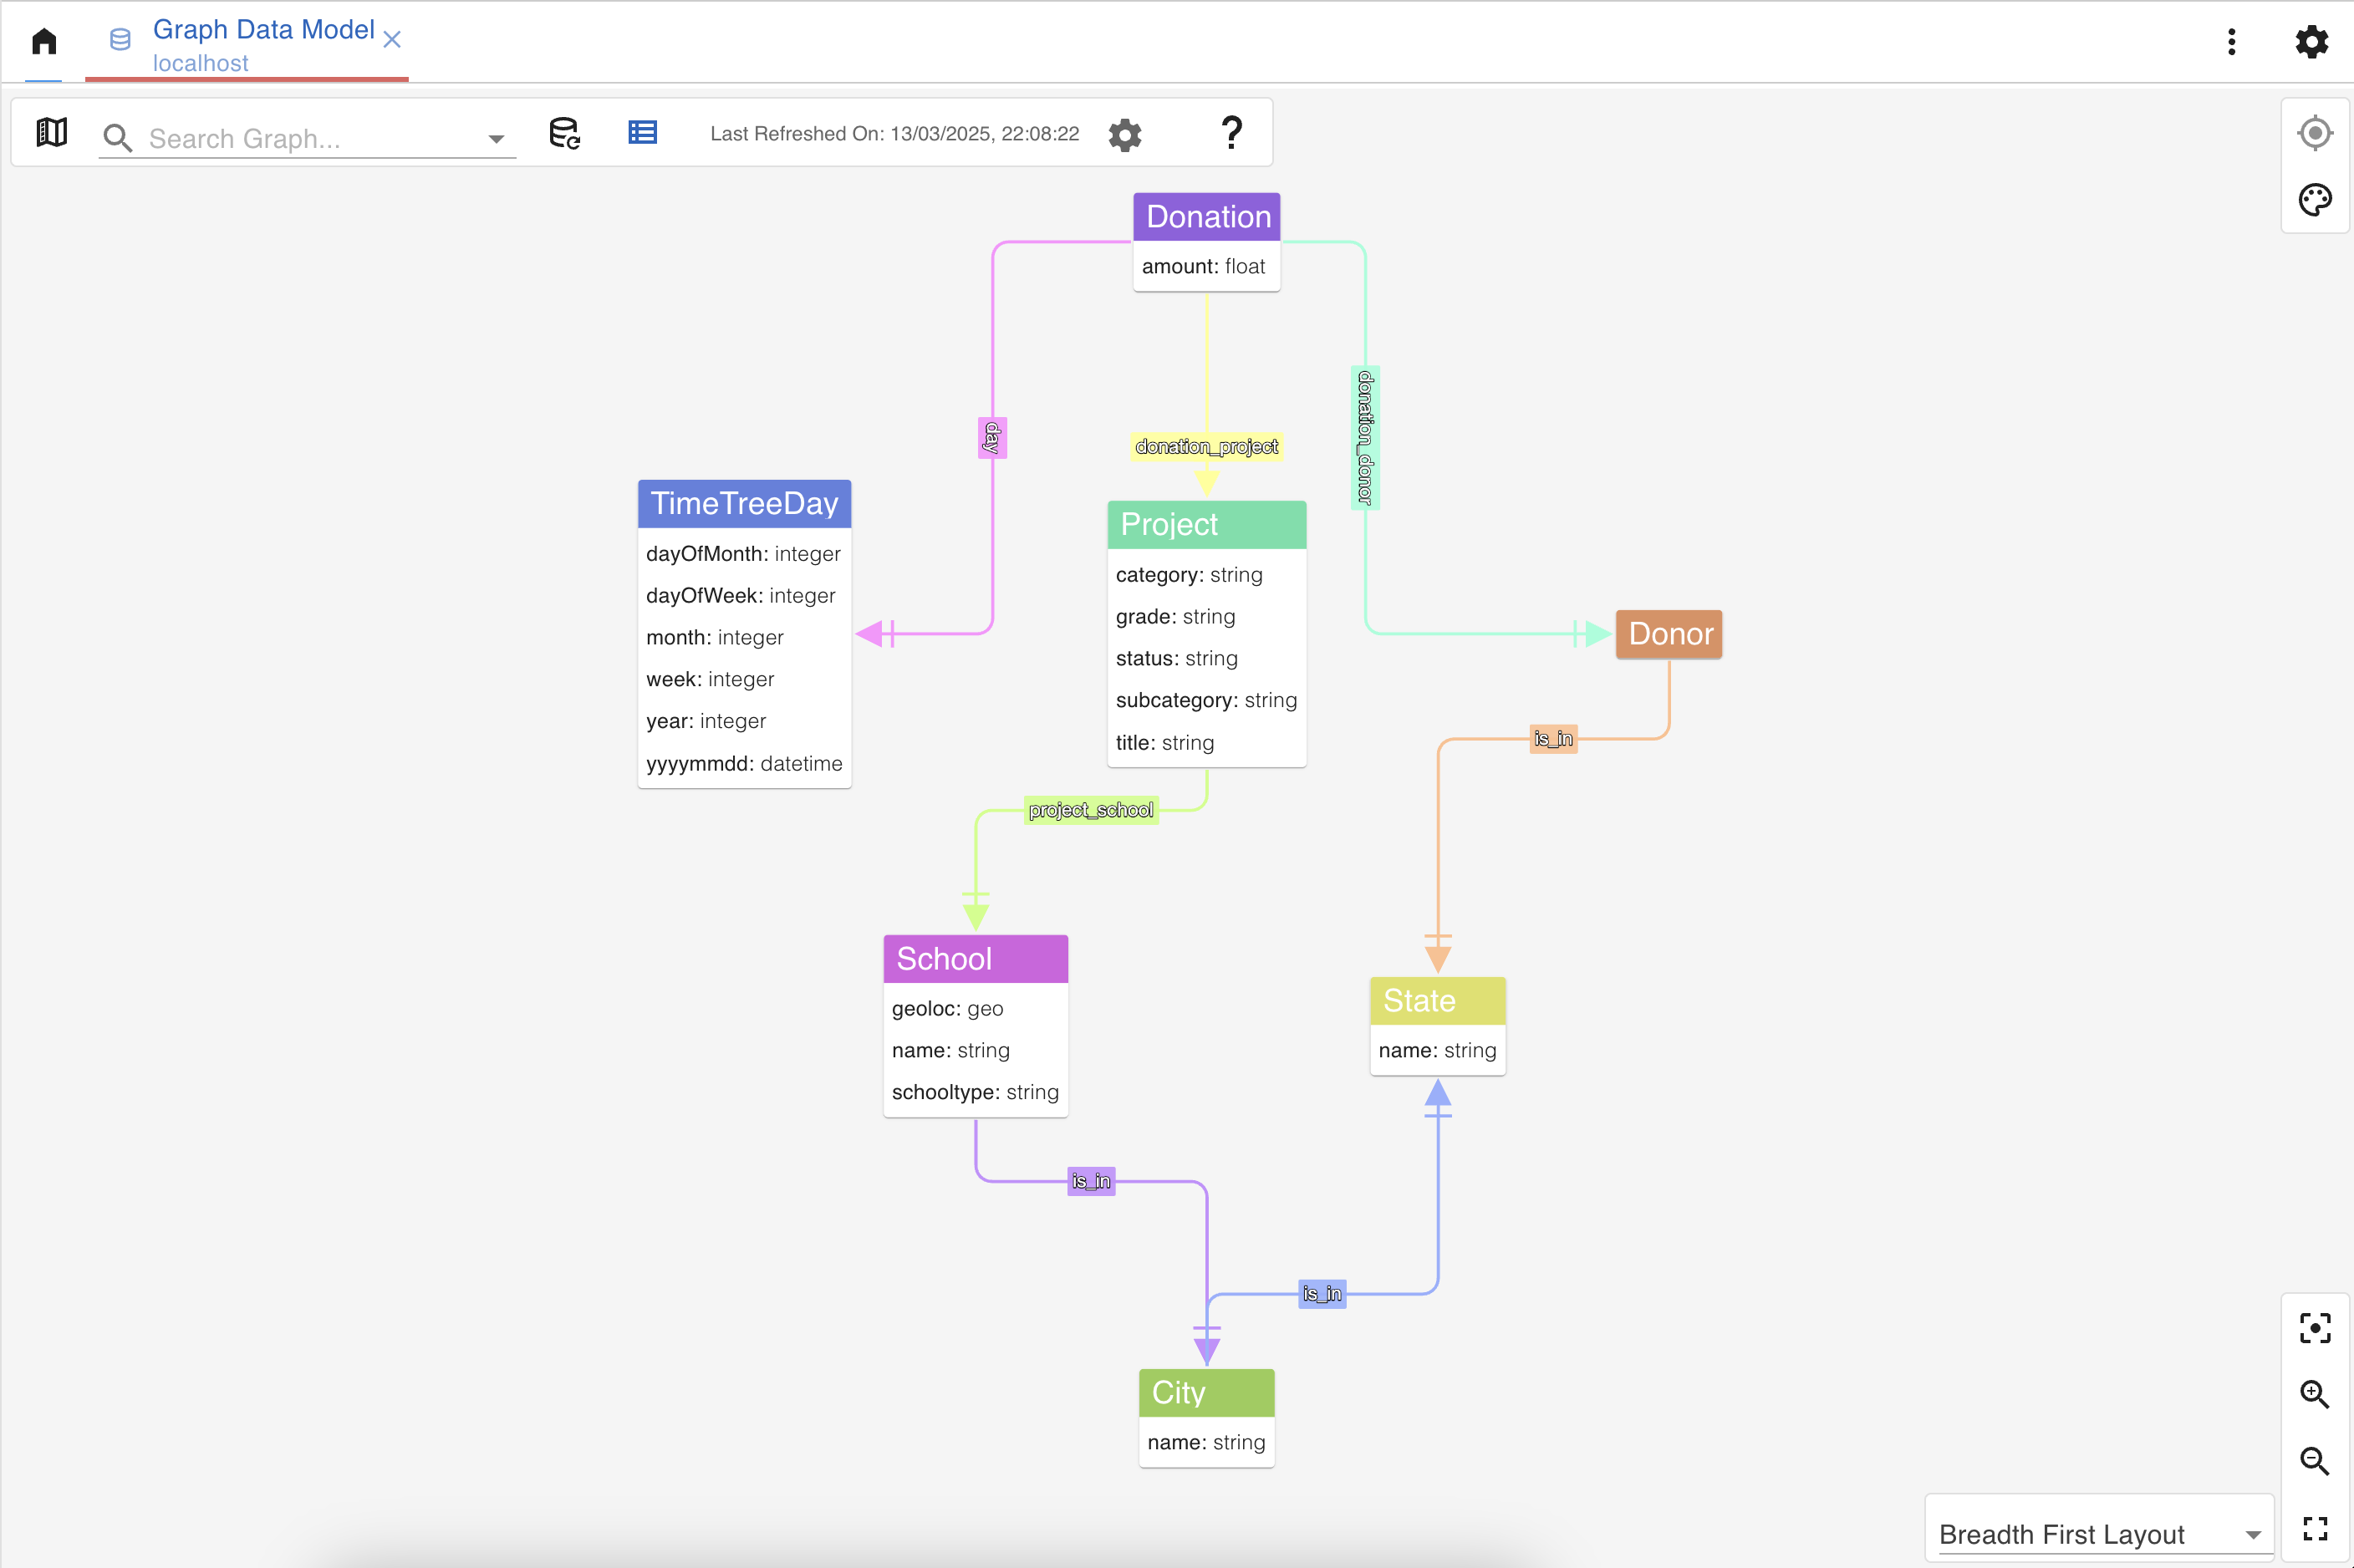
G.V() automatically loads your Dgraph schema to enhance the features of our software. We also offer an intuitive entity-relationship diagram display of your graph data model that you can refer to when writing queries or showcasing your graph project. This makes collaboration between developers considerably easier as everyone can access a consistent view of the schema through G.V().
The graph data model viewer is available for each connection configured on our software, meaning you can also compare different models side by side. Here’s a small snippet of this functionality:
Conclusion
Our goal is to equip every graph database user with the best tooling to perform day-to-day graph data analysis and management tasks. By adding support for Dgraph and Hypermode Graphs, we’re bringing those powerful tools right to you. Knowledge graphs play an essential role in solving use cases of fraud detection, supply chain analysis, GraphRAG for LLMs and many more.
Dgraph has a long history of solving these challenges for organisations and we’re thrilled that G.V() now gets to play a part in resolving these challenges hand in hand with Dgraph.
We’ve got more Dgraph specific features in store that we’re actively working on – so this is just the start.

![Cypher Labels: How to Organize Graph Nodes [Byte-Sized Cypher Series] Cypher Labels: How to Organize Graph Nodes [Byte-Sized Cypher Series]](https://gdotv.com/wp-content/uploads/2026/01/labels-vs-properties-byte-sized-cypher-query-langauge-video-series.jpg)