G.V() 3.21.49: Spanner Graph support, graph visualization improvements, and more!
 3.21.49: Spanner Graph support, graph visualization improvements, and more!")
Graph visualization improvements
We’ve reworked the way we display vertices and edges loaded interactively in our graph view to provide a smoother (and overall just better looking) transition of elements and their layout.
This is particularly useful when using our interactive graph data browser as loaded vertex neighboors are much easier to visually track on the currently active graph layout as they’re being rendered. There’s no better way to explain what changed than by showing what it now looks like:
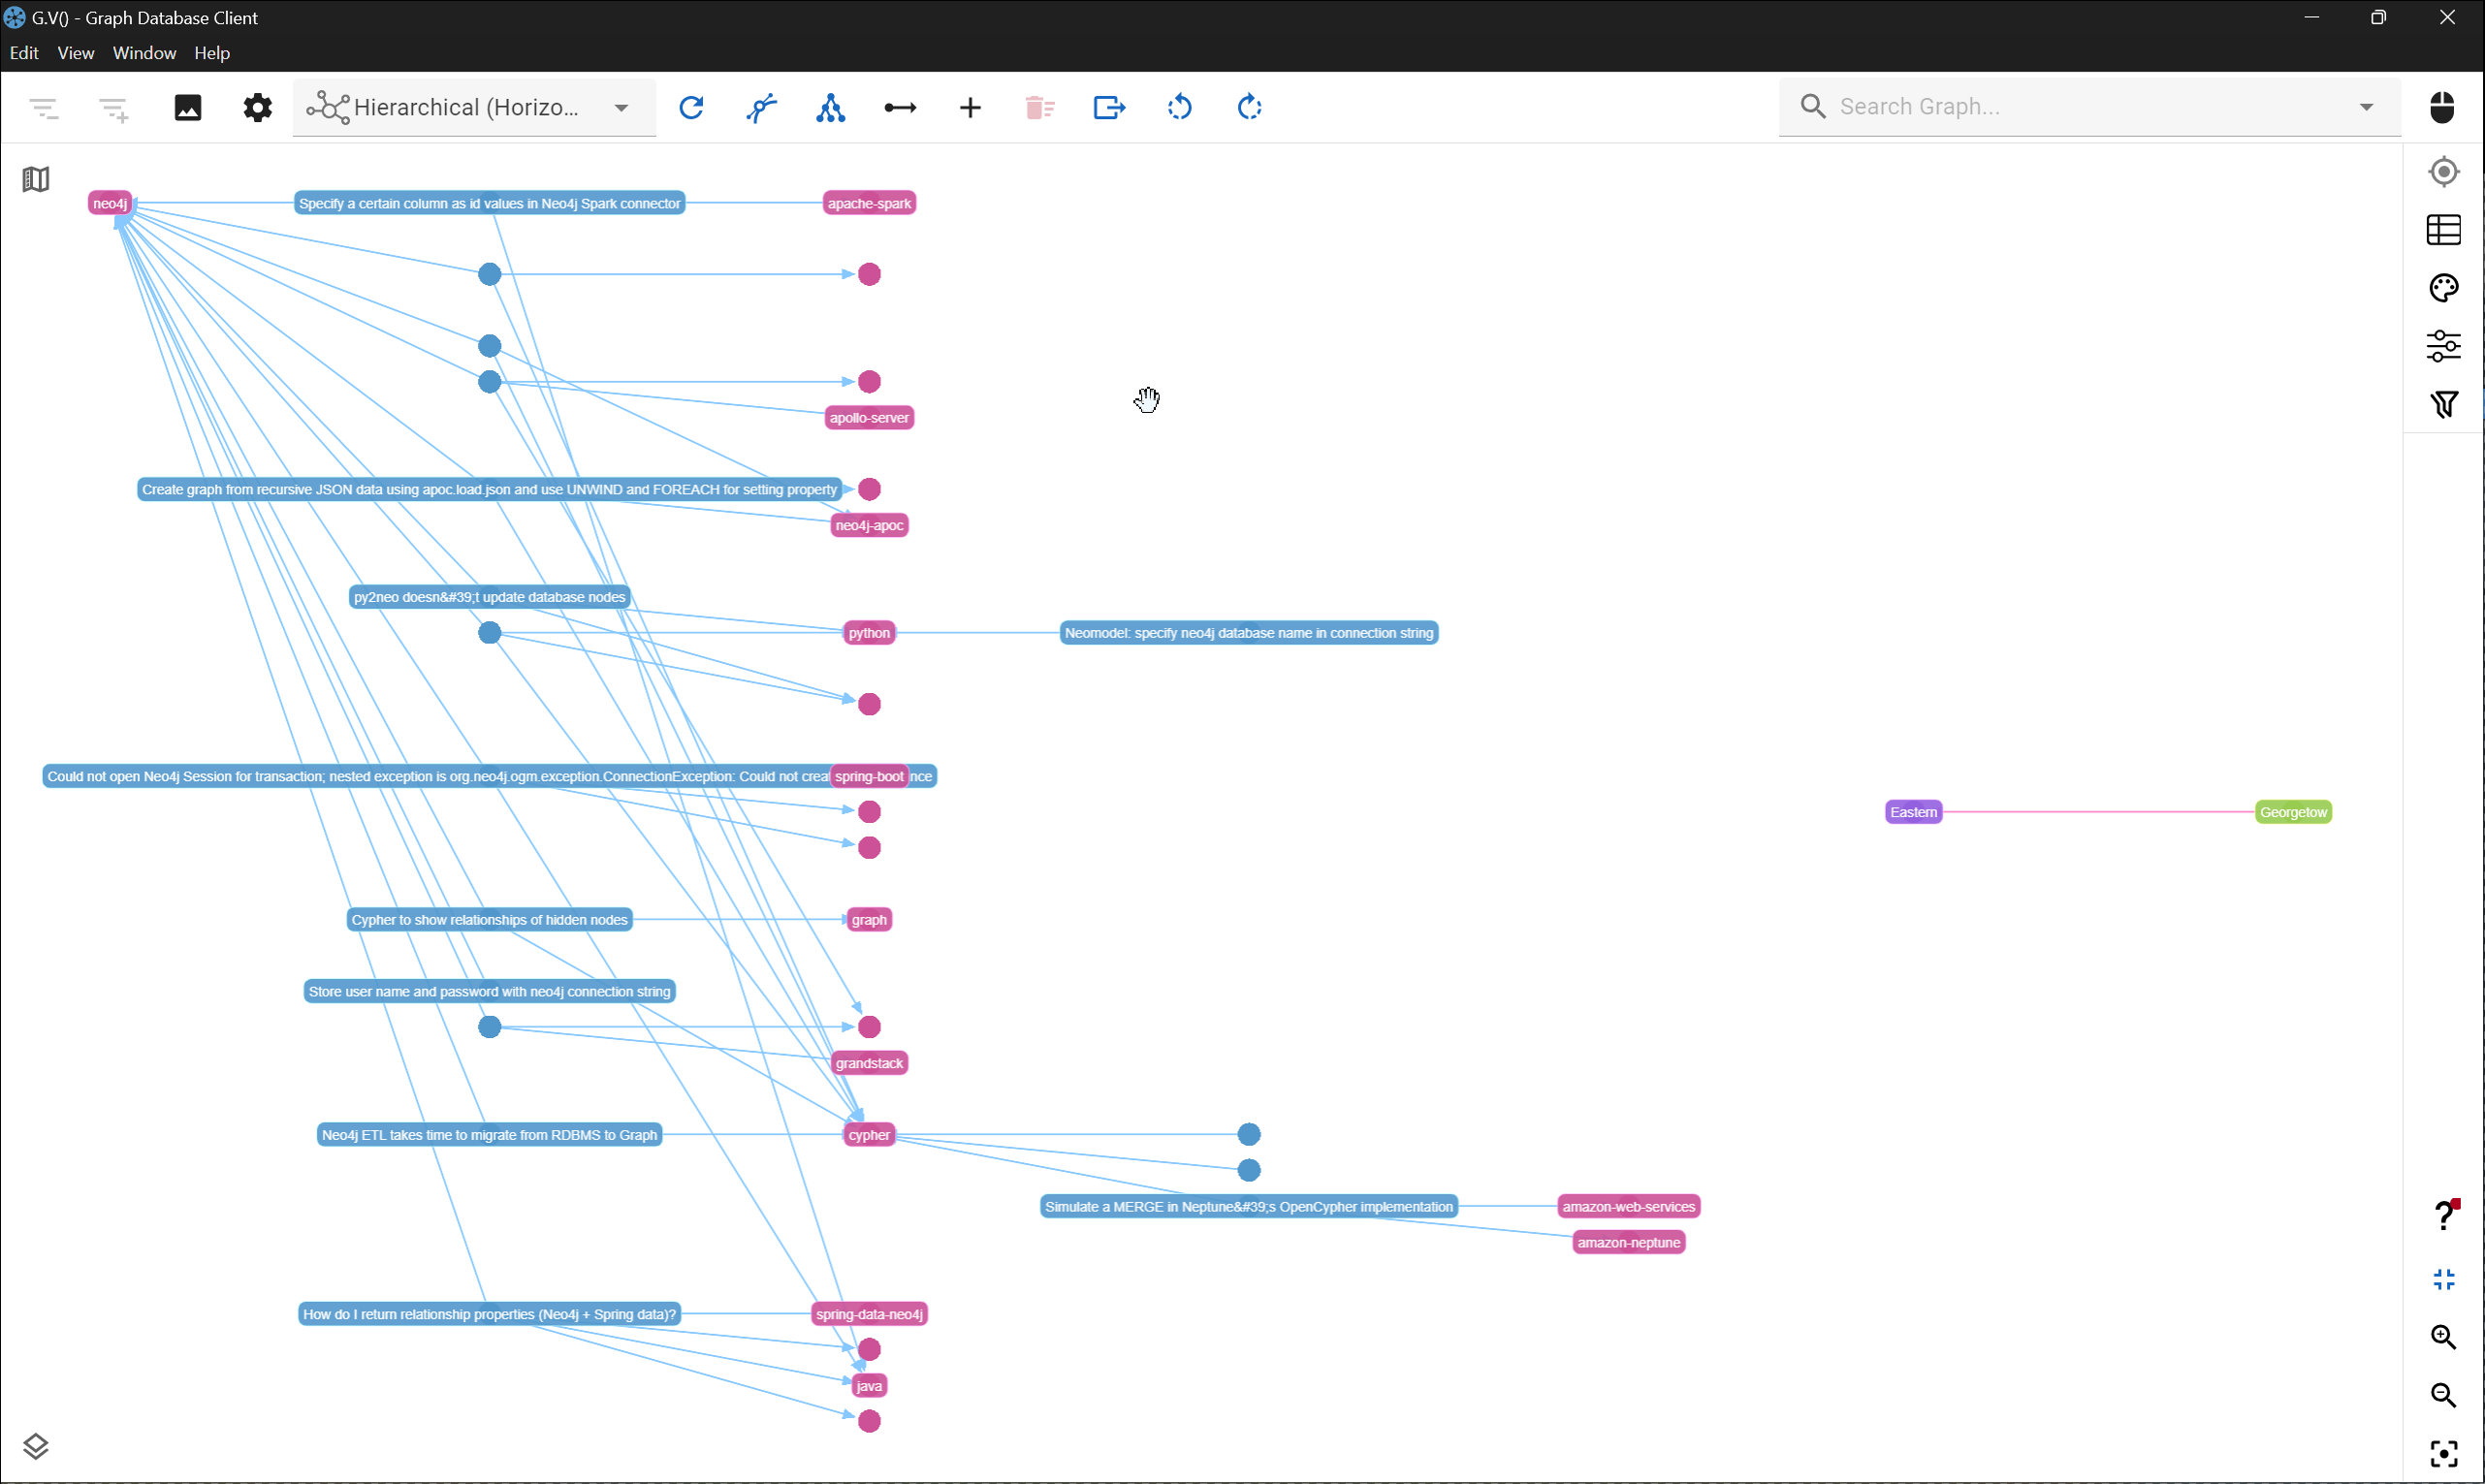
This improvement is particularly noticeable when using highly predictable layout algorithms such as our hierarchical, circular, and grid layouts.
This upgrade is a first step in the overhaul we’re planning for the graph exploration features in G.V(). In the future, we will be introducing new ways to load data interactively with higher flexibility in terms of filtering and path finding.
Better edges and vertices table views
We’ve upgraded most of the table displays in G.V() to use Vuetify’s native data table view, providing a far more consistent look and feel to the rest of the application, as well as a significant boost of performance.
The new vertex/edge tables can render hundreds of thousands of records without stuttering anymore, the initial time to render is also considerably faster. Tables now scroll horizontally which allows displaying vertices (or edges) with many properties without compacting columns to an unreadable size.
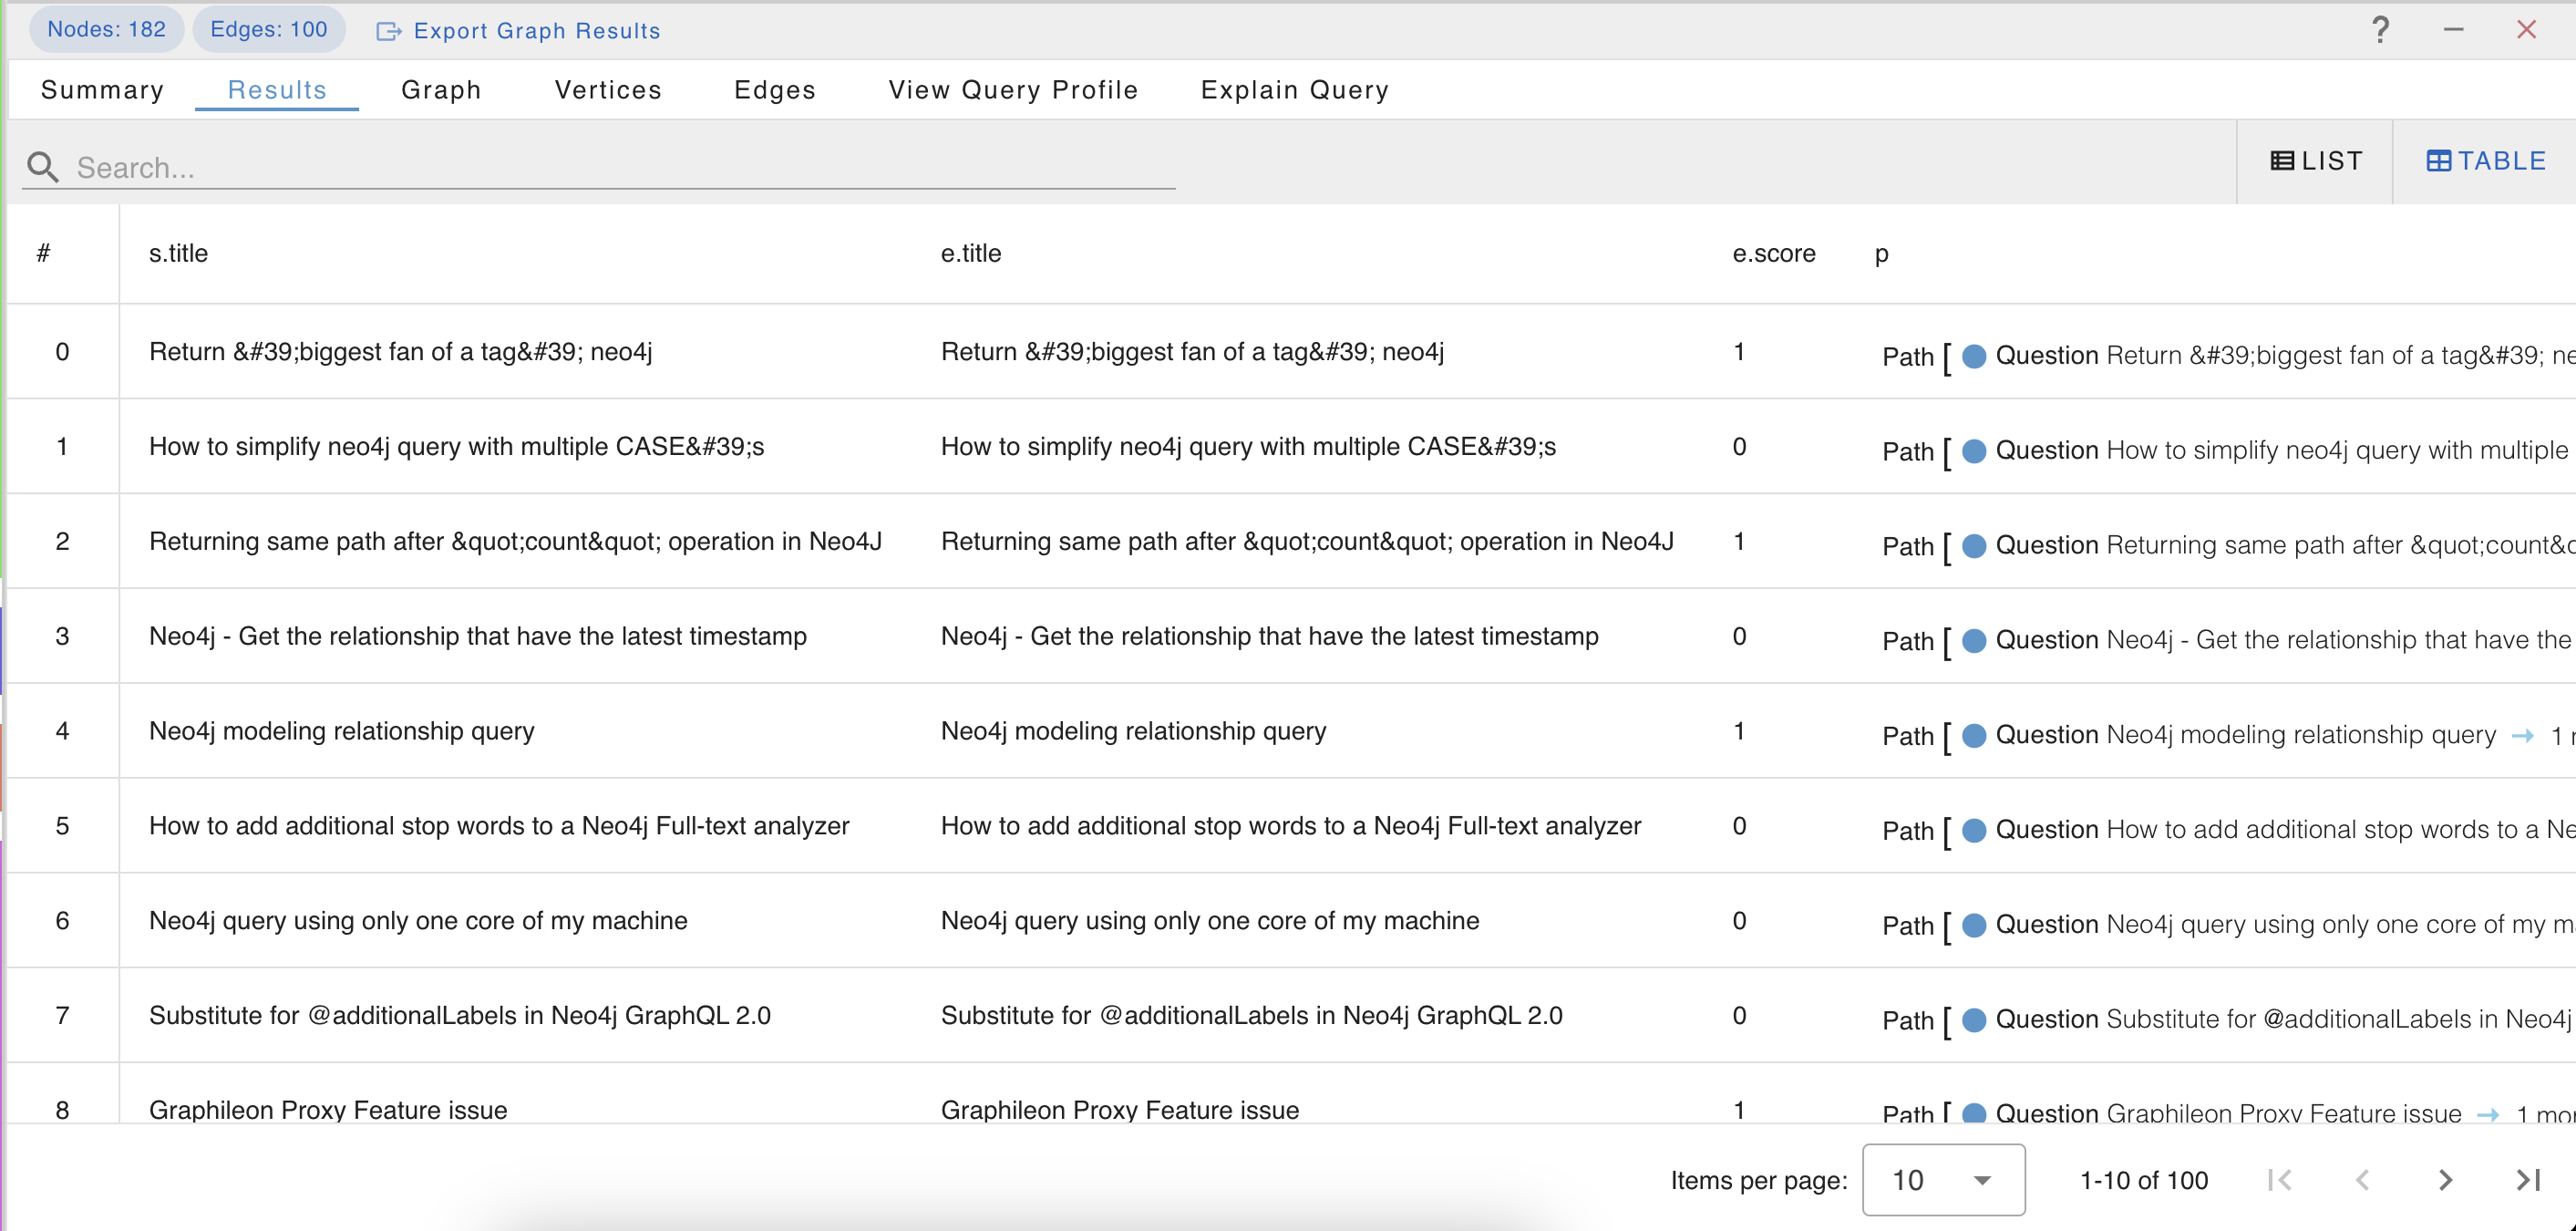
New tabular results display for Cypher
The Cypher query language, which we’ve recently brought full-support for, structures its query results in a tabular format (columns & rows) which our Object browser view didn’t specifically account for.
To provide a results visualization experience in line with expectations for Cypher querying products (e.g. Neo4j browser, Memgraph lab, etc), we’ve added a new table display that features all of the cool visuals we’ve built on our object browser to identify different object types returned by a query, simply transposed to a table view. It allows for a more intuitive comparison of Cypher query result rows.
Google Cloud Spanner Graph support
As we’ve previously mentioned, and coinciding with Spanner Graph’s own General Availability announcement, G.V() is now compatible with Spanner Graph, allowing you to easily query and visualize its graph data. This release is the first step in bringing support for Google’s new offering, and will be following by further enhancements and new features in the coming months. In the meantime you can plug into your Spanner Graph instance in just a few seconds with G.V(), and start visualizing your graph data instantly.
What’s coming next?
We’re continuing to work on expanding support to various Labeled Property Graph databases, as well as enhancing the core user experience of G.V(). We’ve recently posted a dev preview for Kùzu support on LinkedIn (give us a follow for the latest product news and previews!). We’ve got more cool surprises in store, and you can expect monthly releases to continue throughout 2025.
If you’ve got specific features you’d like to see on G.V(), or other improvements don’t hesitate to get in touch with us either on LinkedIn or via email at support@gdotv.com. User feedback has and always will shape the roadmap for our product!


