How does G.V() compare with Neo4j Browser? Let’s find out!
 compare with Neo4j Browser? Let’s find out!")
Introduction
When it comes to working with a graph database, the tools and client you use play a crucial role.
While database performance is important, and you should always select the graph database that suits your application’s needs, the way developers engage with that database is equally significant. The right database tooling can save time by improving your productivity and breaking down barriers to adoption.
Today we’ll be comparing Neo4j Graph Database Browser (a.k.a. ‘Neo4j Browser’) and our very own graph database client, G.V(), looking at their key features and differences in an attempt to provide an unbiased comparison of the two.
An Overview of Neo4j Graph Database Browser
Neo4j Browser is a query and visualization tool for the Cypher language focused on the developer experience. It offers multiple formats for viewing your query results and exploring your graph data, along with the ability to write, edit, and evaluate your results.
A single Neo4j Browser instance/deployment is always targetted at a single deployment of a Neo4j or AuraDB database. This means you’ll need as many Neo4j Browser windows as you have databases to work with.
The Cypher Query & Graph Visualization Tools in Neo4j Browser
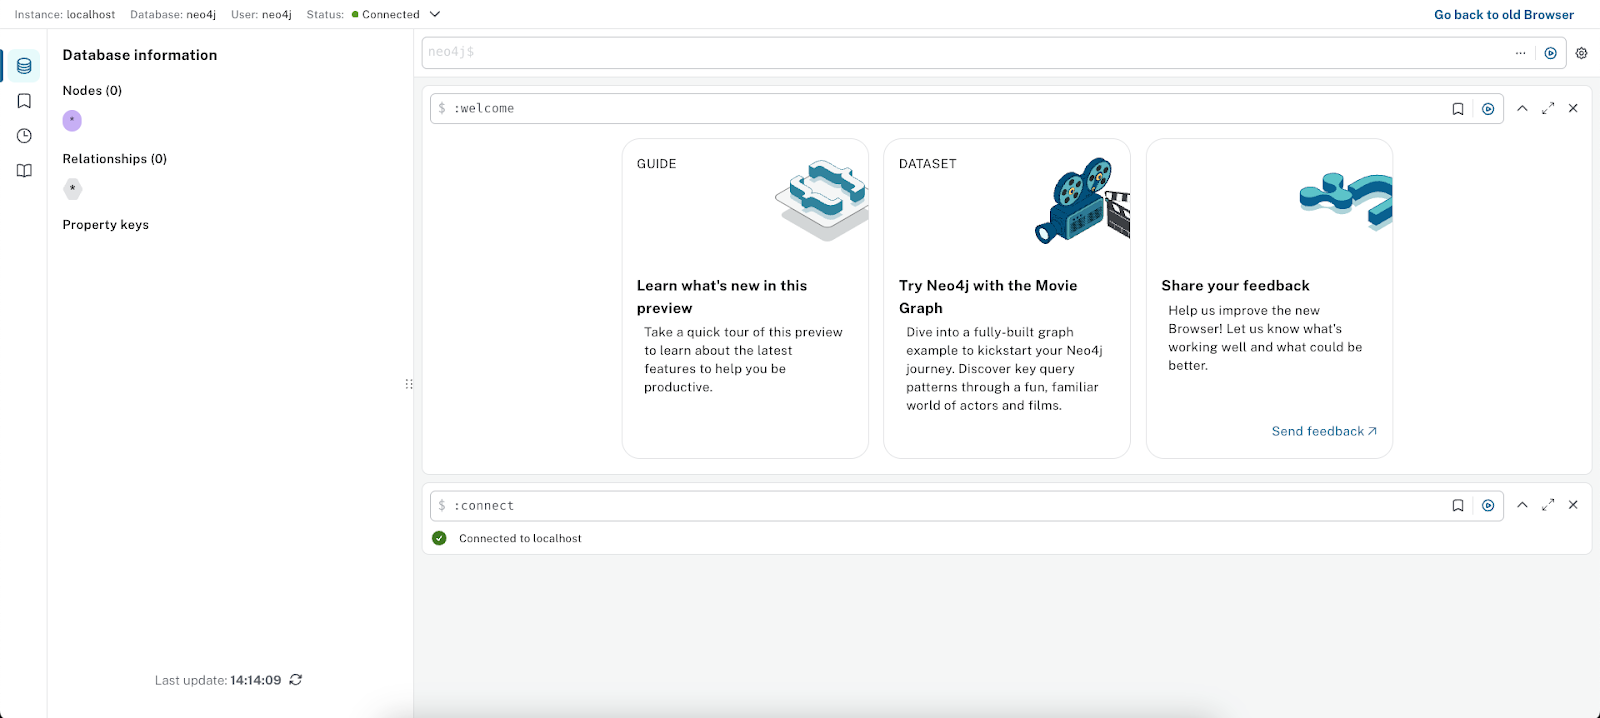
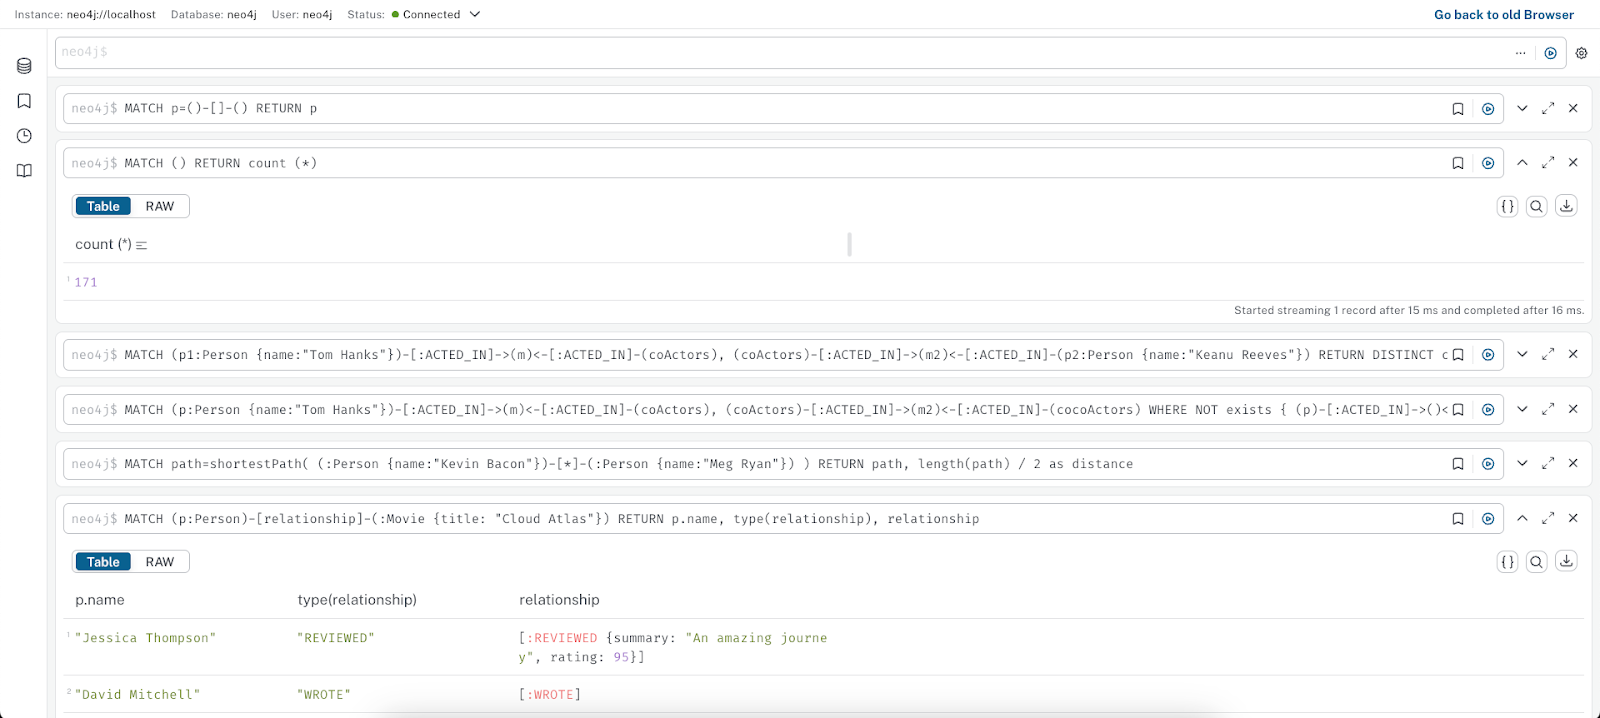
Shown below is Neo4j Browser’s query editor and results window:
The Cypher query editor has pretty much everything you would expect of a quality tool, such as autocomplete, syntax highlighting, and a very informative error highlighting system.
For instance, if your query does not contain a concluding step such as ‘RETURN’ or ‘FINISH’, it will let you know this directly in the query editor.
This is rather helpful for less experienced users, as is the example Movie dataset which provides plenty of example queries to get started with.

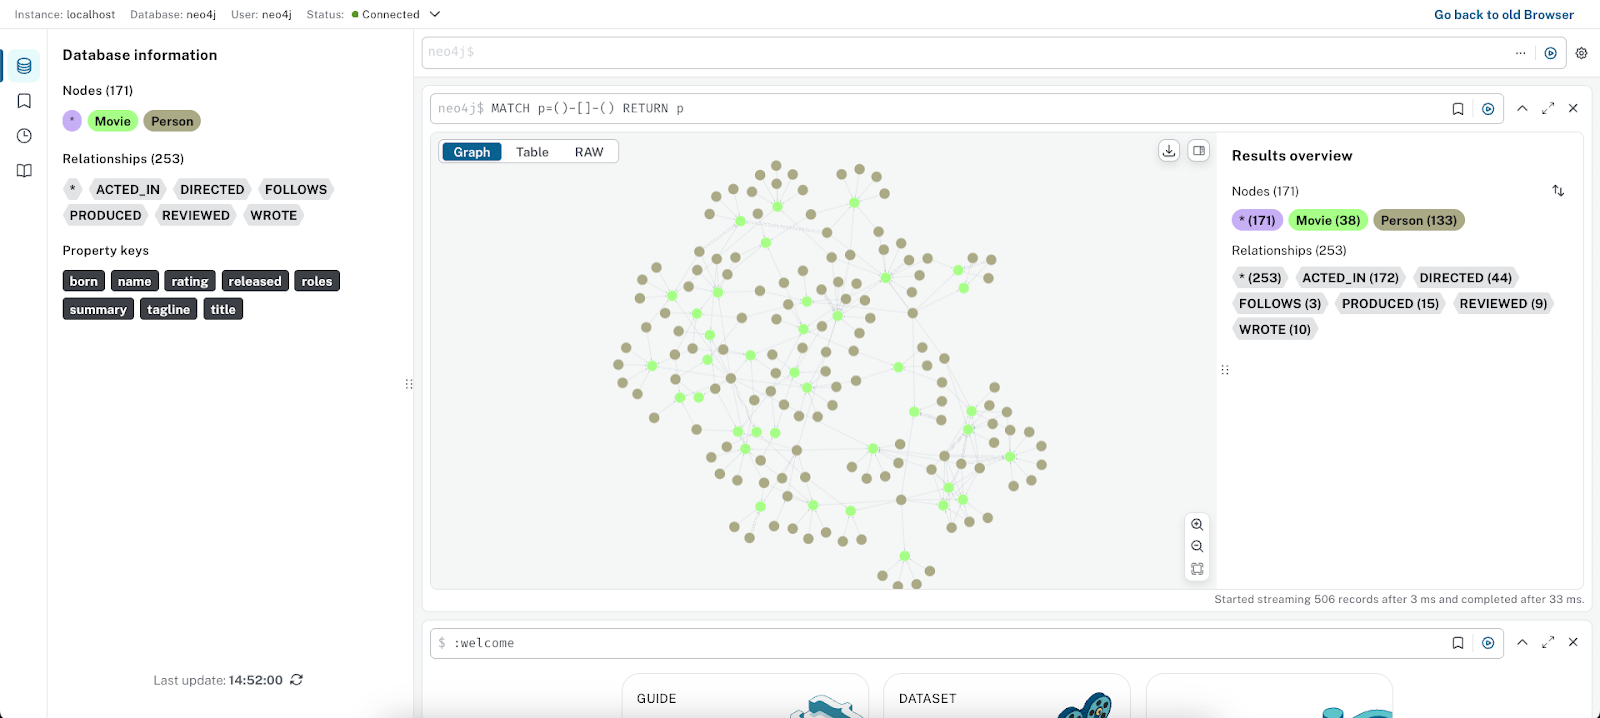
One thing we found to be missing from Neo4j Browser is the ability to display a graph when your query only returns relationships.
G.V() on the other hand will proactively fetch the extremities of your relationships to allow rendering a graph. Not a huge deal but it feels counter-intuitive that relationships alone aren’t enough to draw a graph from.
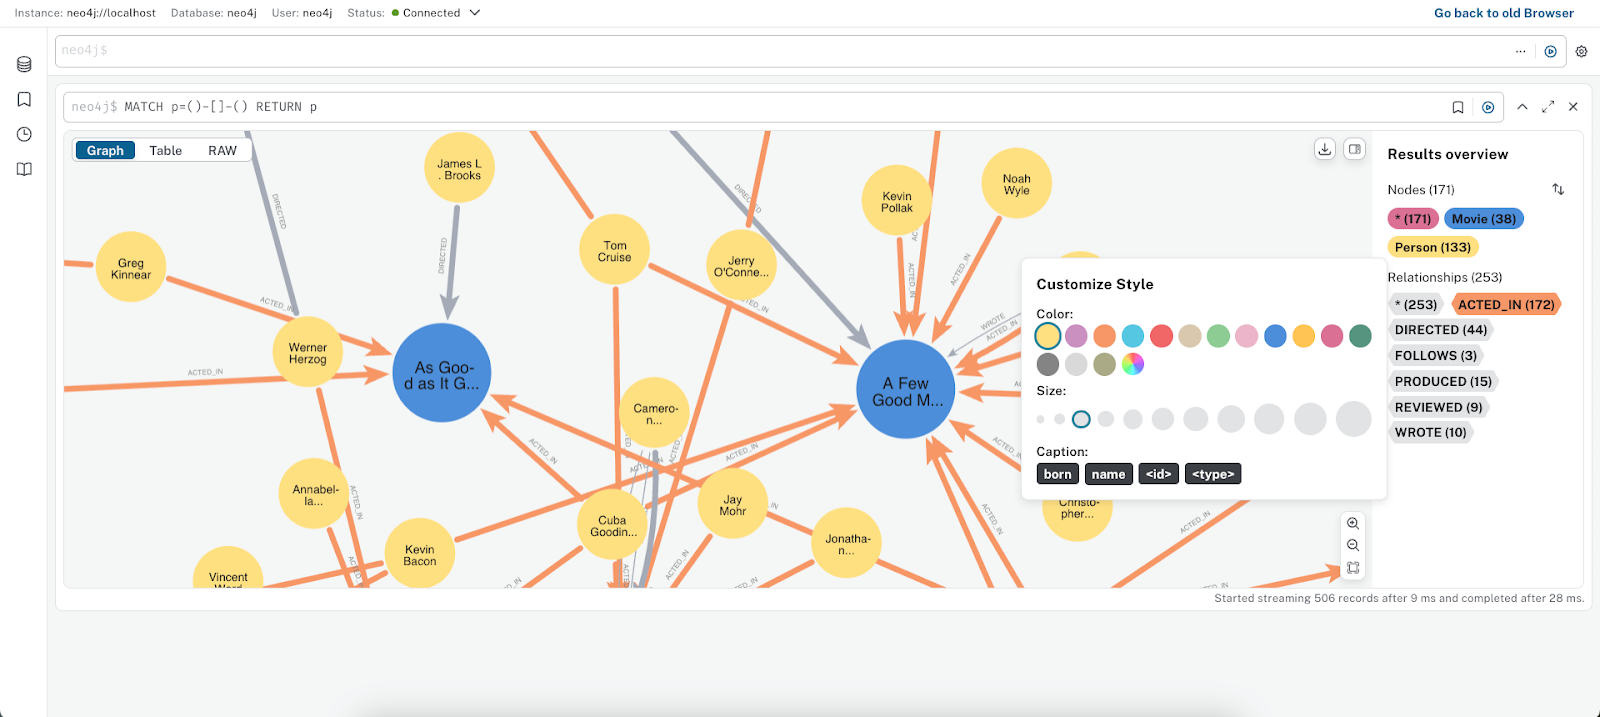
Everything here is displayed nicely, with the usual options for customizing elements like color, size/width, and caption. It’s simple to harness and quick to configure. It’s a shame there is no option to save and switch different stylesheets. This can be restricting when trying to quickly identify information via different visual styles from the same dataset.
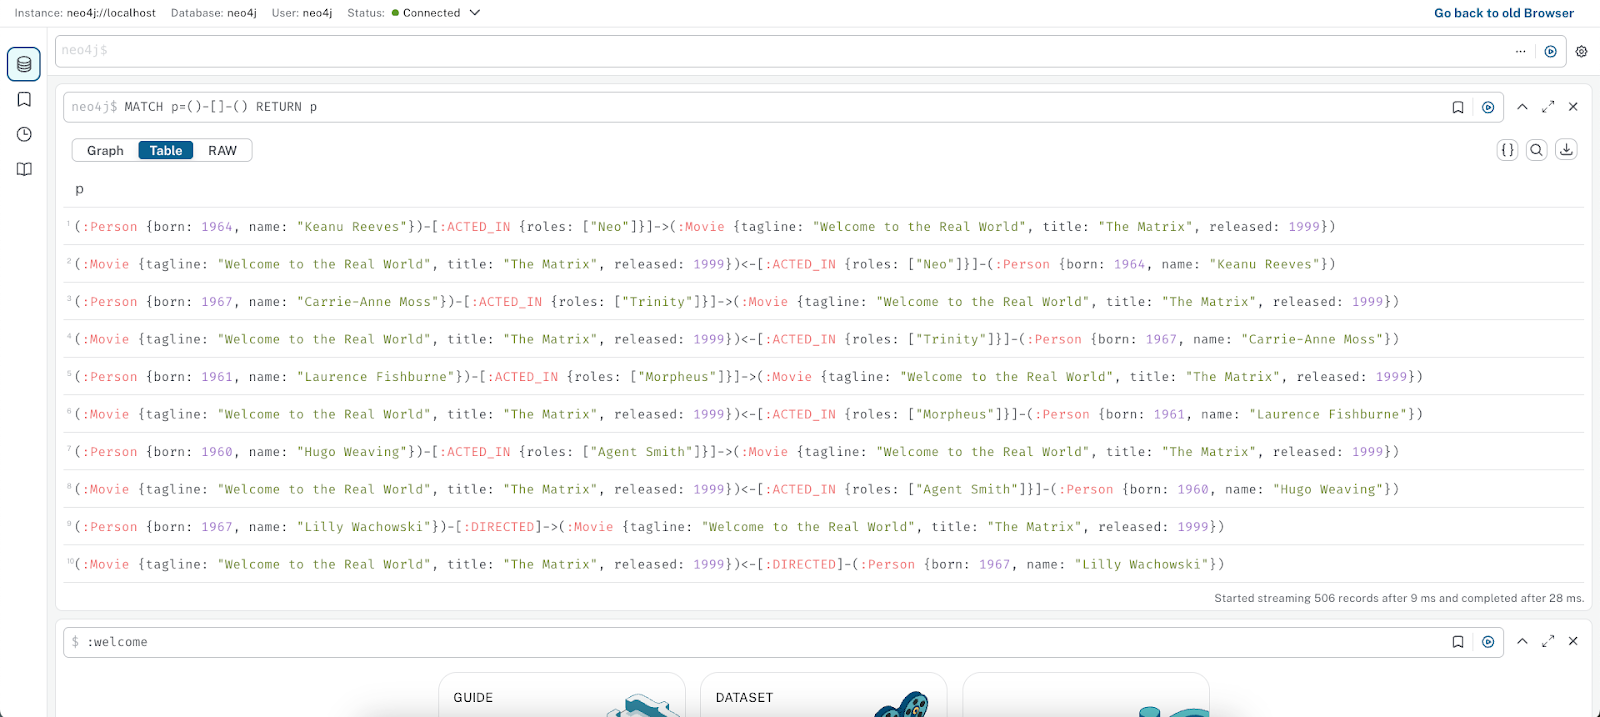
You can also view the results in a table view or “Raw” format:
You will quickly notice that the graph view is fairly light on features.
- Only one type of layout
- Unable to add/remove/modify elements without doing so via a query
- No search function (you can search/filter the table view, but not the graph) or data filtering
- No interactive exploration features such as expanding of node neighbors
Other Miscellaneous Features in Neo4j Browser
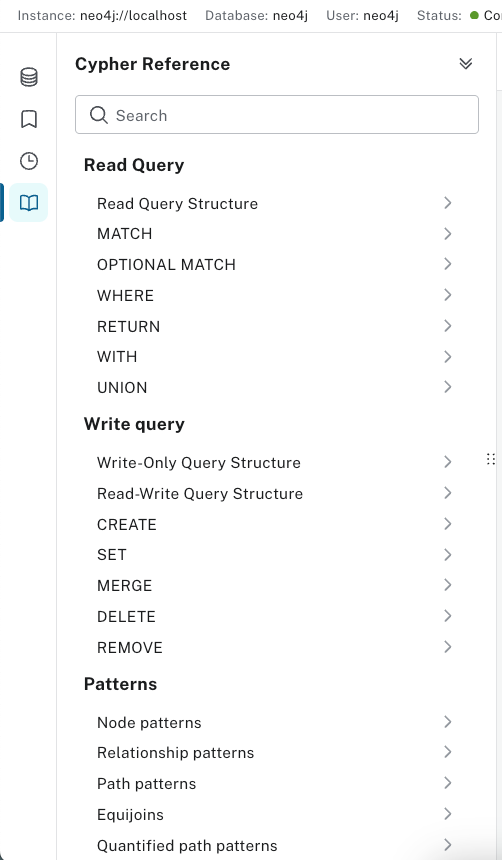
One particularly useful feature is the Cypher Reference on the sidebar. This gives you all the help you need to write Cypher queries. It’s easy to navigate and includes all the core information with links to Neo4j’s full documentation in case you need to dive deeper.
The last feature of Neo4j Browser we’ll cover here is how it deals with and separates multiple queries.
Database clients have historically arranged these in tabs laid out horizontally – this is the model G.V() follows – so having them vertically one on top of the other feels counter-intuitive.
You are able to minimize them to clean up the workspace, but it takes a bit of getting used to.
Neo4j Browser is great for getting started with Neo4j and Cypher, learning about graph databases and how to query them. It gives you the ability to quickly query your database and visualize results, albeit in a minimalistic fashion.
An Overview of the G.V() Graph Database Client
G.V() is a graph database client available for desktop on Windows, macOS, Linux, and as a deployable web application on AWS Marketplace.
Deploying or installing G.V() is quick and easy. If you’re hearing about our software for the first time, give it a try: you’ll be up and running before you can finish your coffee!
We’re a plug-and-play solution – connecting to your Neo4j/AuraDB instance takes under a minute.
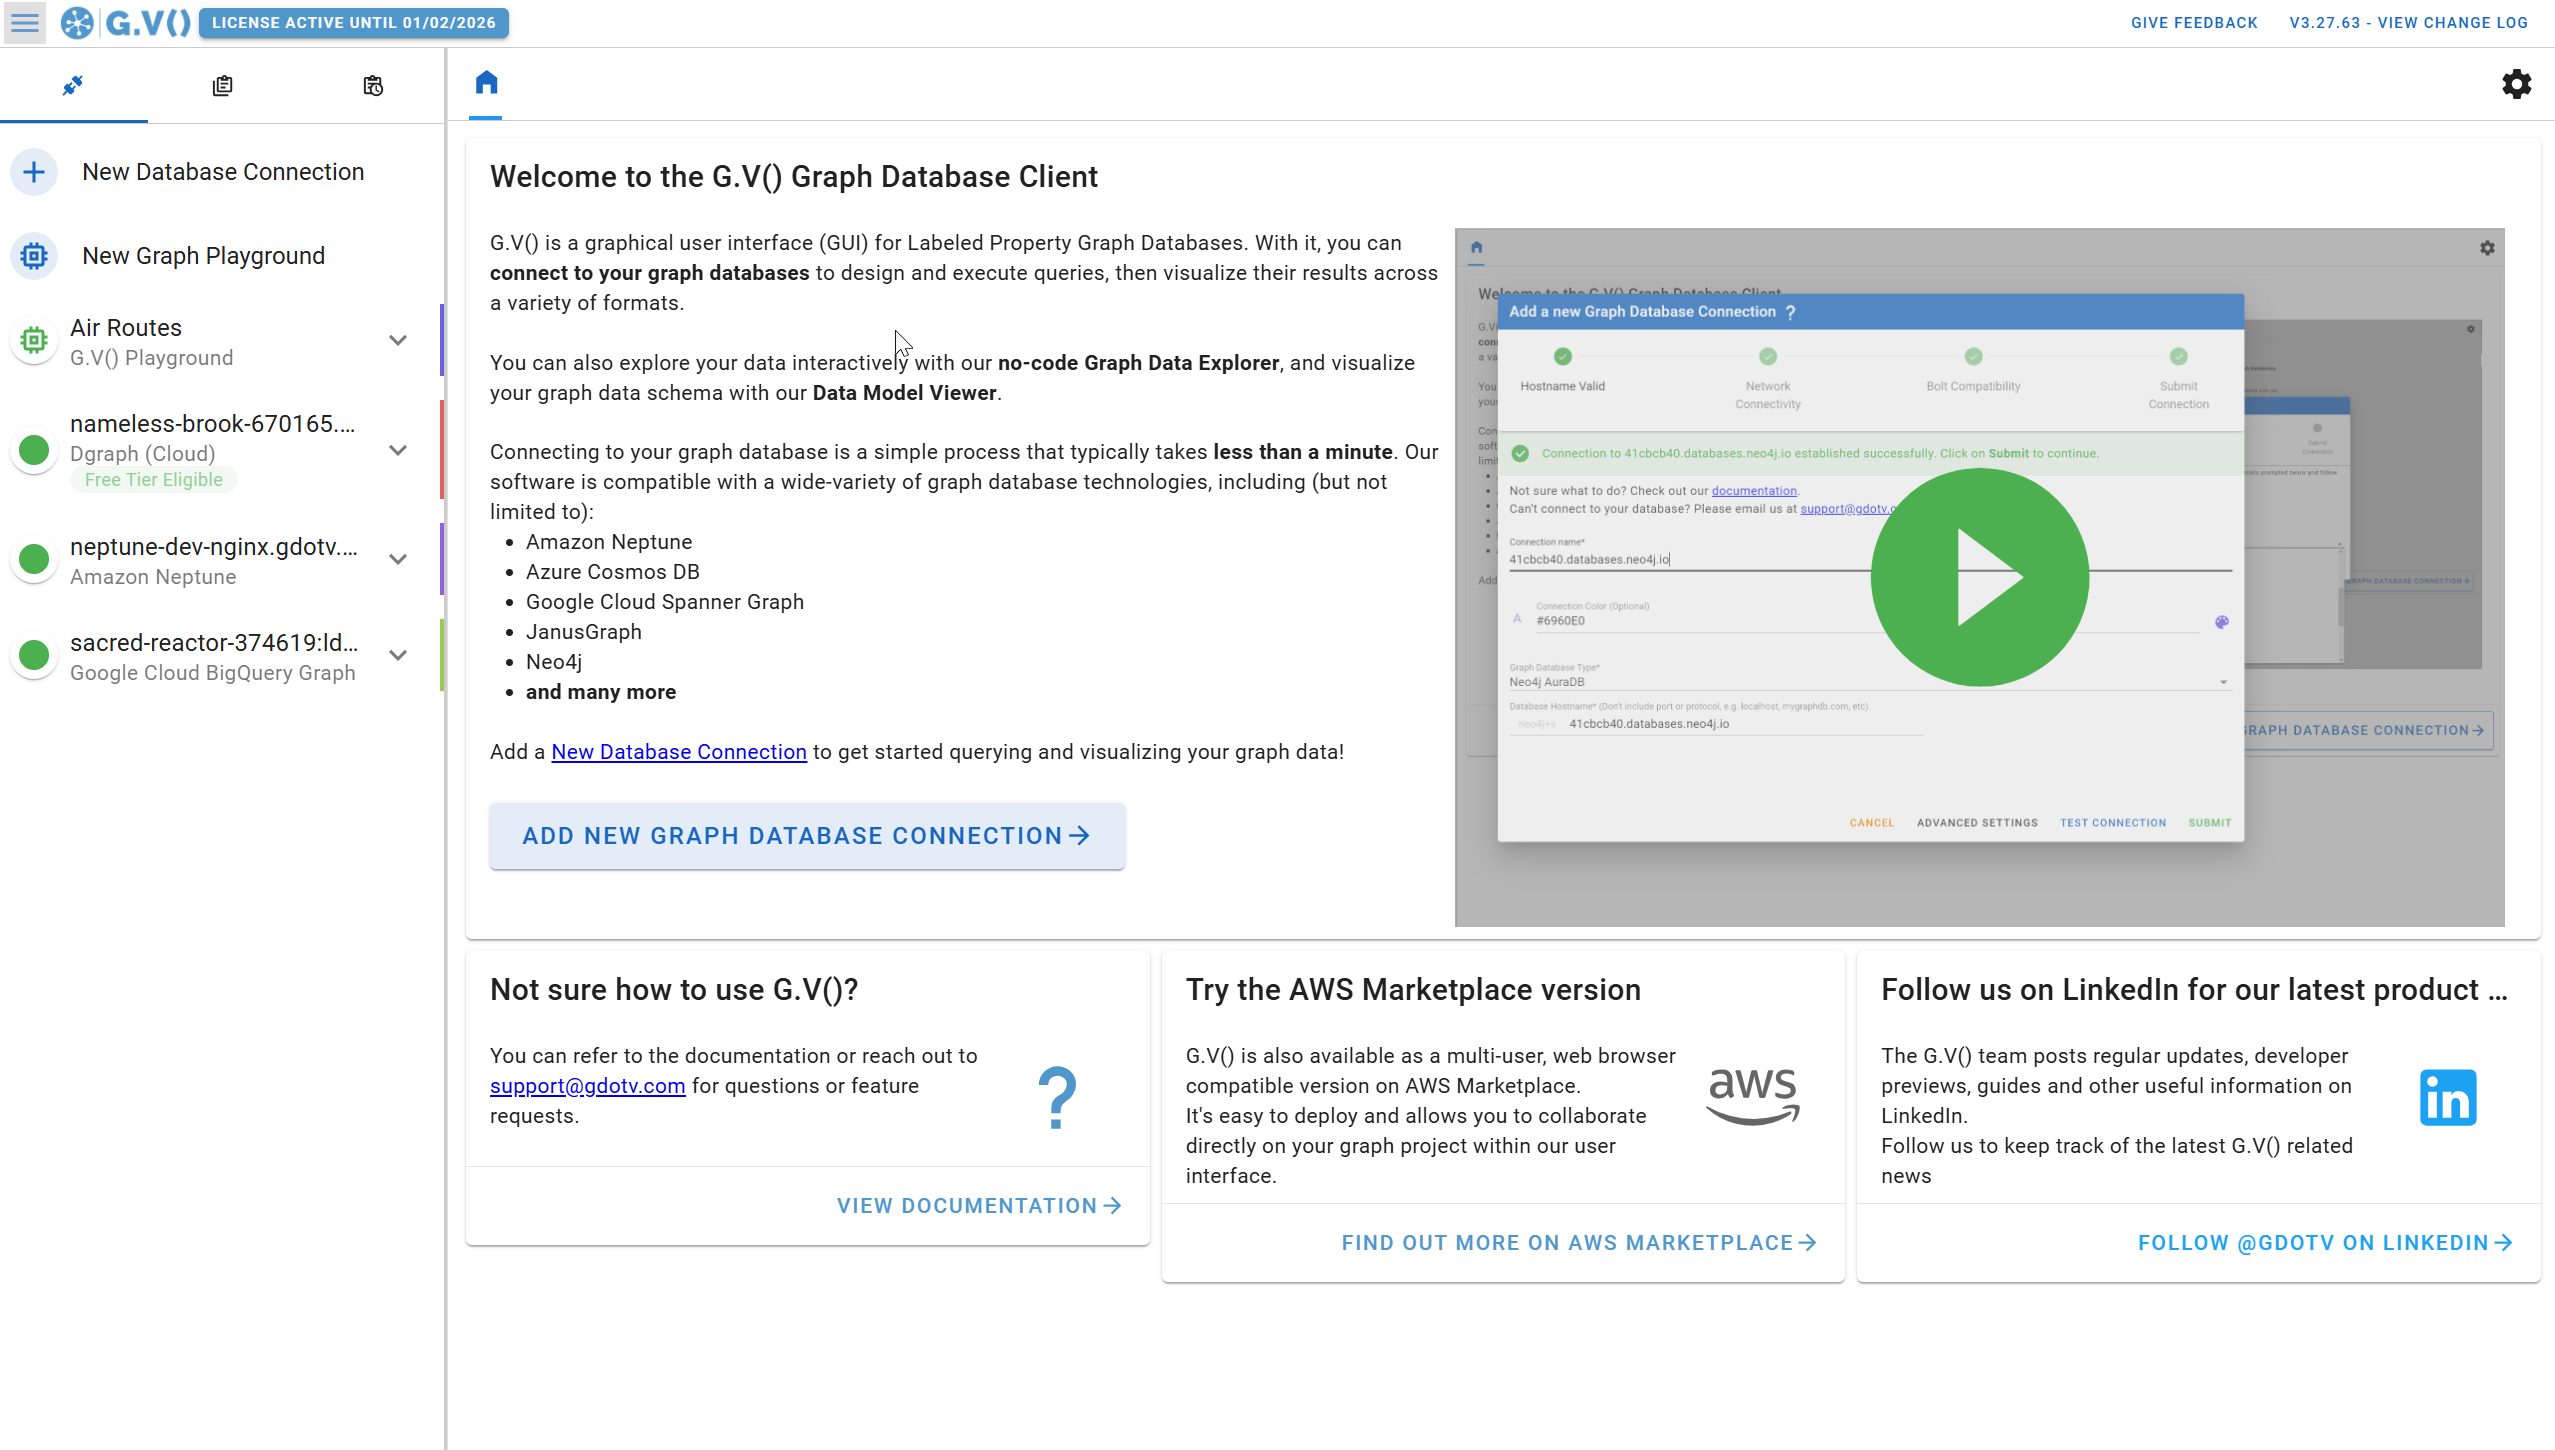
G.V() can connect to multiple graph databases all in the same place, and is compatible with a wide array of technologies and query languages. With G.V(), gone are the days of jumping between several vendor specific graph database clients.
The G.V() Query Editor
When it comes to the Cypher query editing, Neo4j Browser and G.V() work similarly, but there are a couple of extra features G.V() includes which help it stand out.
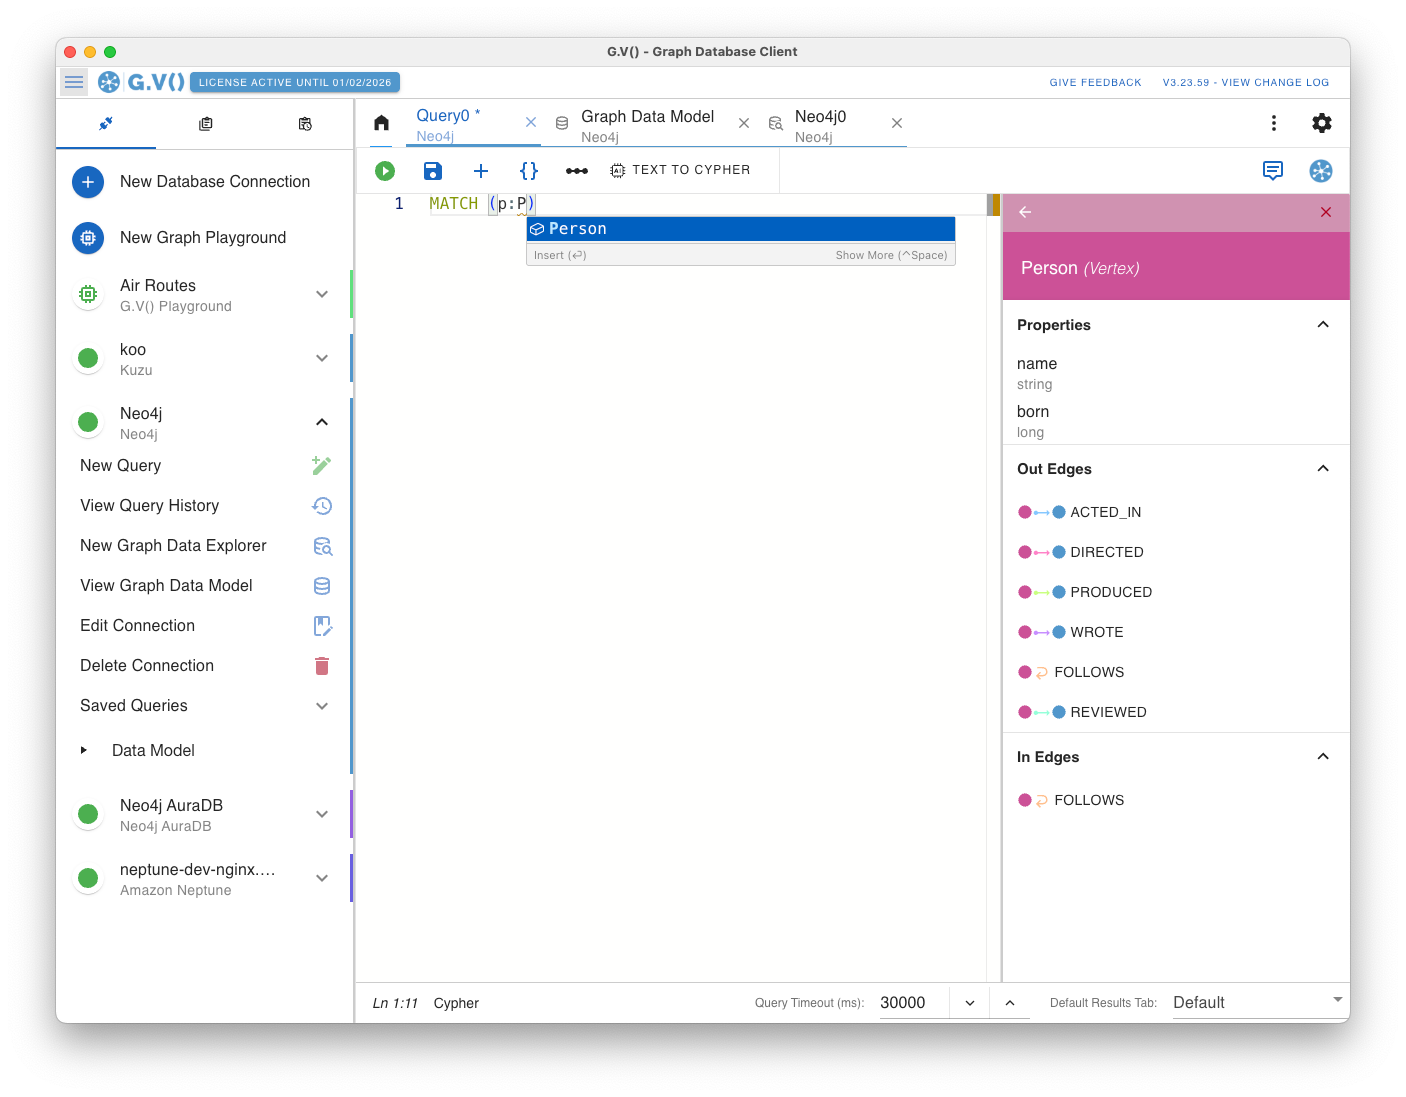
While you are typing a query, G.V() displays real-time graph data schema documentation as you autocomplete labels and property keys.
This is handy for instantly keeping track of things like what relationships are connected to the vertex you are currently querying.
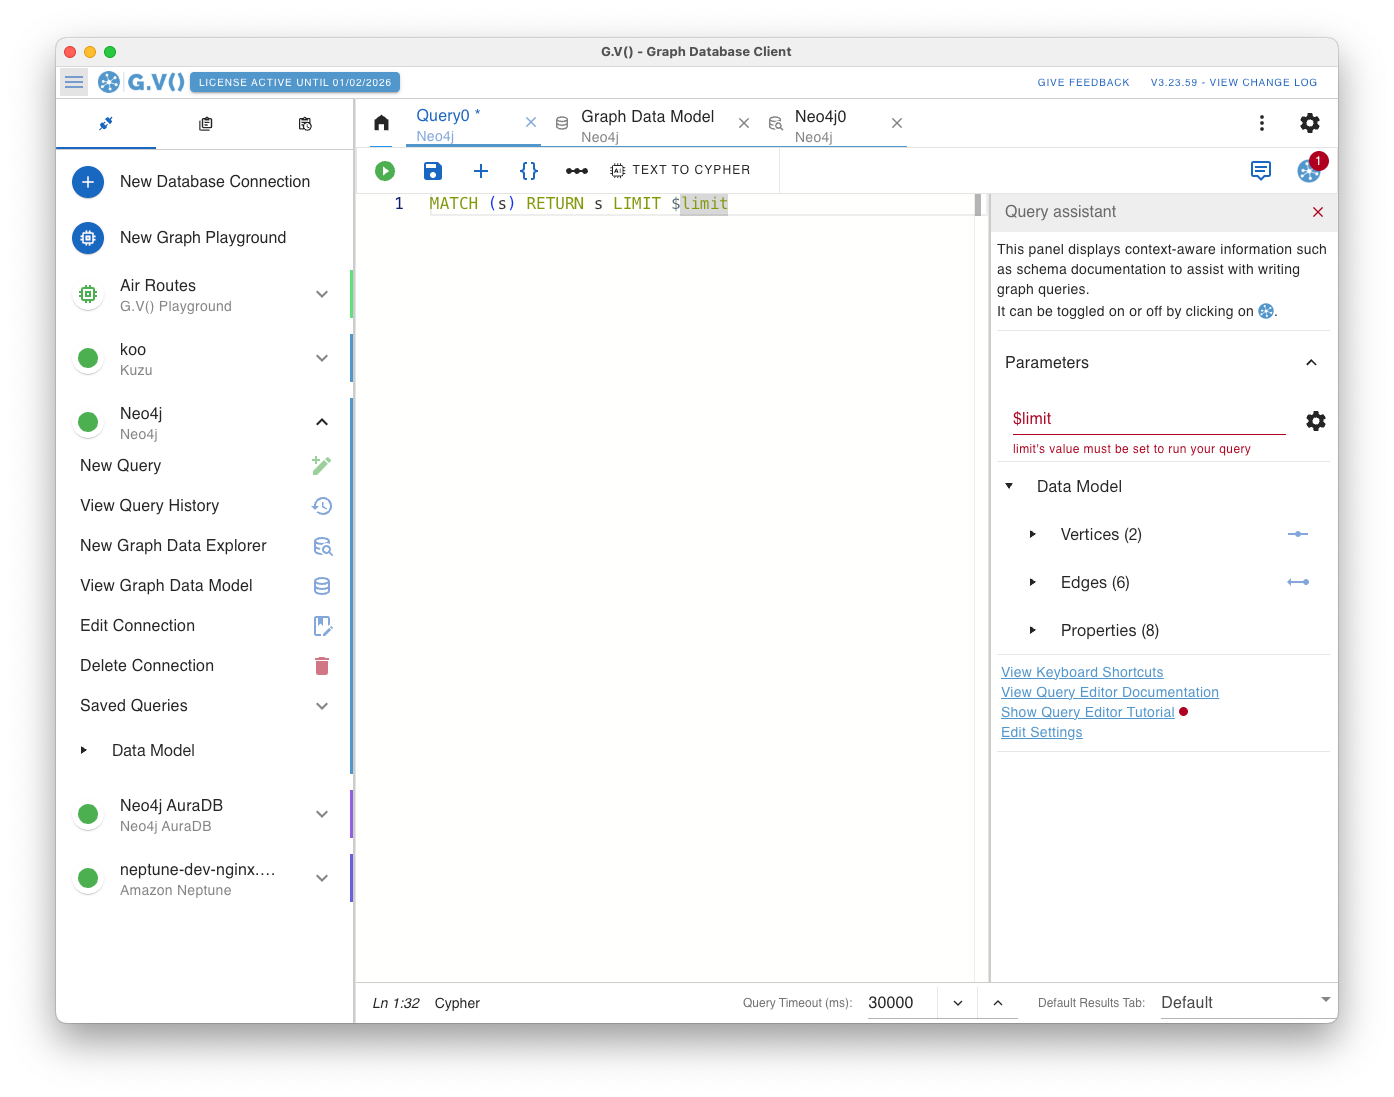
Another benefit of G.V()’s query editor is its much more intuitive handling of query parameters. Neo4j Browser requires declaring them via a code command, then running the query. G.V() on the other hand automatically detects those in the query and prompts the user to enter values.
Both clients allow you to save queries and arrange them into folders which is useful since developers will often need to return to the same queries frequently.
Saved queries in G.V() also handle parameters, allowing you to run queries by just entering parameter values once they’re saved.
They both also keep a history of queries you’ve run, just in case you need to go back to one you might not have saved.
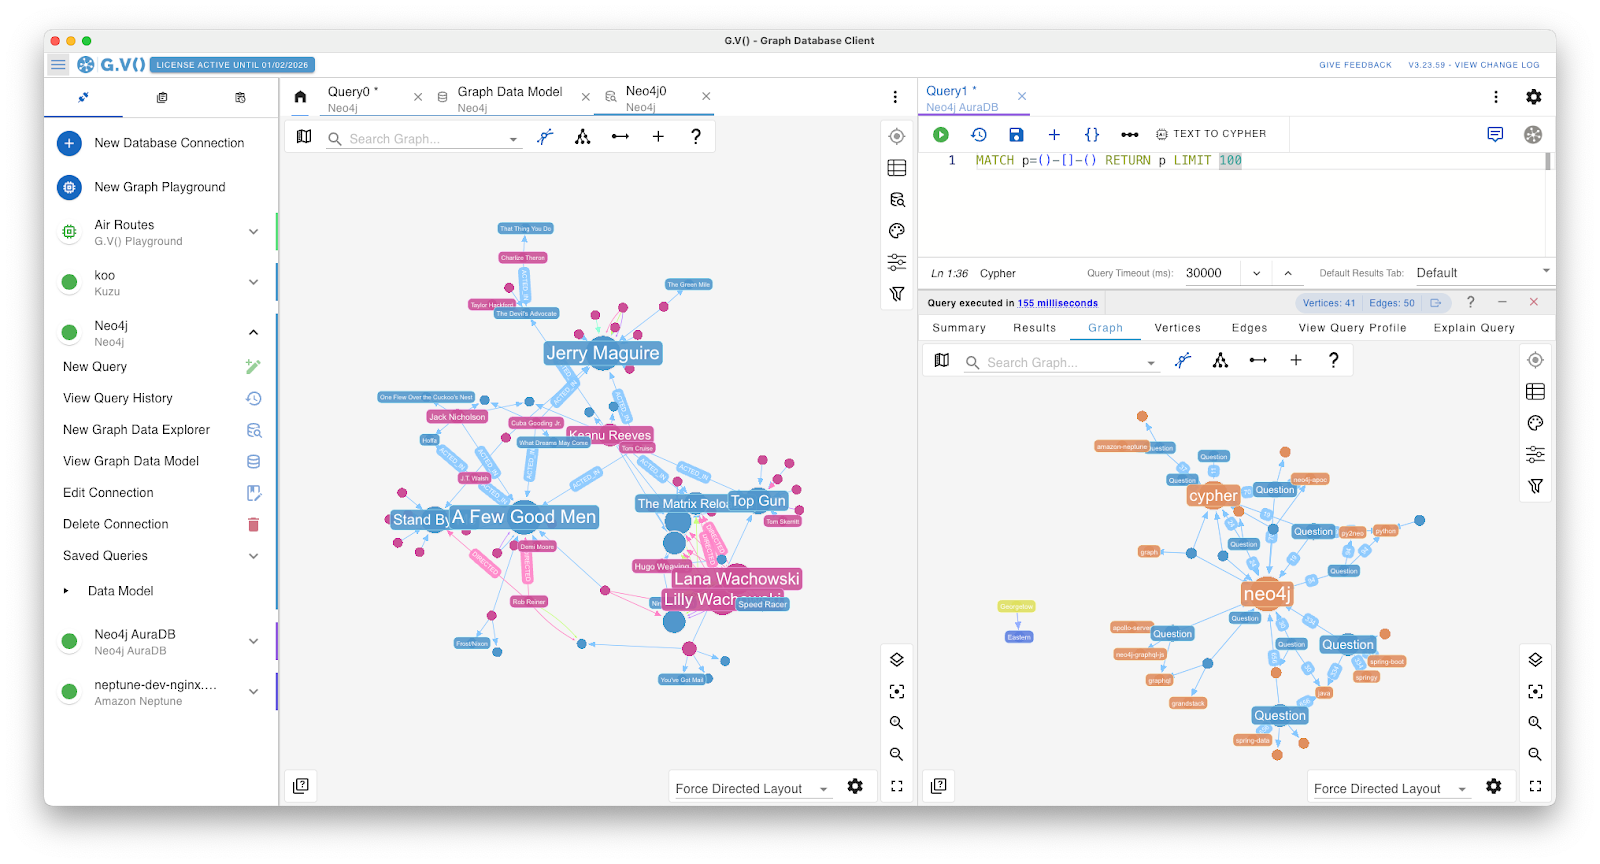
G.V() Graph Visualization & Data Outputs
The graph view where the difference between G.V() and Neo4j Browser becomes very noticeable.
G.V() offers a range of different graph display layouts, each with their own custom options for settings like scale and spacing. You also get much deeper display customization for the graph and its elements, such as the position of labels and background colors.
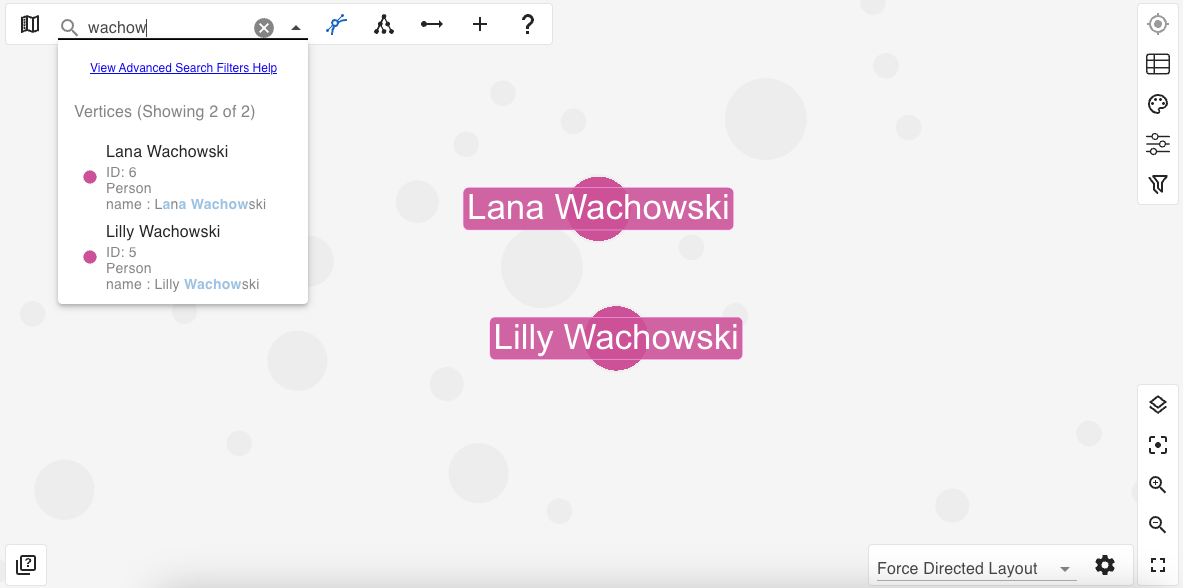
Another feature of G.V() is the ability to fuzzy search all elements and their properties on the graph. Elements matching the search criteria are highlighted on the graph, and you can click on an element from the dropdown results to select it and view its details.
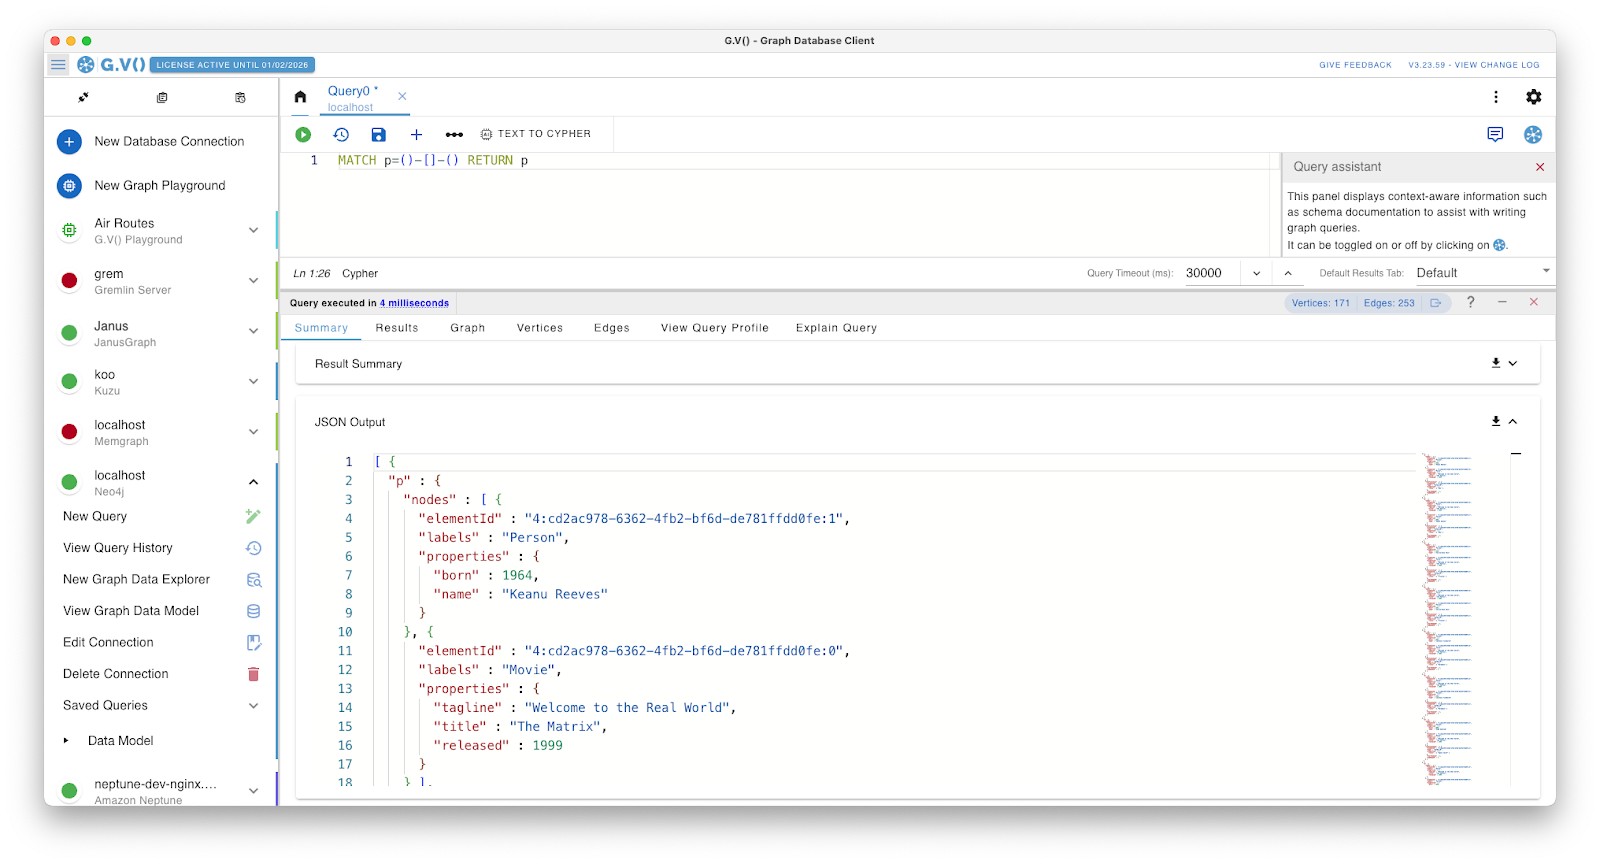
You can view your data in other output formats as well. Just as in Neo4j Browser, you have access to the RAW JSON output along with a result summary.
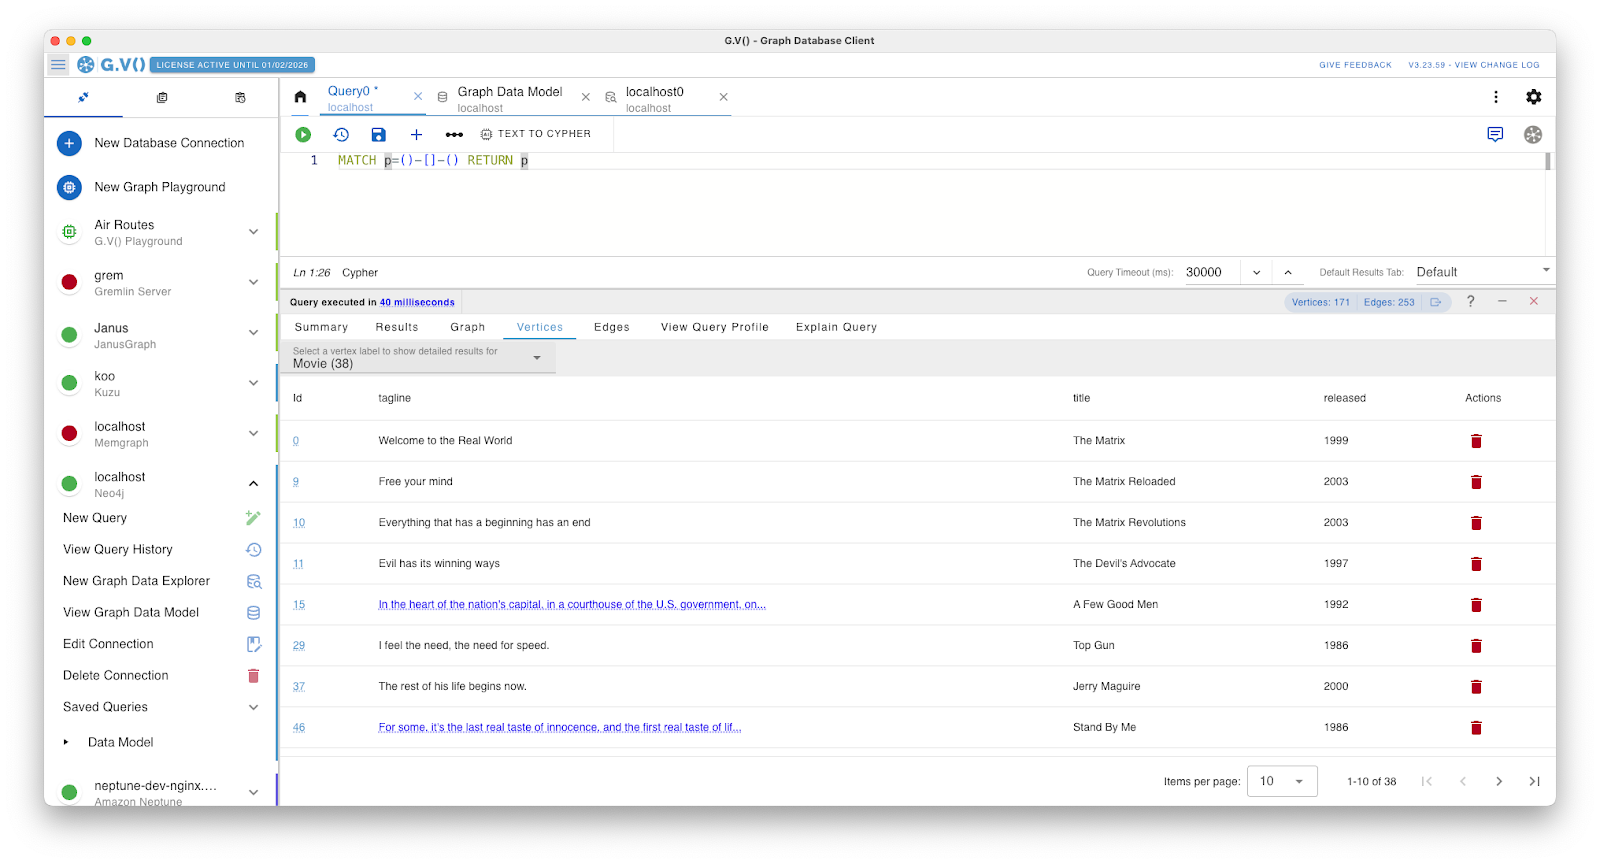
Similarly, G.V() also has a table view which you can access from the graph sidebar, or in their own dedicated windows which separate the vertices from the edges as shown below.
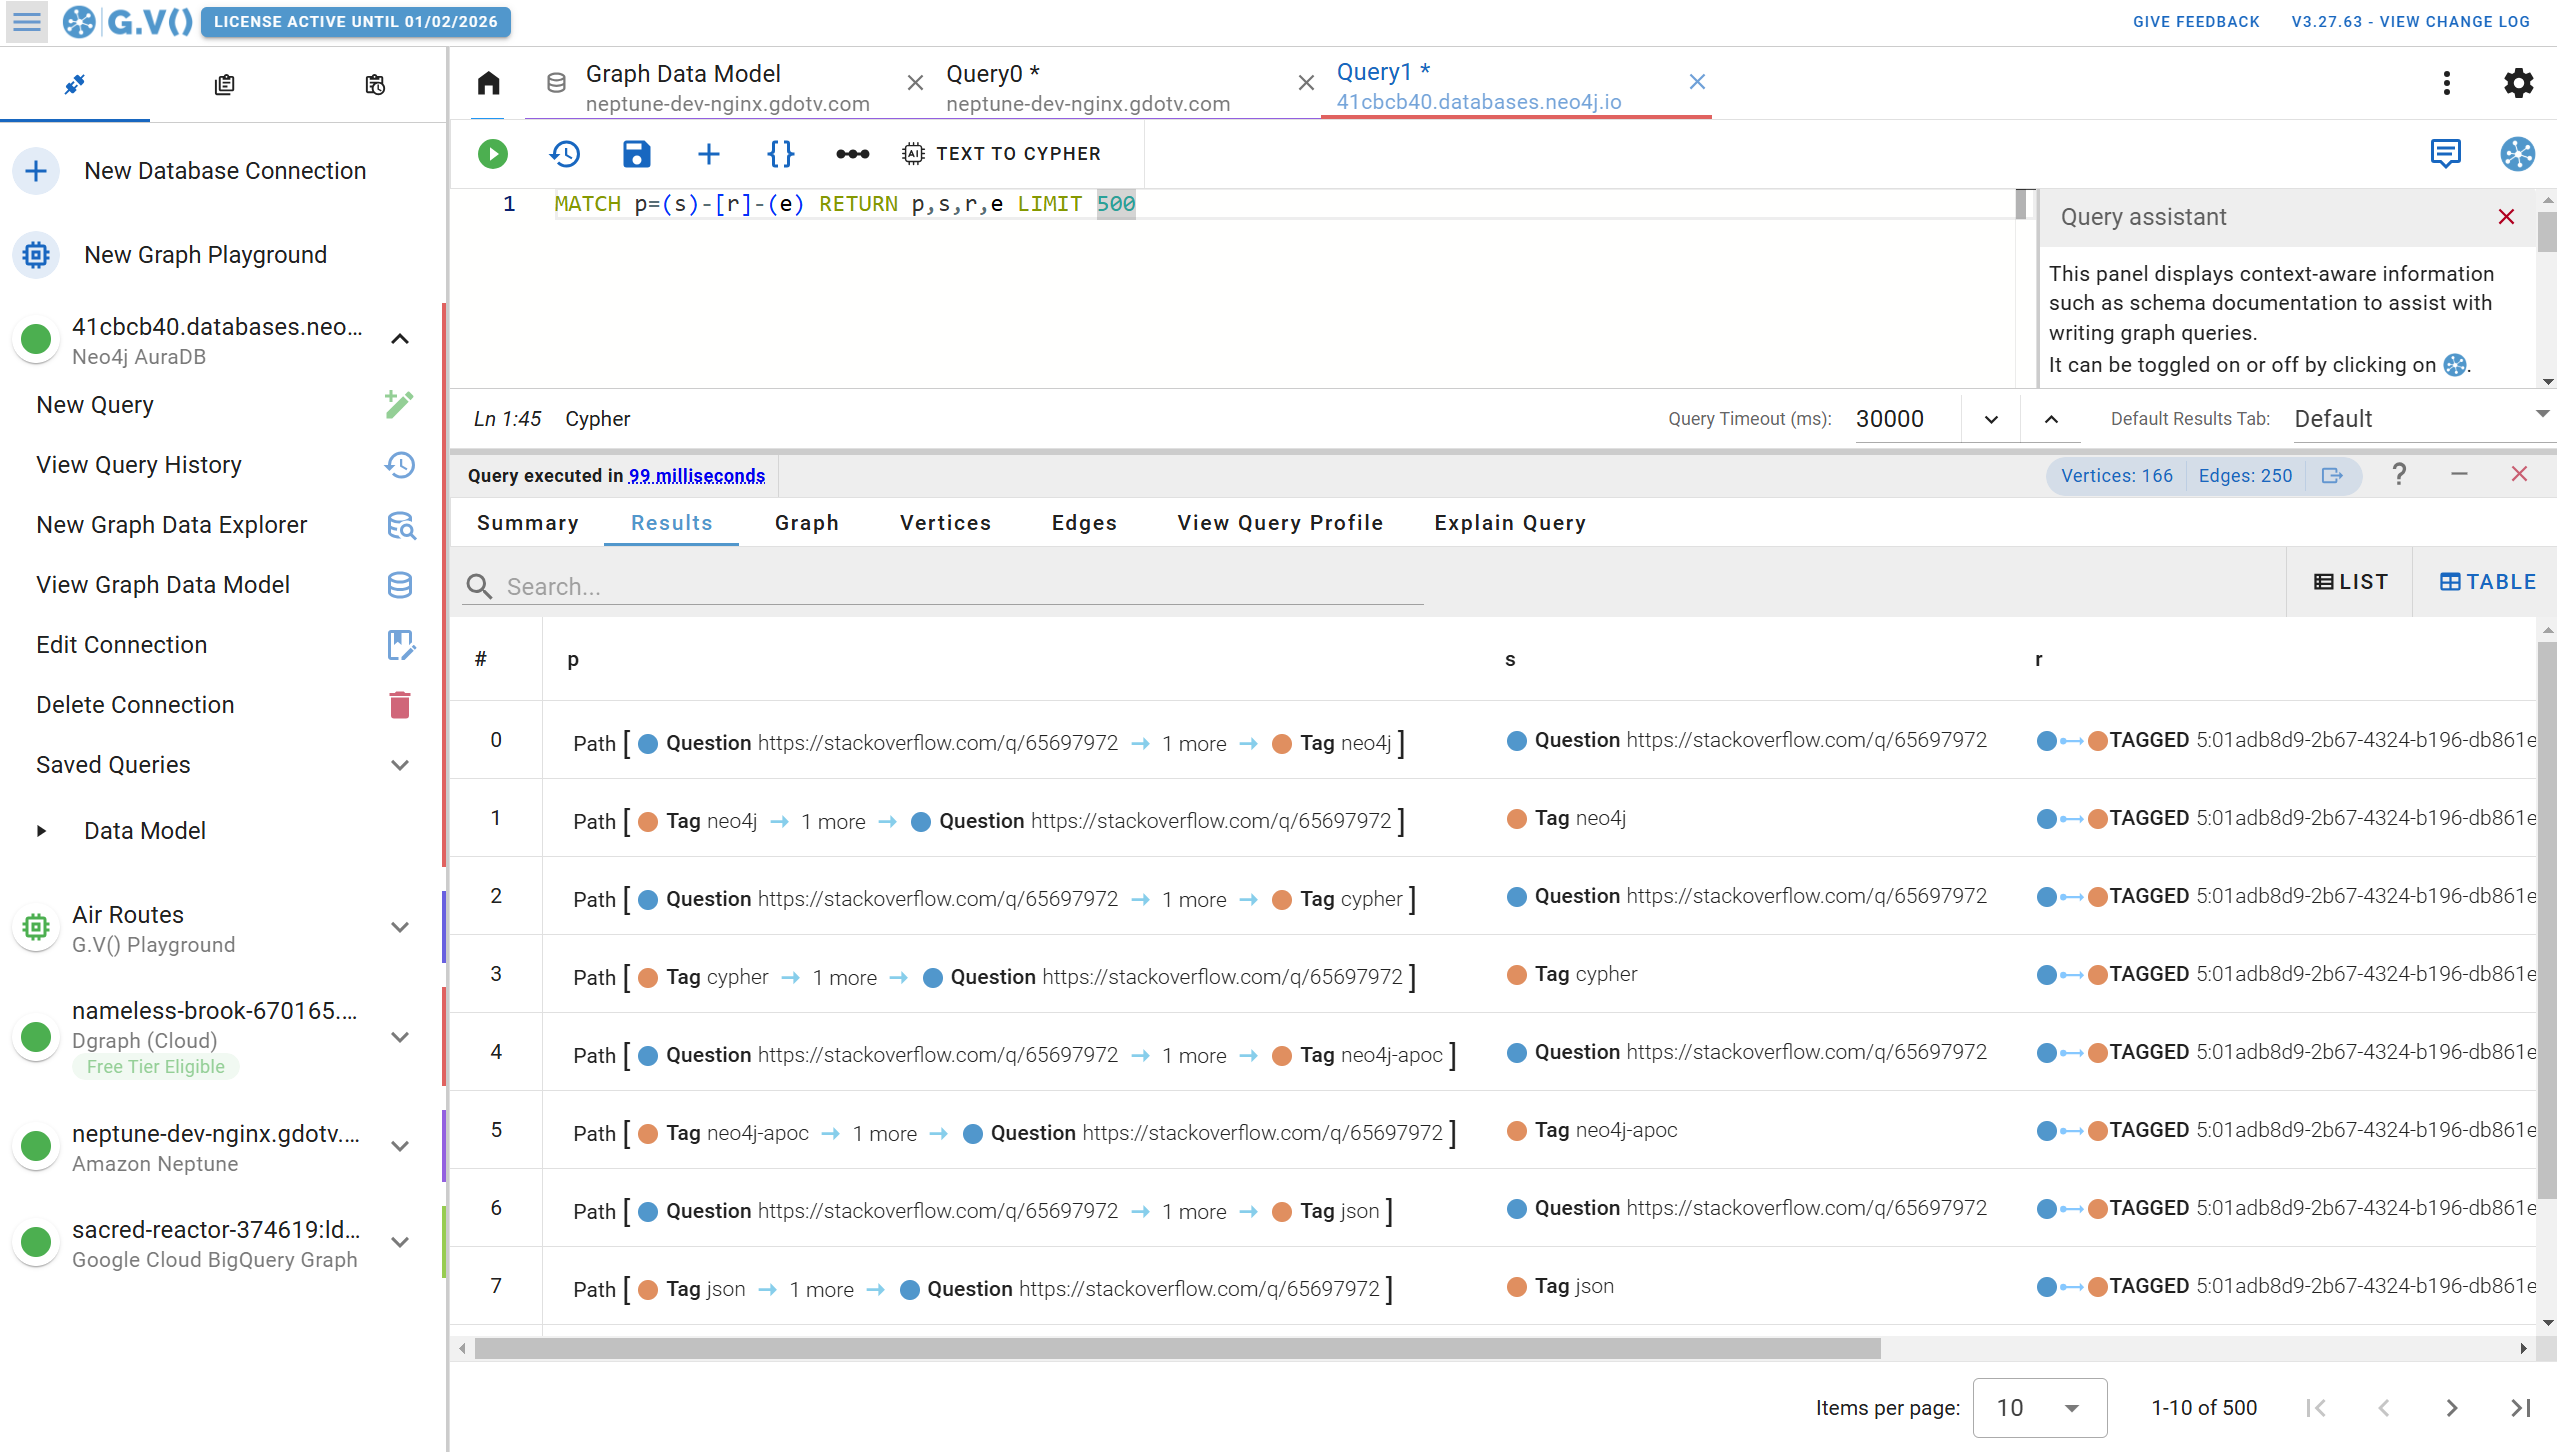
You can also view your entire query results in tabular format, and filter them accordingly:
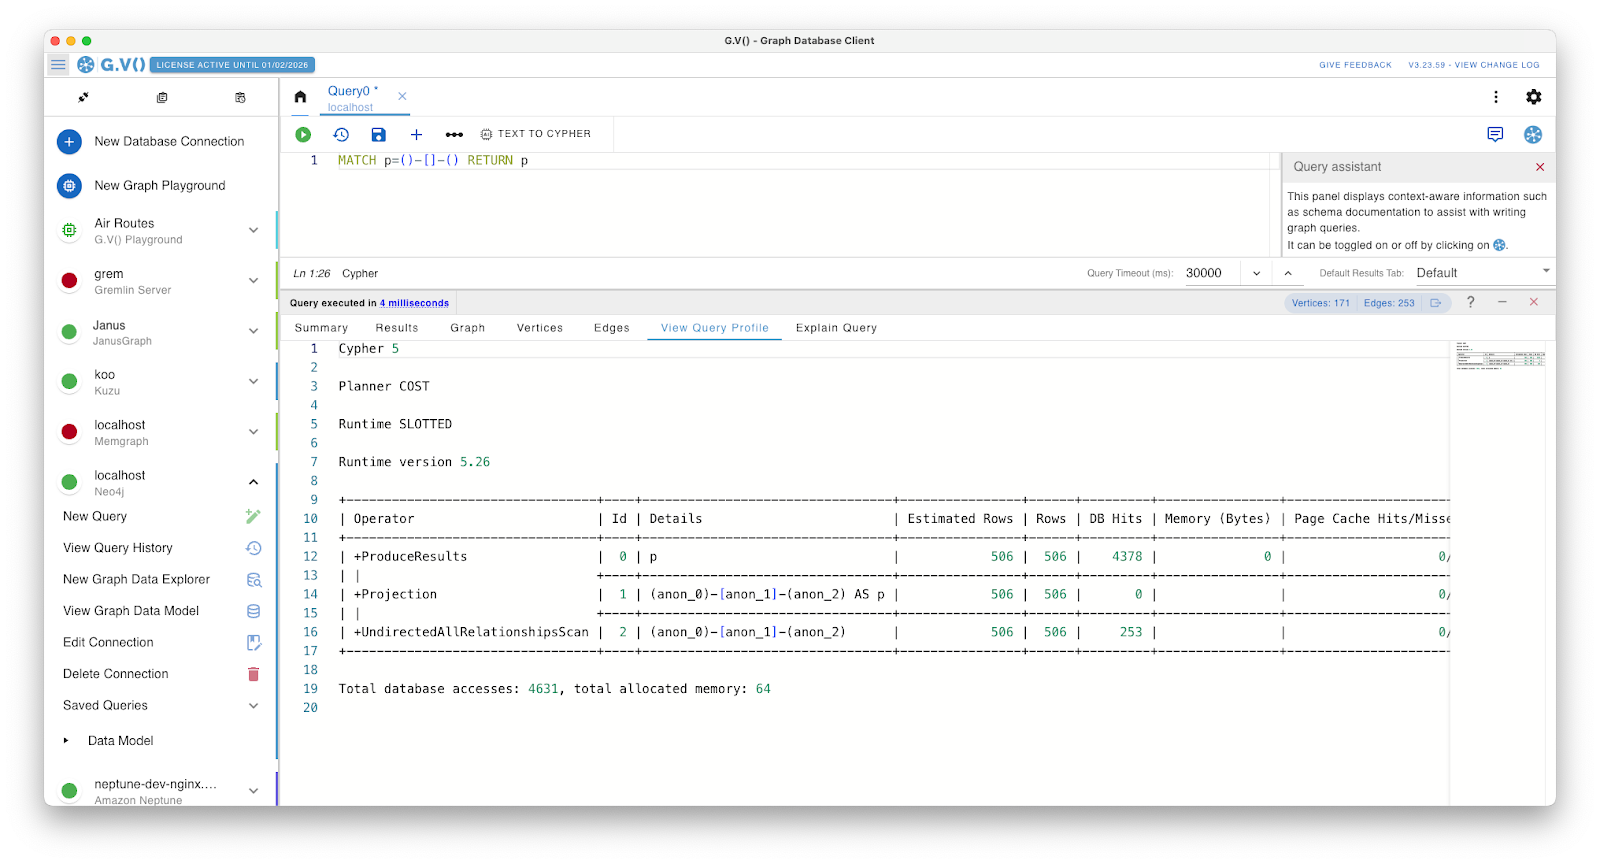
You can also view the Cypher query plan of your query, as well as its explanation, in a consise, easy to read format:
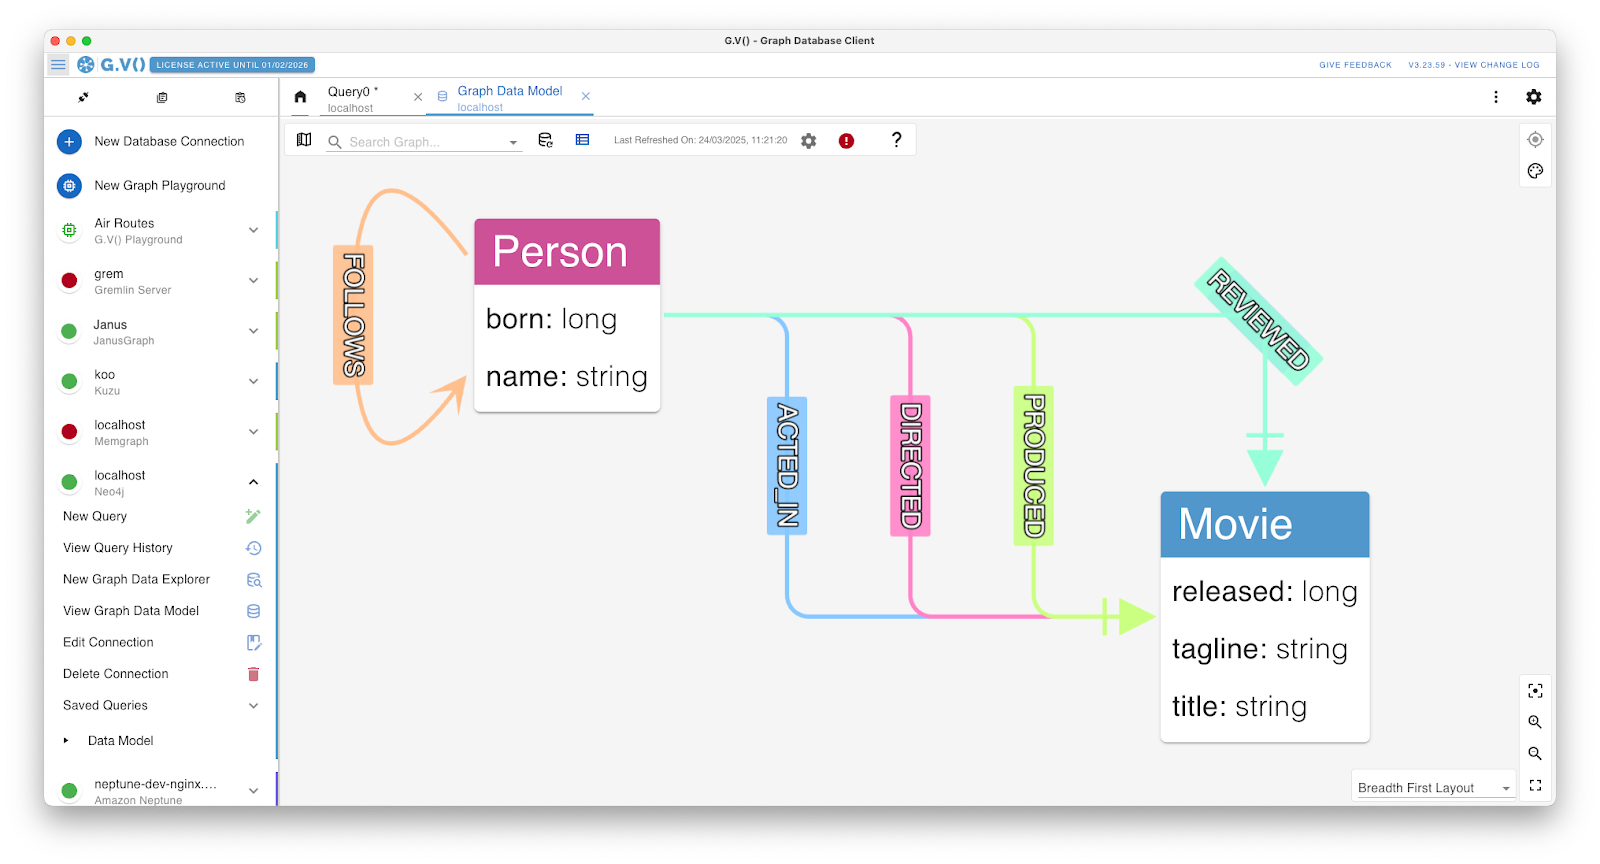
View Your Graph Data Model in G.V()
Some databases – like Neo4j Browser – have a loose schema structure allowing users to create new data structures without defining them in a schema. This can make it difficult to keep track of your data.
In G.V(), you can see how your graph data model is put together visually so you can easily tell what’s in your database. The example below shows this.
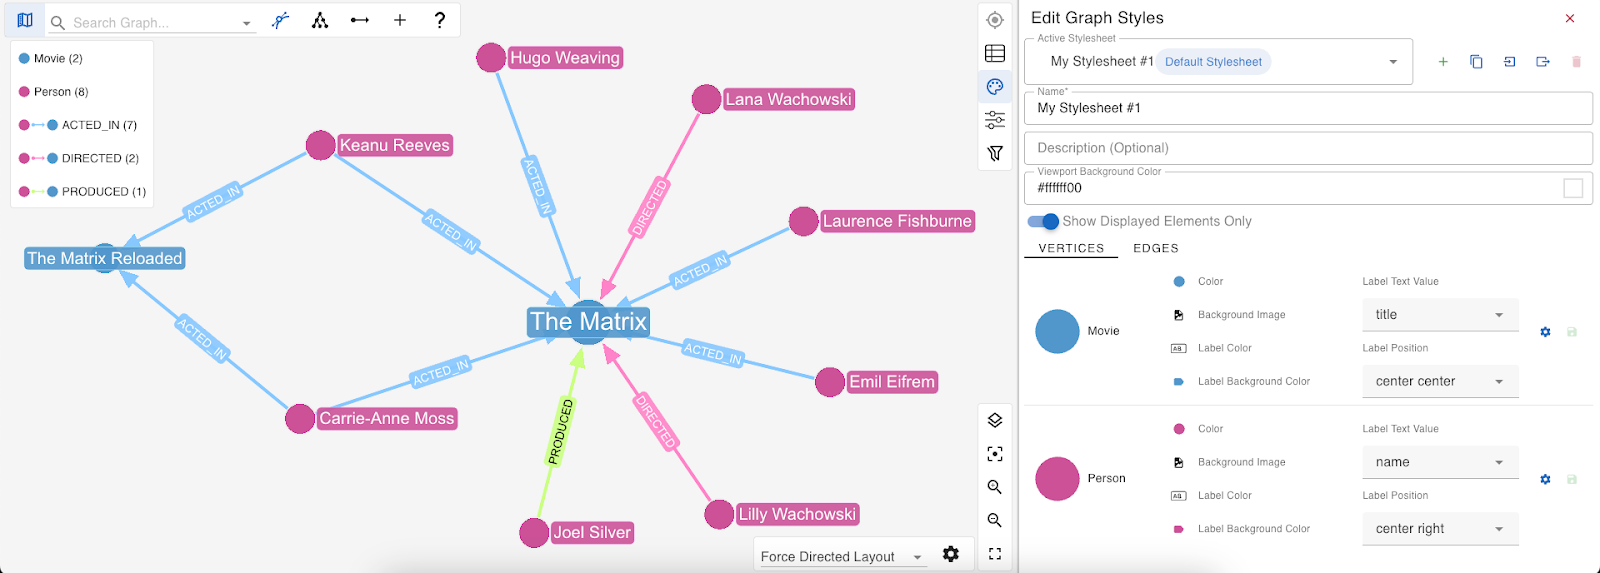
Customize the Appearance & Style of Your Graph Data Visualizations
Just like in Neo4j Browser, you can customize your graph data’s appearance directly in the graph window.
Here though, you will notice a wider range of options, as well as the ability to save different stylesheets which can be seamlessly switched between to apply and compare various visualizations.
Edit Your Graph Data Interactively
Another great feature of G.V()’s graph view is the ability to manually modify your data directly within the graph itself.
In the example below, we have created a new edge between two existing vertices. This is achieved by enabling edge drawing in the toolbar, then simply clicking and dragging from one vertex to another. The edge is then created and saved in your database. You can even give the edge a new label which will update on your graph data model.
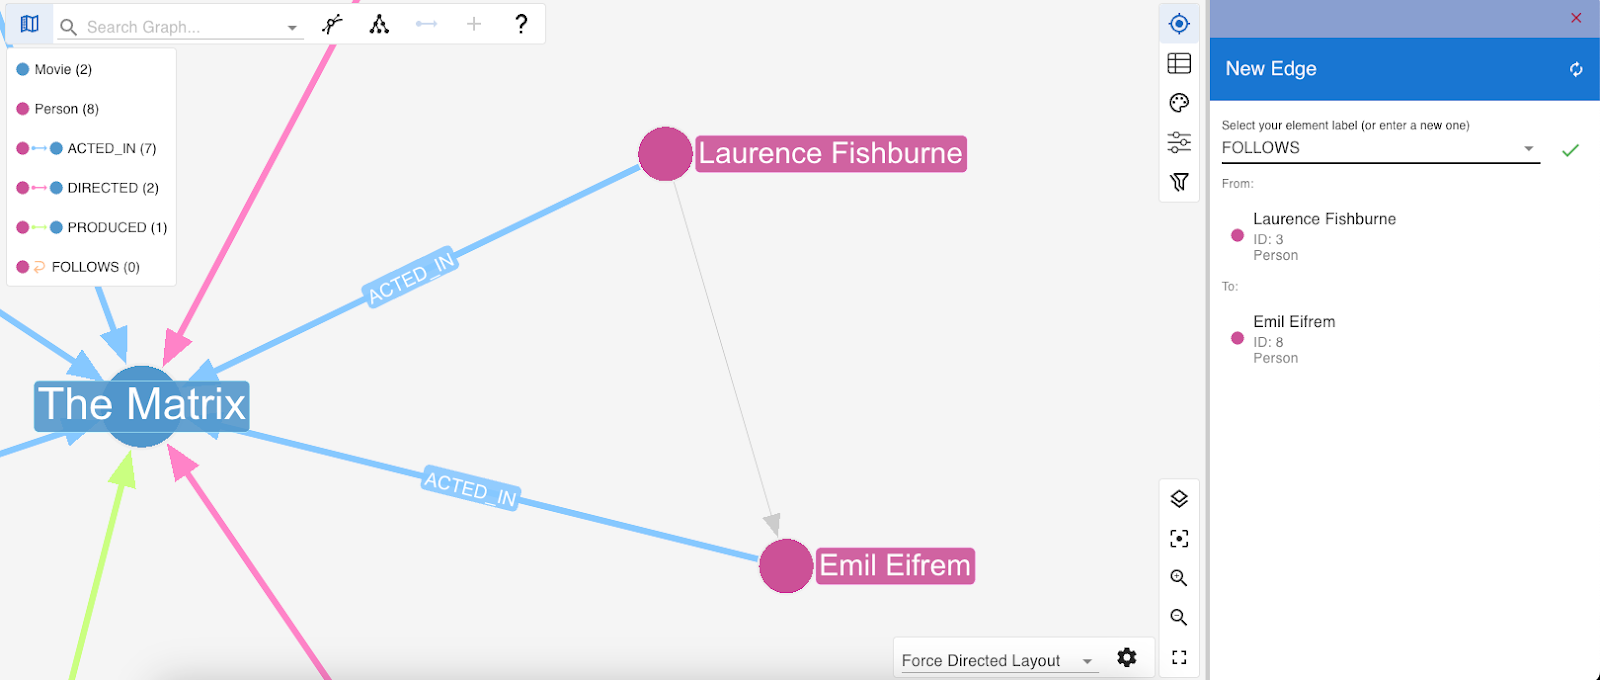
To do something similar on Neo4j would involve writing a query, in some cases multiple, which just adds time and the potential for errors.
Alsooooo: did Emil Eifrem REALLY act in The Matrix? I feel like this was sneakily added to the Neo4j Movies sample dataset as an easter egg…we might need a fact-check on this one!
No-code Graph Exploration
One more feature we’ll look at today is the use of quick filters to search the elements of your graph without the need to write a Cypher query.
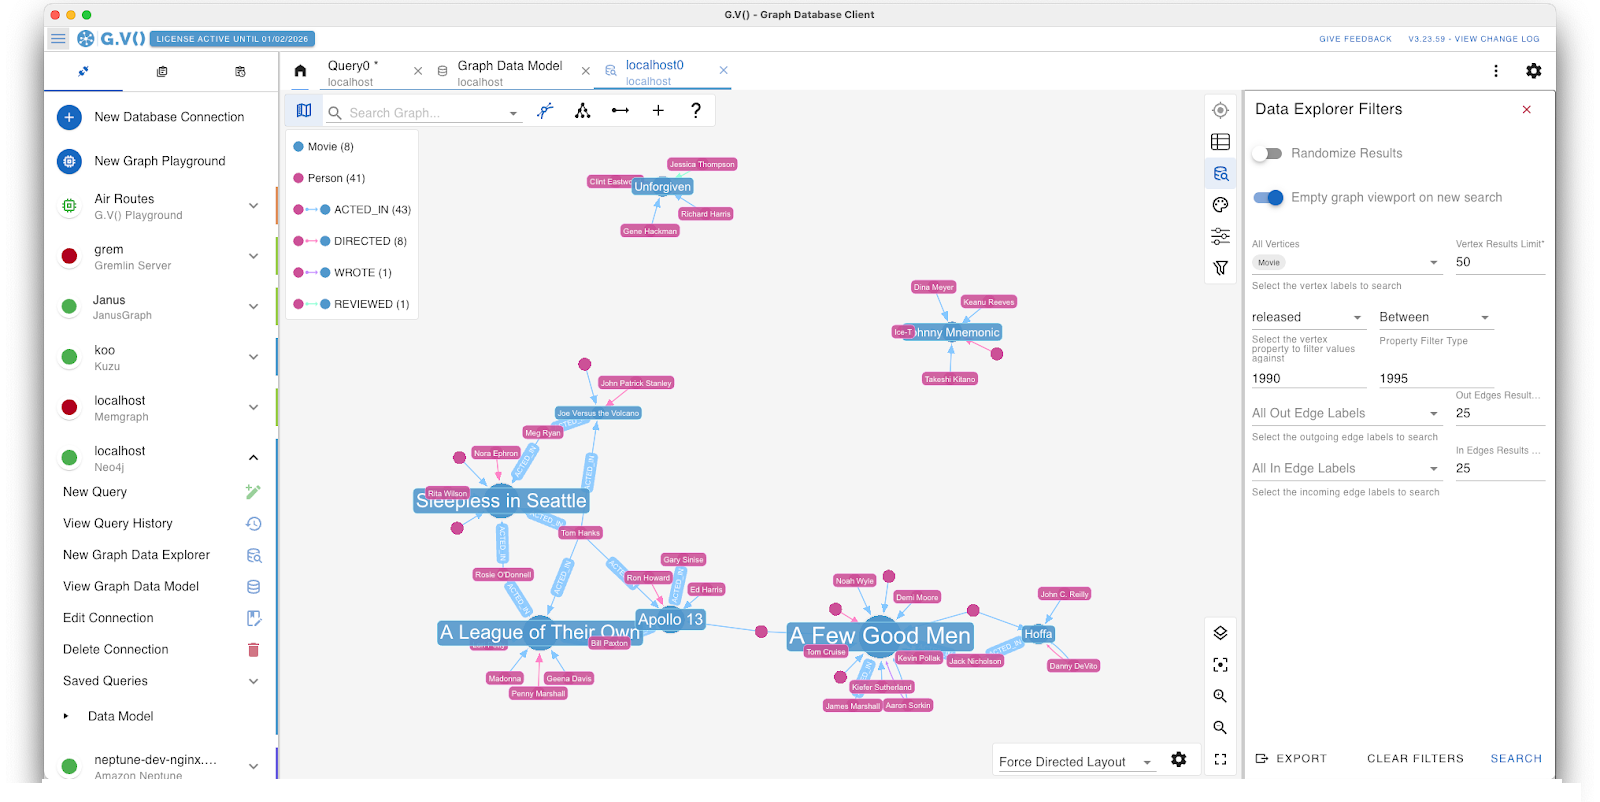
G.V()’s Graph Data Explorer can help you filter your search based on a number of parameters. Here we are returning the nodes of movies released between 1990 and 1995, and their connected edges and nodes (we can also refine it to show just the movie nodes).
On top of all that, G.V()’s graph views all have interactive exploration features. You can right-click on a vertex and load all of its edges, or load a specific edge. For instance, with the ‘Person’ nodes in this graph, we can bring up all the ‘Movie’ nodes that person has acted in by choosing to load all ‘ACTED_IN’ edges.
High Performance Graph Visualization
You will likely run into problems if you are using Neo4j Browser to query a large dataset, as its graph display can only handle a maximum of 1000 nodes.
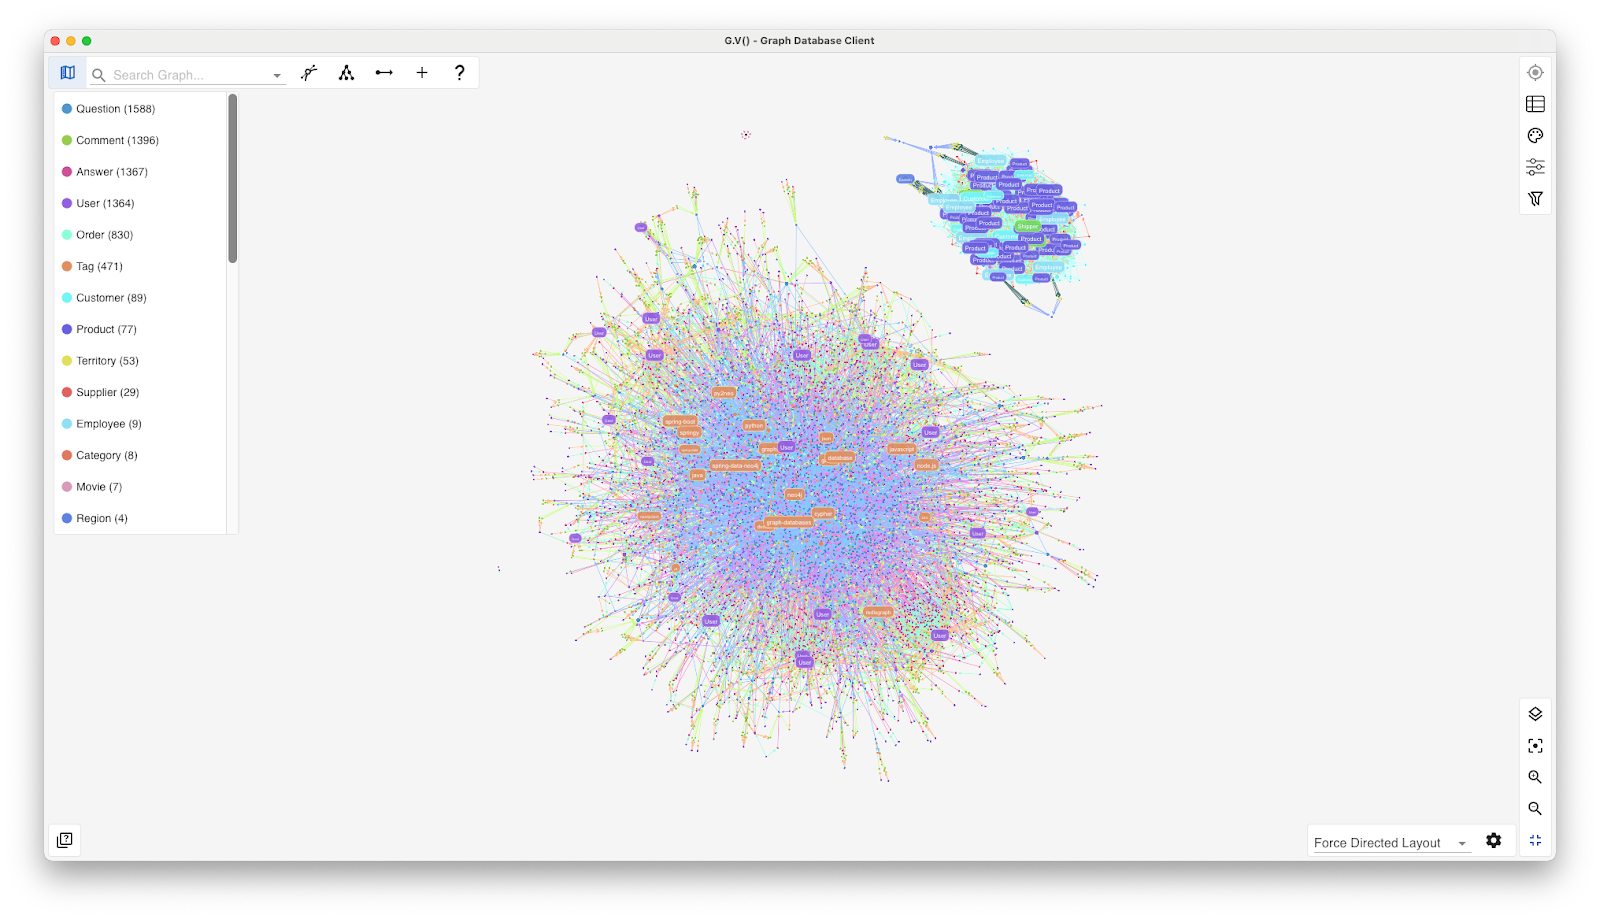
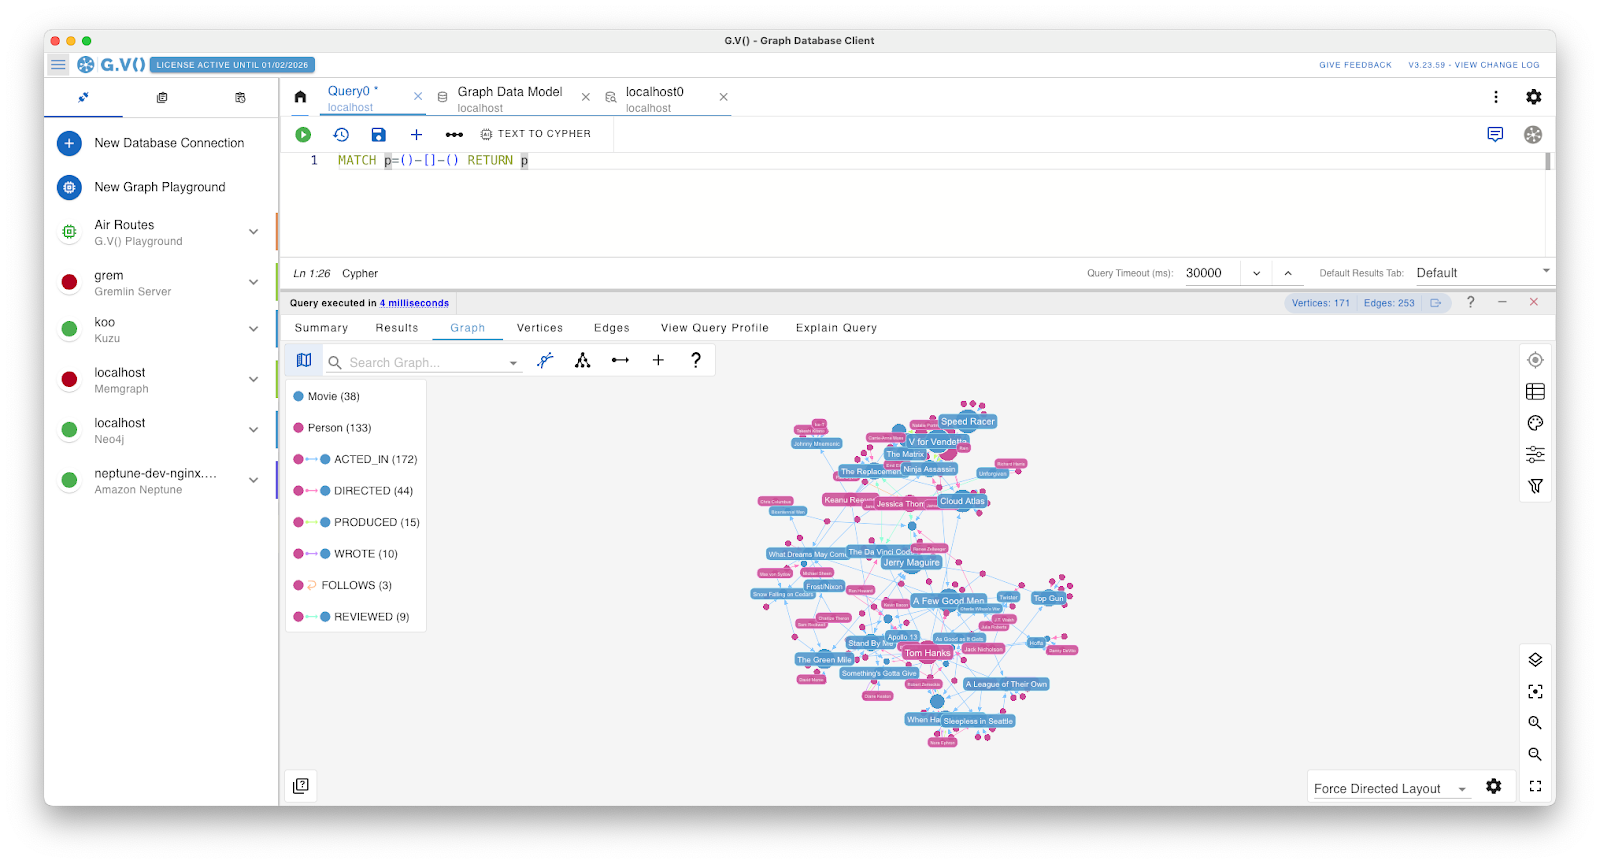
G.V() on the other hand can easily and neatly display graphs of entire datasets multiple times that size, as demonstrated below.
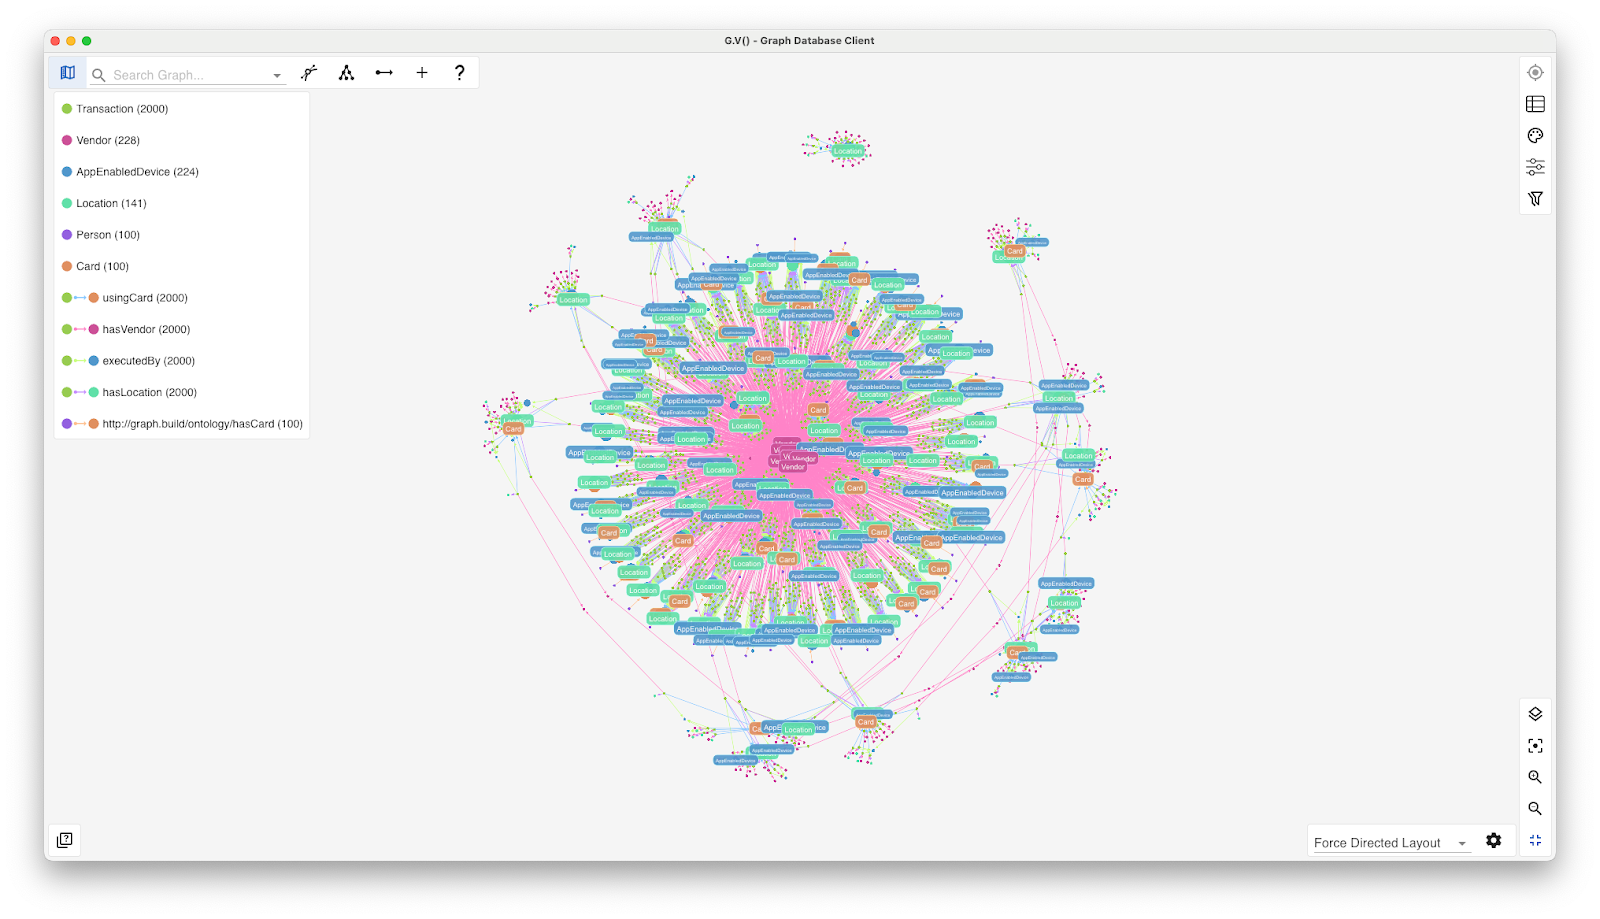
This is thanks to our WebGL powered rendering engine which makes much more efficient use of your device’s computing power to create beautiful graph visualizations.


