gdotv now supports Ultipa Graph Database

What’s that? gdotv is compatible with graph database? Yes indeed!
Introduction
We’re excited to welcome yet another new graph database system to the gdotv suite! As of our latest release, we are now fully compatible with Ultipa Graph,
If you aren’t aware of Ultipa already, they provide a number of tools for graph database management systems. The newest version of Ultipa Graph, known as Ultipa Powerhouse, is based upon a hybrid structure across multiple server types, with the goal of maintaining both data locality and computational efficiency. Ultipa offers full support for the Graph Query Language or GQL, the first ISO/IEC standardized language for graph databases.
And now you have the power to visualize all your Ultipa data with gdotv!
Instantly set up your connection
As always, setting up a connection to your database in gdotv takes only a few seconds.
To connect to your Ultipa Graph, all you need is the hostname, login credentials, and to select your graph name. You can see how quick it is:
You’re immediately ready to start visualizing your data!
Graph visualization from GQL queries
We’re really excited to see Ultipa’s GQL integration – something which is fully preserved when you connect Ultipa Graph to gdotv. You can run your GQL queries through our own Query Manager within gdotv, exactly as you would otherwise.
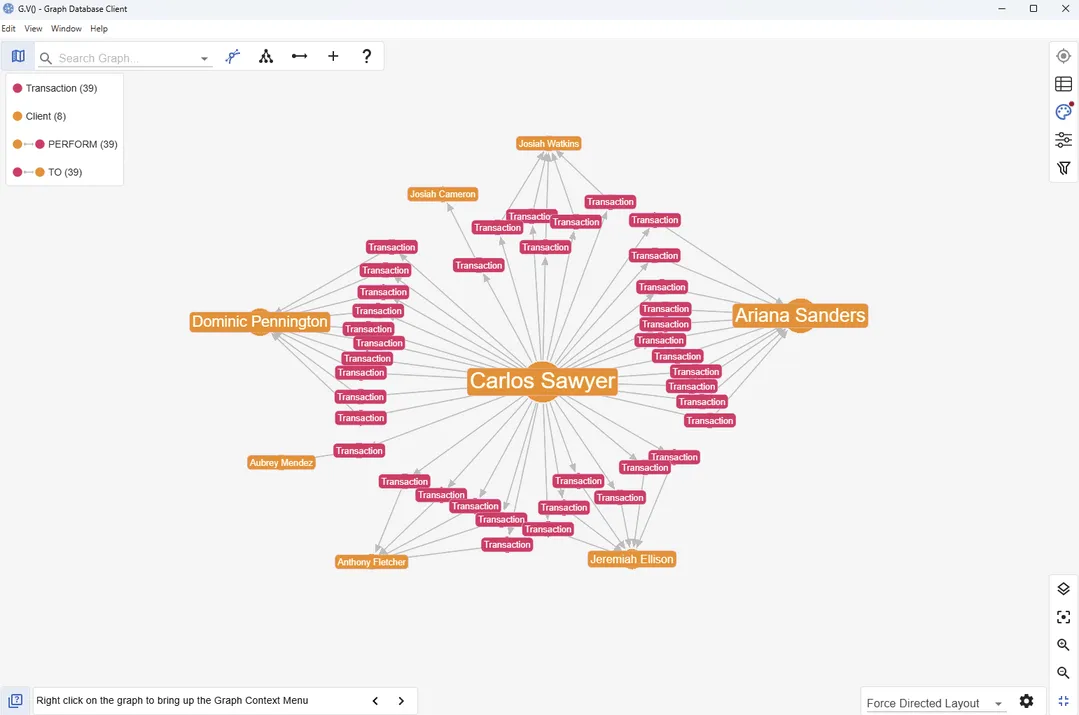
For example, you can try running the following query in gdotv to see all the Transaction nodes between the Client “Carlos Sawyer” and other Client nodes:
MATCH p=(s:Client {NAME: "Carlos Sawyer"})-[]->(e:Transaction)-[]->(c:Client) RETURN p LIMIT 1000
We also include a full range of customization options to make your visualizations as functional, readable, and good-looking as you like!
Data Model Visualization
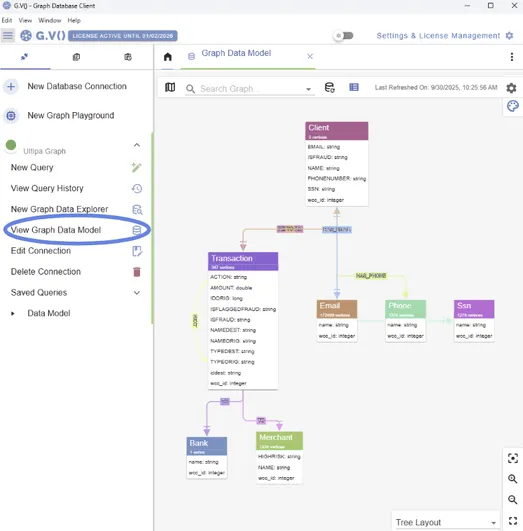
Understanding the schema of your graph data is always important, and it’s something you might want to consult frequently. That’s why gdotv extracts the schema directly from your Ultipa Graph to create the Graph Data Model. This is always just a click away, meaning that you can always have an overhead view of your nodes, relationship and properties right at your fingertips.
No-code data exploration
If you’re just wanting to do a quick exploration of your data and you’d like to take an easier route than writing GQL queries – don’t forget that you can also use gdotv’s new Data Explorer to explore your graph data without writing any code at all!
Just select the nodes and relationships you want from drop down menus. You can even add filters at the same time – no manual querying required!
Conclusion
Well, there you have it! You now know that Ultipa + gdotv is another winning combination, and you’ve seen just how easy it is to import your Ultipa Graph projects into gdotv. Whether you’re most excited for visualization, querying or simple no-code data exploration, gdotv has you covered.
We’re excited to see what all you Ultipa fans make!
About the author

Dr. Amber Lennox
Developer Relations Engineer
Amber manages developer relations at gdotv and (when not deep-diving into documentation) can be found wild swimming in questionable weather and working on personal programming projects like developing software for language learning. With a PhD in Astrophysics, Amber is particularly drawn to the mathematical and scientific aspects of graph theory and analytics.