The Weekly Edge: Microsoft Sentinel Graph, Columnar Graph Databases, Euler & More [3 October 2025]

Welcome back to the Weekly Edge!
This blog series curated by the team at gdotv is your tl;dr of graph tech news, reads, and resources from the past week (or so).
Here’s what’s been happening this past week:
- Microsoft Security launched Sentinel graph into public preview
- The TuringDB team breaks down columnar vs. volcano graph processing
- Dave Bechberger talks about the oft-ignored trade-offs of knowledge graphs
- A classic walkthrough to an alternative proof for Euler’s graph theory formula
Let’s dive in.
[News:] Introducing Microsoft Sentinel Graph
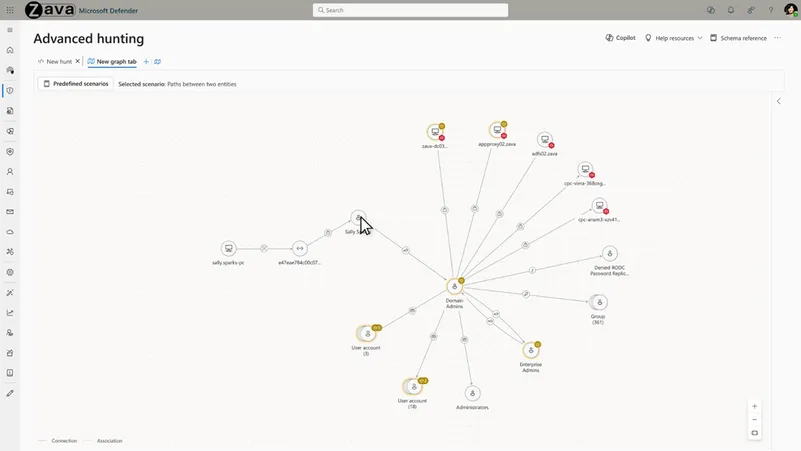
This week saw another big win for graph thinking in the cybersecurity space. As we’ve covered before, hackers already think in terms of attack graphs, so why shouldn’t defenders do the same? Turns out the folks at Microsoft agree.
Last Tuesday, the Microsoft Security team announced the public preview of Microsoft Sentinel graph – an interconnected mapping tool for all your digital assets and infrastructure. As part of the Sentinel platform, Sentinel graph enables your human and agentic AI team to (literally) connect the dots and quickly provide context for your pre- or post-breach cybersecurity analysis. These new graph analytics and interactive graph visualization capabilities are now available for both Microsoft Defender and Microsoft Purview.
[Quick Bite:] Column-Oriented vs. Volcano-Style Graph Query Processing
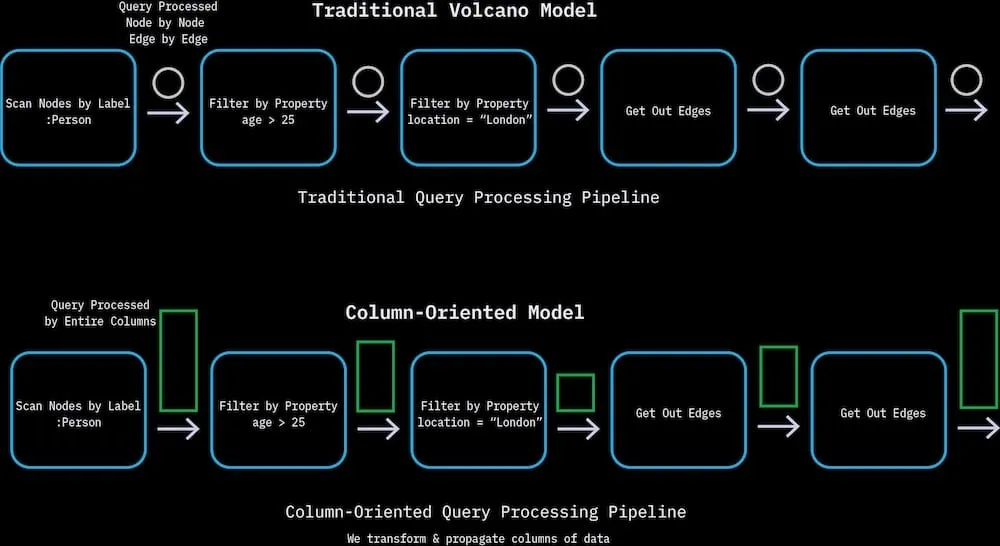
Turns out, not all graph databases are created equal. In this week’s quick bite, Rémy Boutonnet, Founder of TuringDB, explains how a column-oriented graph database increases performance by processing nodes and edges in chunks – rather than processing data node-by-node or edge-by-edge like many graph databases currently do.
If you’re interested in diving further into this topic, check out the TuringDB documentation on column-oriented graph processing or sign up for the TuringDB waitlist to try it out for yourself.
[Long Read:] Knowledge Graphs & GenAI: When the Complexity Is Worth It
With no disrespect to Clarke’s third law (or graph technology itself), knowledge graphs aren’t magic. While they excel at multi-hop reasoning and AI explainability, knowledge graphs also add complexity. And that complexity isn’t always worth the cost, explains Dave Bechberger.
In this week’s long read, Bechberger breaks down the three biggest misconceptions around knowledge graphs and genAI – including GraphRAG, hallucinations, and over-engineering – as well as when the complexity pays off.
[ICYMI / Watch:] Euler’s Characteristic Formula & Graph Duality
This week’s watch is an oldie but a goldie – and nothing in graph technology is older than Euler’s characteristic formula. Back when Prussia was still a thing, mathematician and graph theory OG Leonhard Euler got sick of people asking him about the Seven Bridges of Königsberg problem and drummed up a new proof to show why the problem was unsolvable. As a result, graph theory was born.
Euler’s characteristic formula (V – E + F = 2) relates the number of edges, vertices, and faces of a convex polyhedron, and every graph theory student learns the classic proof for this equation. But this week’s video by 3Blue1Brown takes you on a stunningly beautiful adventure through a new proof for Euler’s characteristic formula. Prepare to be wowed.
P.S. Did you hear the news that gdotv now supports Ultipa graph database?
That’s it for this week’s edition. Got something you want to nominate for inclusion in a future edition of the Weekly Edge? Ping us on X | Bluesky | LinkedIn or email weeklyedge@gdotv.com.
About the author

Bryce Merkl Sasaki
Former Head of Marketing
Bryce Merkl Sasaki is a writer and editor based in Silicon Valley. A digital nomad and total nerd, he’s wandered the worlds of database and graph tech for more than a decade, covering big moments, interviewing interesting minds, and bringing abstract graph concepts back down to earth. Outside of work, he enjoys hikes with his wife in Northern California and writes on his science fiction novel.