Ultipa Graph IDE
& Graph Visualization Tool
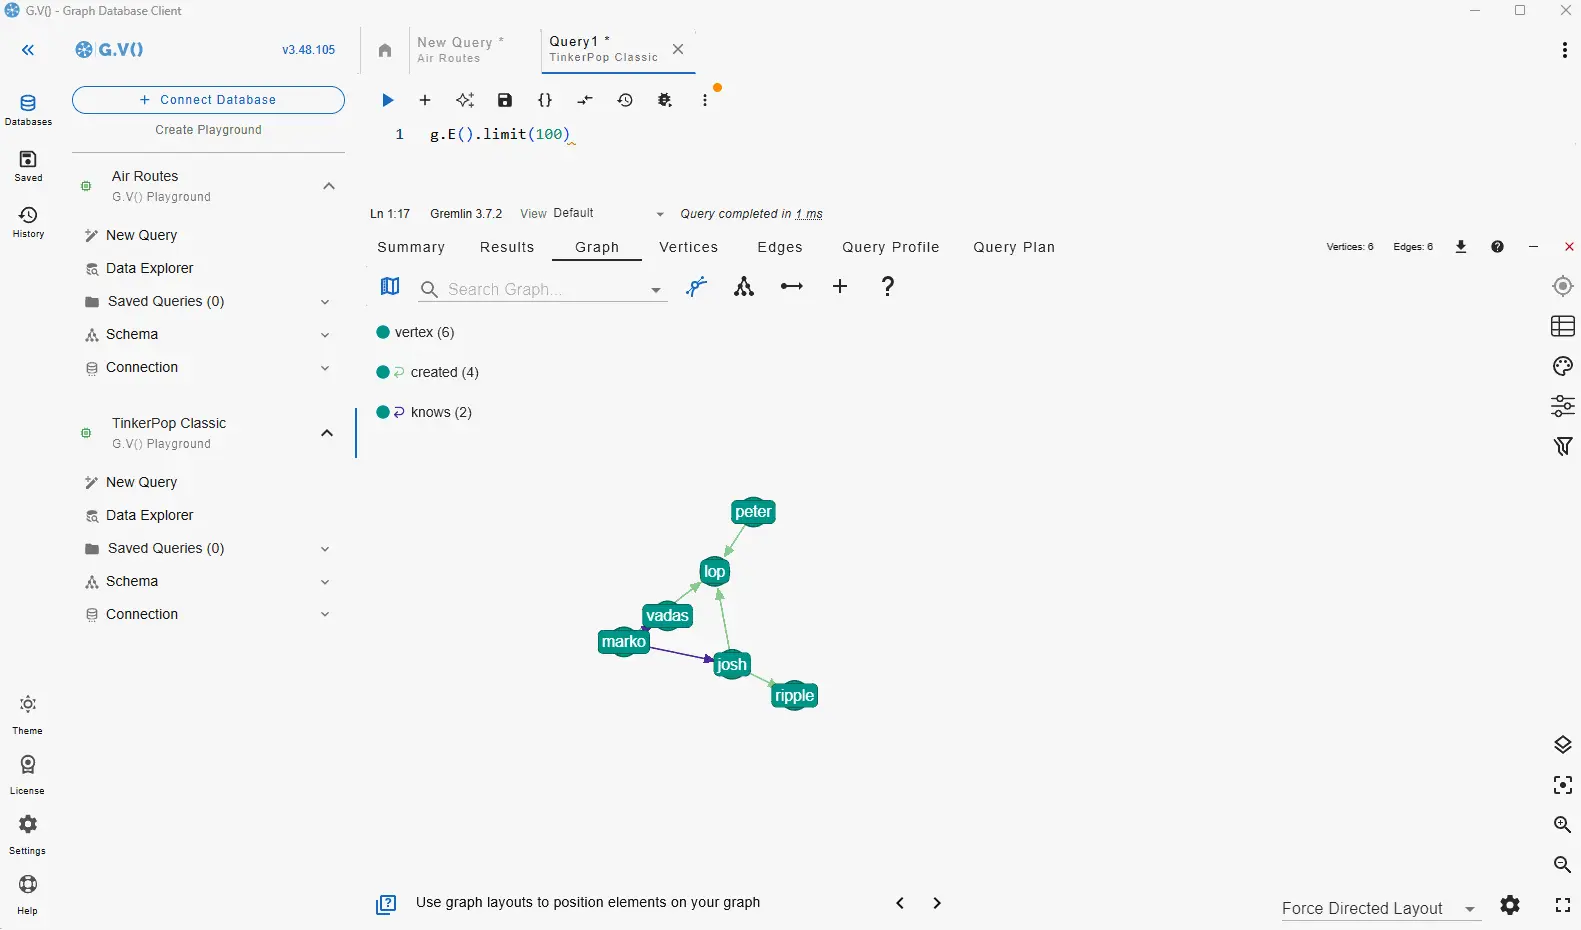
Explore, query and visualize your graph data in Ultipa Graph with gdotv.
A Purpose-Built IDE for Ultipa Graph Developers
Ultipa’s emphasis on high-performance graph traversal and real-time analytics makes it an exciting partner for gdotv in property graph visualization workflows.
Where Ultipa provides the computational power to traverse billions of nodes and edges at speed, gdotv serves as a flexible visual interface for exploring the results of those traversals in an intuitive, interactive environment.
Connecting gdotv to Ultipa allows you to move beyond the built-in Ultipa Workbench and explore graph query results through a purpose-built data visualization tool, offering additional flexibility in how relationships, clusters, and subgraphs are presented and investigated. gdotv allows you to examine and manage your Ultipa graph data with a variety of built-in features, including the no-code graph data explorer, data schema view, syntax highlighting and more.

An Overview of Ultipa Graph
Ultipa is a modern, high-performance graph database designed for real-time analytics on large-scale property graphs. Developed with a focus on ultra-low latency and massive scalability, Ultipa is built to handle demanding use cases such as fraud detection, supply chain analysis, recommendation engines, and financial risk modeling – scenarios where graph traversal speed is critical.
Ultipa offers its own UltipaQL query language alongside support for standard graph query interfaces – notably the ISO GQL standard. It is optimized for deep graph traversal and relationship-centric analytics, making it well suited to operational graph workloads where queries need to return results in milliseconds even across billions of nodes and edges.
With cloud-native architecture and strong enterprise support, Ultipa is positioned as a leading choice for organizations requiring real-time, large-scale graph analytics.
What’s Possible with Ultipa Graph + gdotv
Easy Installation & Setup
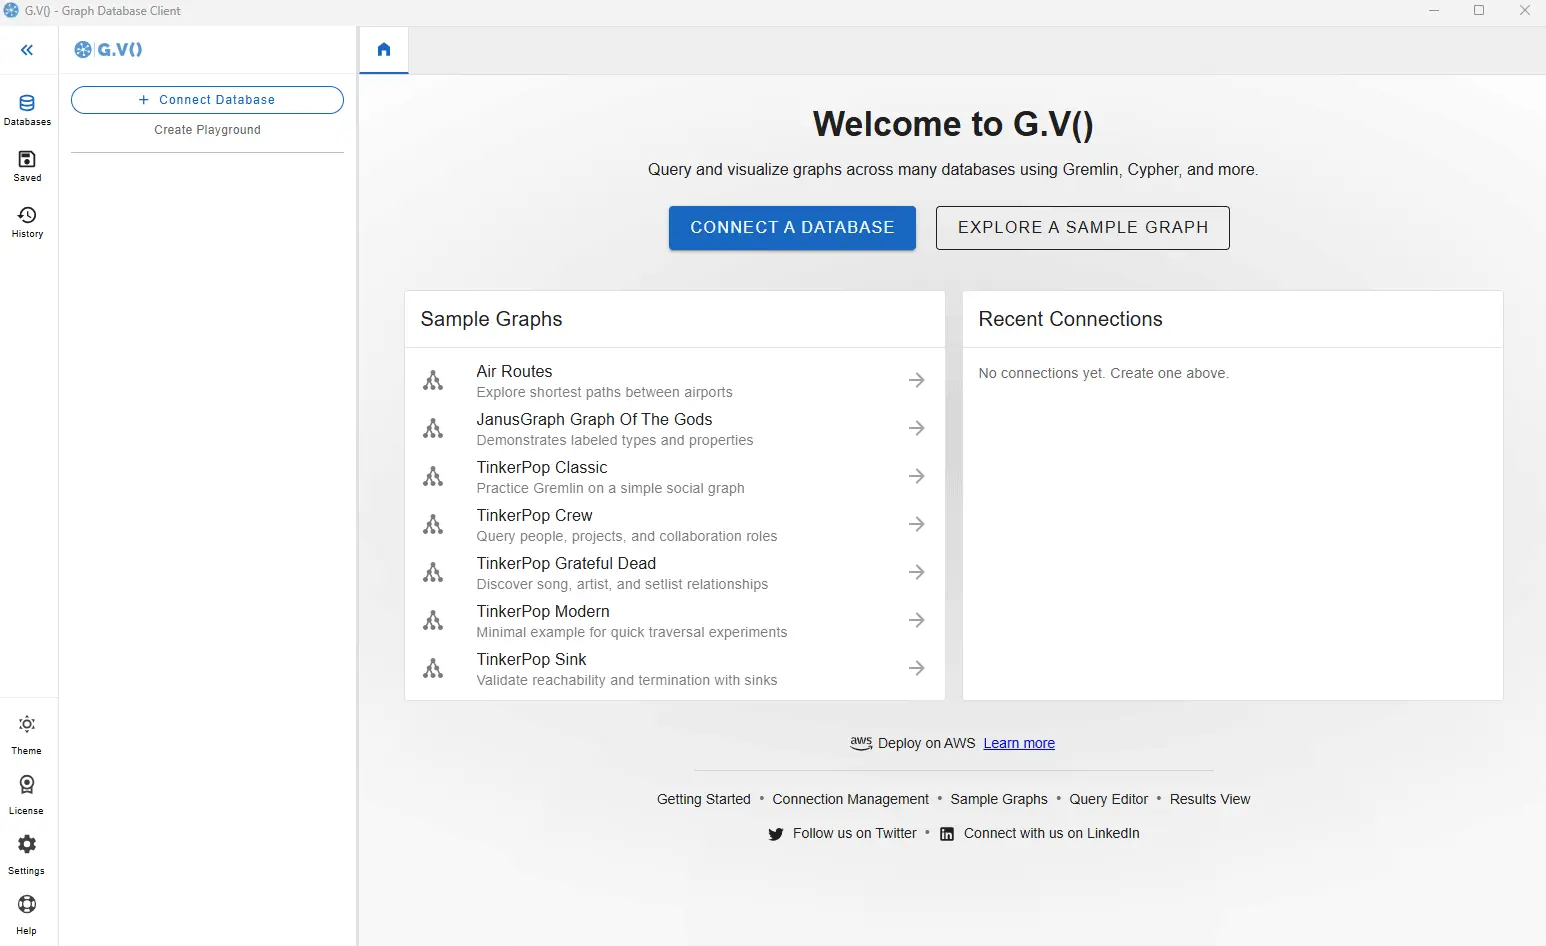
Effortlessly integrate gdotv with your Ultipa Graph graph database with a simplified plug-and-play database connector. The gdotv database client provides straightforward database connection and configuration instructions to get you started in less than a minute.
This Ultipa Graph IDE is available to download for Windows, macOS, and Linux with a one-click installer to get you started instantly.
Centralized Connection Management
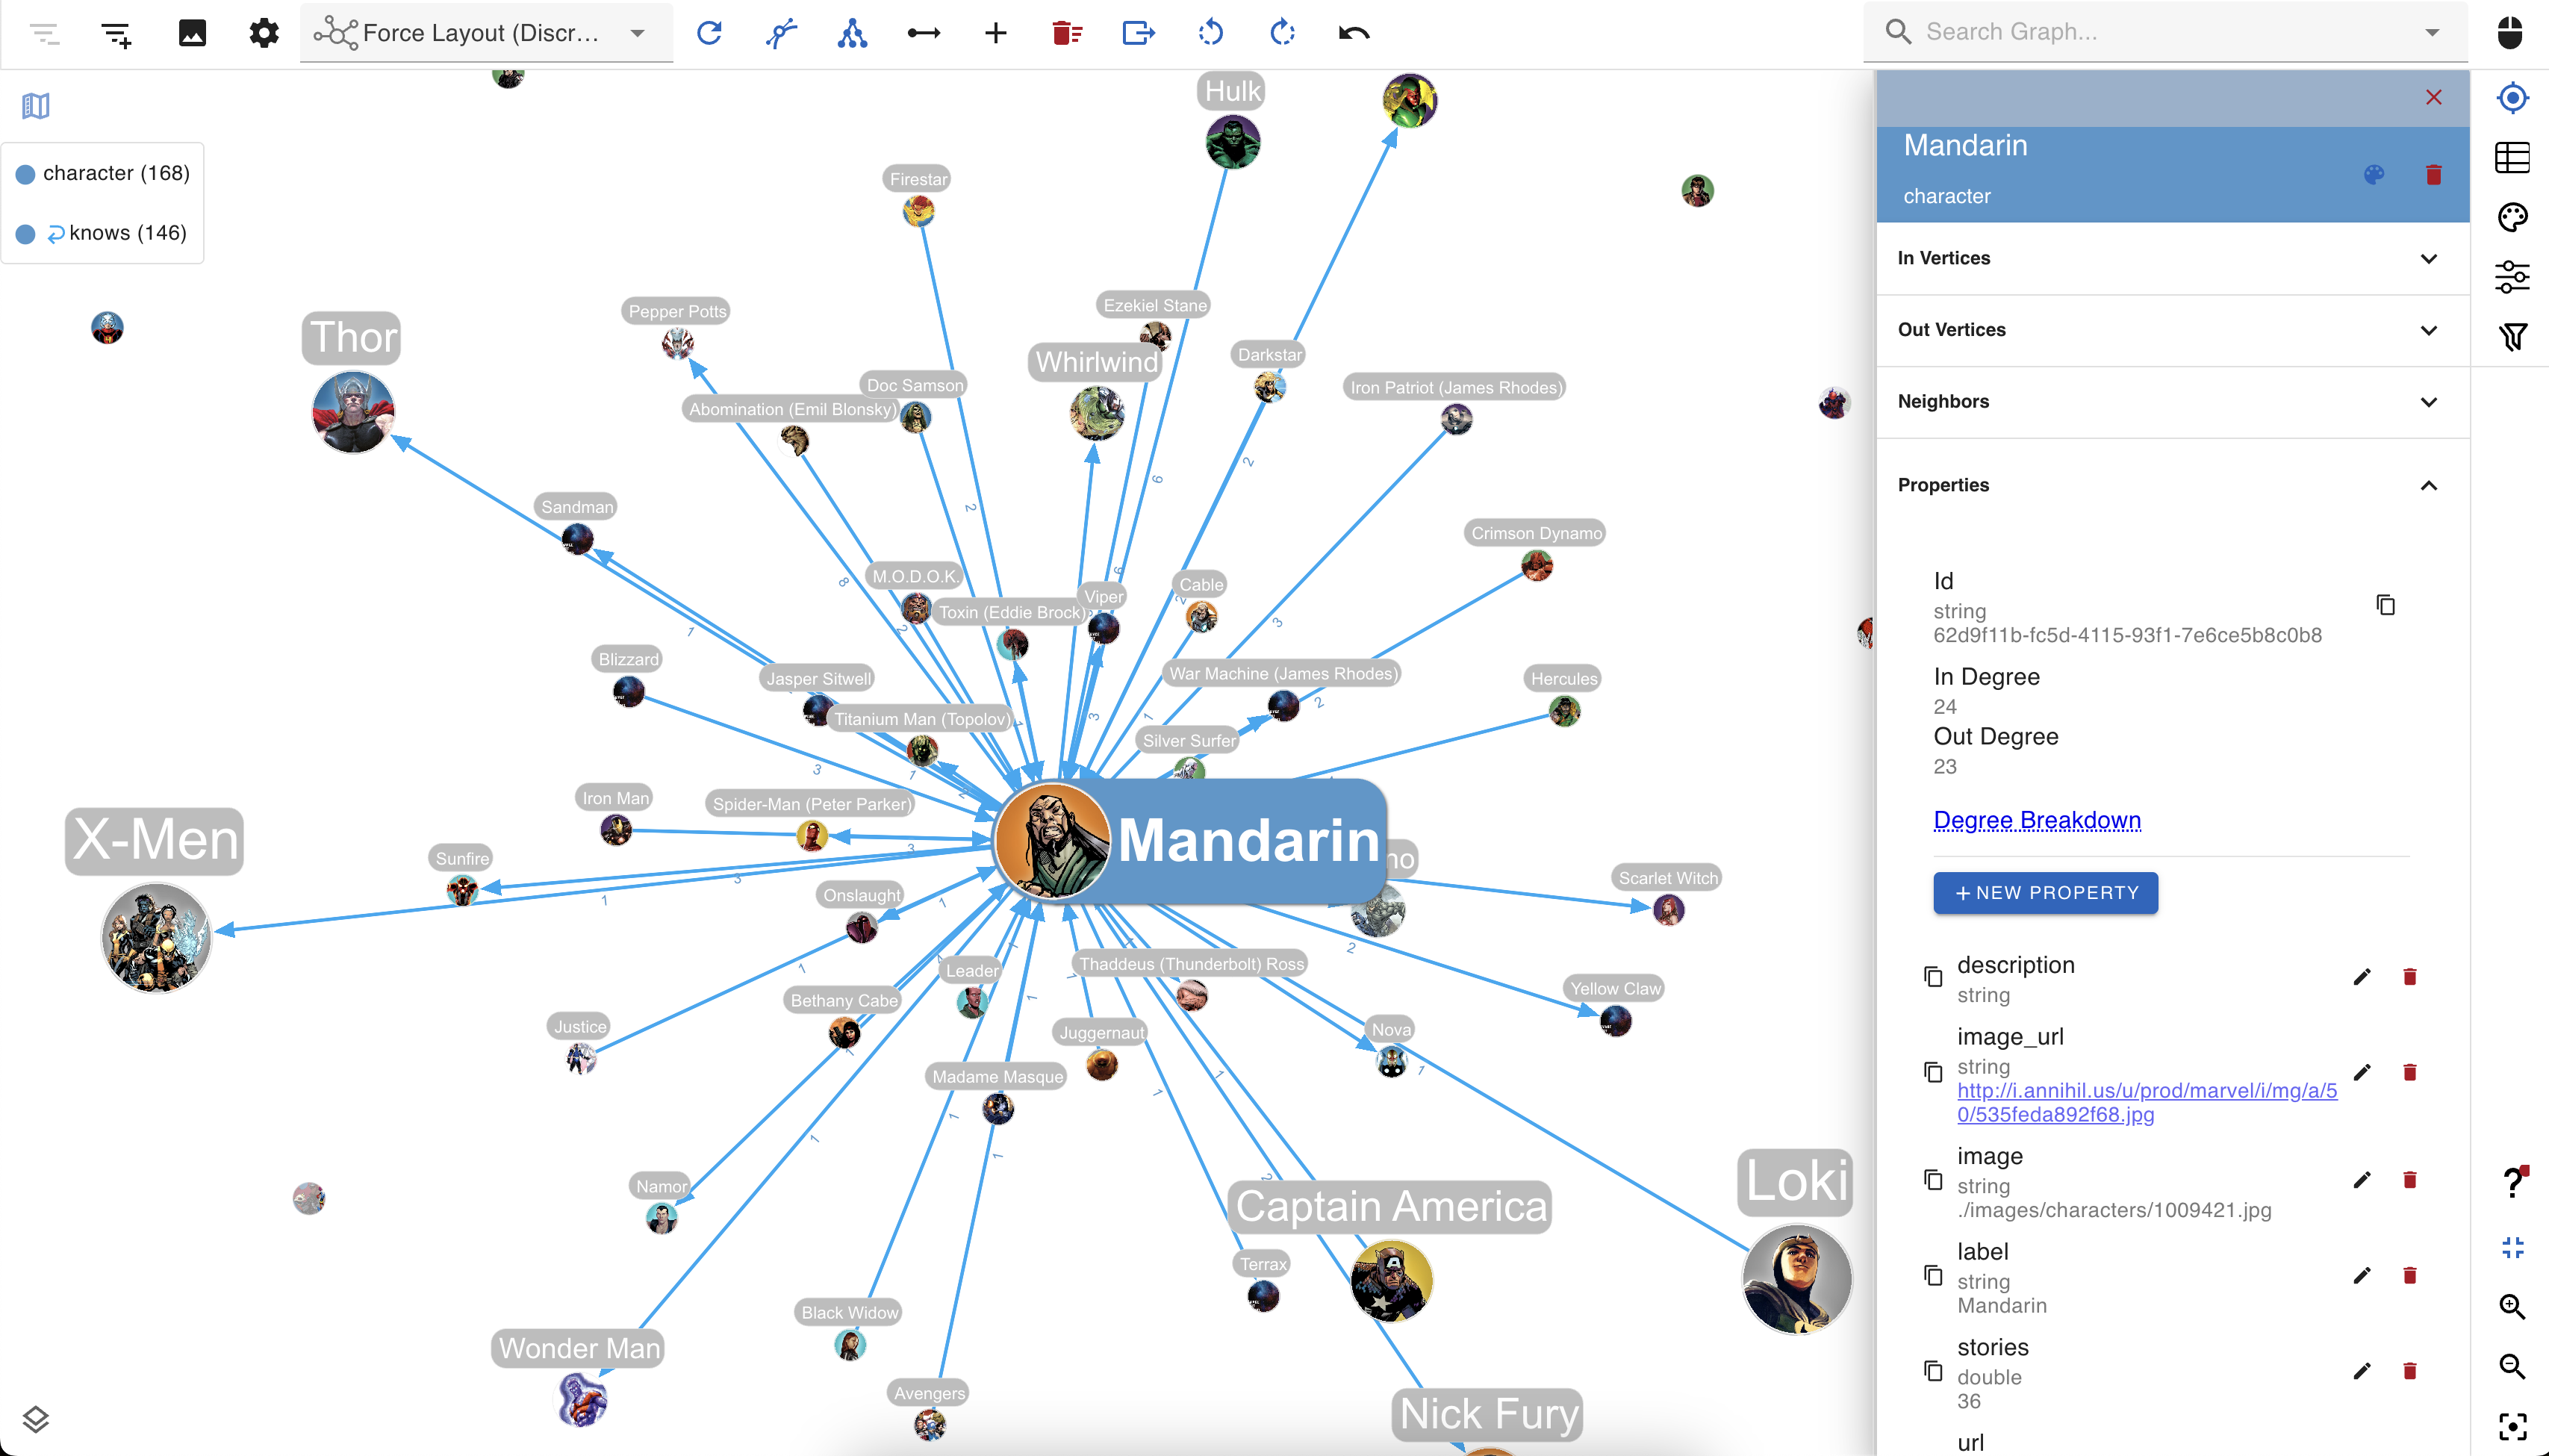
gdotv can be used to query and compare data from a huge range of graph database vendors – simultaneously! We don’t just work with Ultipa Graph: gdotv data visualization tools fully integrate with various other graph technologies, including all Apache TinkerPop™ compatible graph databases and most LPG and RDF providers.
gdotv is fully compatible with query languages like Gremlin, Cypher, Google SQL, SQL:2023, SPARQL and more. Using an intuitive UI, you can switch between your connections and queries seamlessly.
Customizable Data Visualization
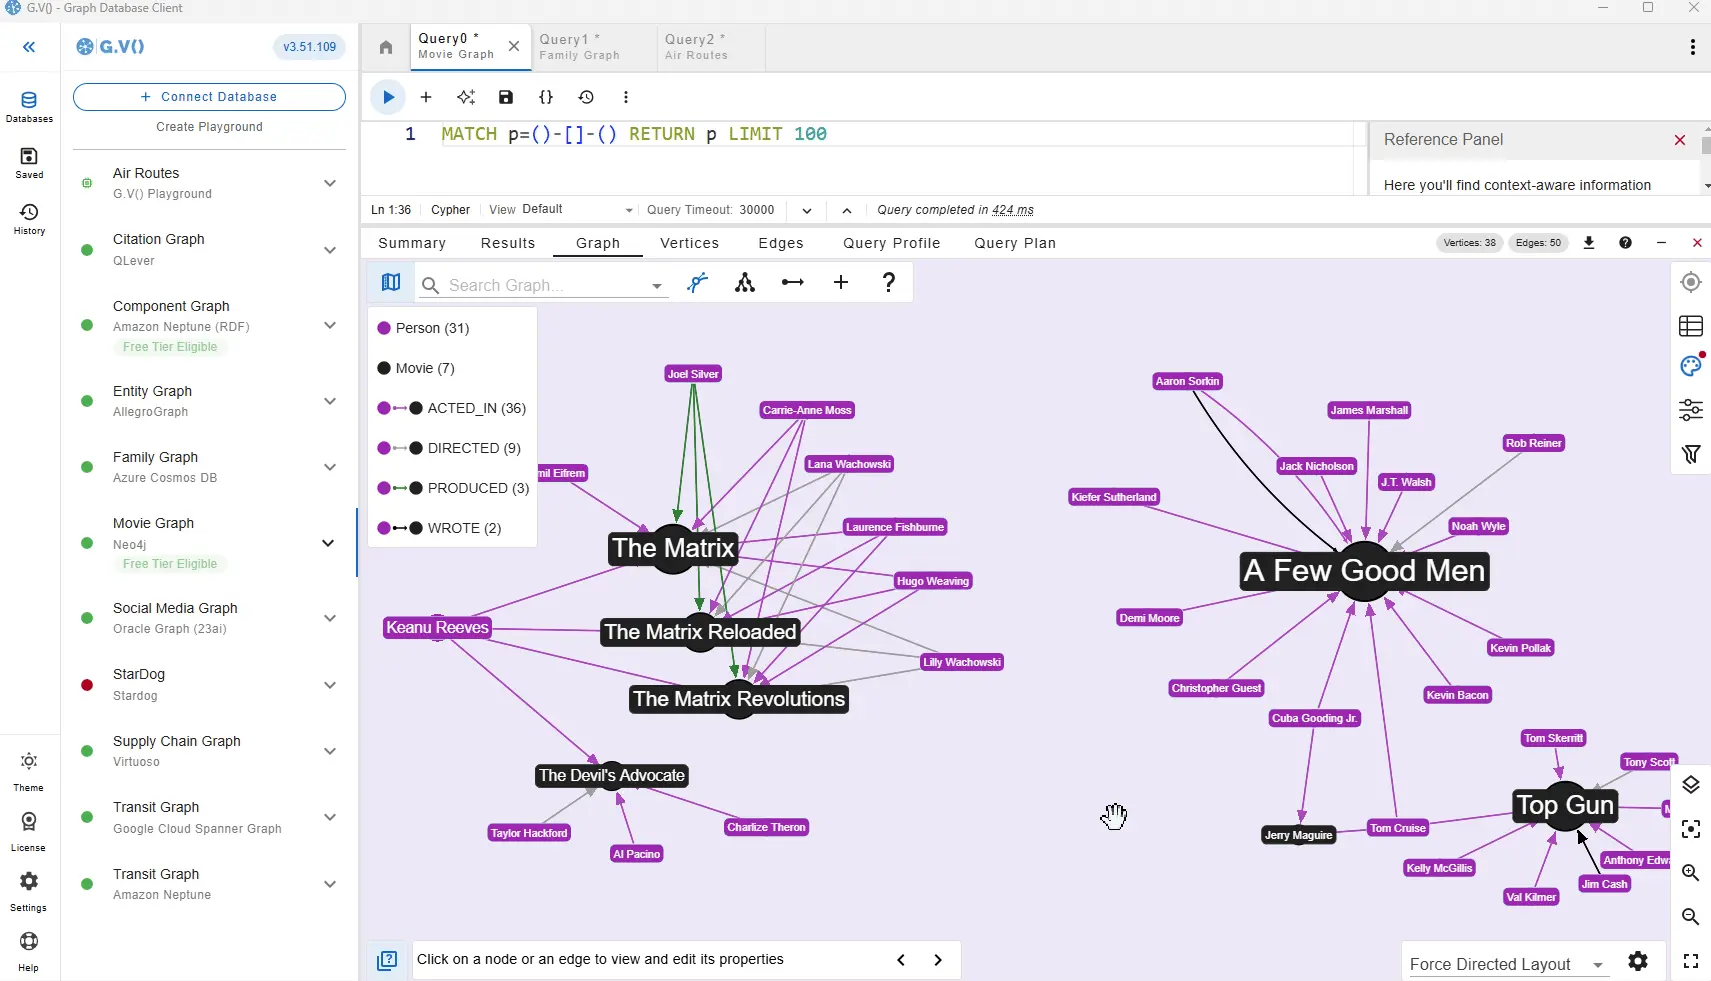
You can create custom visualization rules for your Ultipa graph database with gdotv to determine the look and feel of your data.
The gdotv database client boasts easy-to-configure style options that you can use to customize vertices and edges based on their labels and property values.
You can choose any color, size, or background image and adjust other elements to match your preference.
No-Code Data Exploration with the gdotv Graph Data Explorer
Use the built-in gdotv Graph Data Explorer to navigate your Ultipa Graph data without using queries.
The Graph Data Explorer allows you to define path patterns to query from your data, using filters on both your vertices and edges. Elements in the declared path can be filtering according to their label, direction, and property values, allowing you to perform complex path-pattern searches with no code.
Instantly Load & View Your Data Model
Understanding and verifying your data schema is critical component of graph management. This is why gdotv provides an overview of your data structure with the data model view.
For Ultipa Graph, there is no need to provide a data model, as gdotv is able to infer the schema directly from the data itself. This is always just a click away, meaning that you always have an bird’s-eye view of your vertices, edges, and properties right at your fingertips.


Retrieve & Review Query Execution Plans in 1 Click
A query execution plan provides a roadmap for how your query will be executed, ensuring efficient use of your graph database.
gdotv pulls the query plan from your Ultipa Graph database’s own functionality and displays the results, giving you instant feedback on query execution and performance.
Modify Your Ultipa Graph Data Directly within gdotv
Want to adjust something in your graph? Take a hands-on approach and manage your Ultipa Graph graph directly.
Using gdotv, you can directly create, modify, and delete the edges and vertices – as well as modify the properties associated with them – allowing you to make changes on the fly.
Ultipa Graph + gdotv Blog Posts

![The Weekly Edge: Microsoft Sentinel Graph, Columnar Graph Databases, Euler & More [3 October 2025]](https://gdotv.com/wp-content/uploads/2024/10/microsoft-sentinel-graph-column-oriented-graph-database-euler-weekly-edge-3-october-2025.png "The Weekly Edge: Microsoft Sentinel Graph, Columnar Graph Databases, Euler & More [3 October 2025]")
 3.40.94 Release Notes: Ultipa Graph support, Embedded Cypher Documentation")
 now supports Ultipa Graph Database")
gdotv: The Ultipa Graph IDE
Turn your graph data into connected insights when you use gdotv to query, explore, and visualize your Ultipa Graph graph database.
Sign up for a free trial today and discover how gdotv amps up your productivity as the perfect Ultipa Graph IDE and graph visualization tool.
Or, prefer to talk with the gdotv team directly? Use the form below to get in touch.