G.V() 3.23.59 is out, adding support for Kuzu and Dgraph, and improved visualization
G.V() 3.23.59 is out now, bringing support to two new graph database technologies, Kuzu and Dgraph. We’ve also packed this release full of improvements to our graph visualization and data model viewer user experiences – this is an update you don’t want to skip!
As per usual we’ll be walking you through what’s new and improved below, so stick around to see what we’ve been up to!
Bringing support to Kuzu, the embedded graph database
When we found out about Kuzu, we got super excited about its potential. Unlike other graph databases out there, Kuzu is an embedded database, meaning it runs in-process with your application, eliminating the burden of deployment and management of a DBMS server.
It’s also engineered for optimal performance, particularly when performing analytics query workloads on large graphs. And here’s the best part: Kuzu is fully free and open source with a permissive MIT license!
We’ve been working on the integration directly with their team, and you can now connect your Kuzu database to our software in less than 30 seconds, allowing you to query your graph data with Kuzu Cypher, create graph visualizations and browse your data model effortlessly. See for yourself:
Also introducing support for Dgraph & Hypermode Graphs (powered by Dgraph)
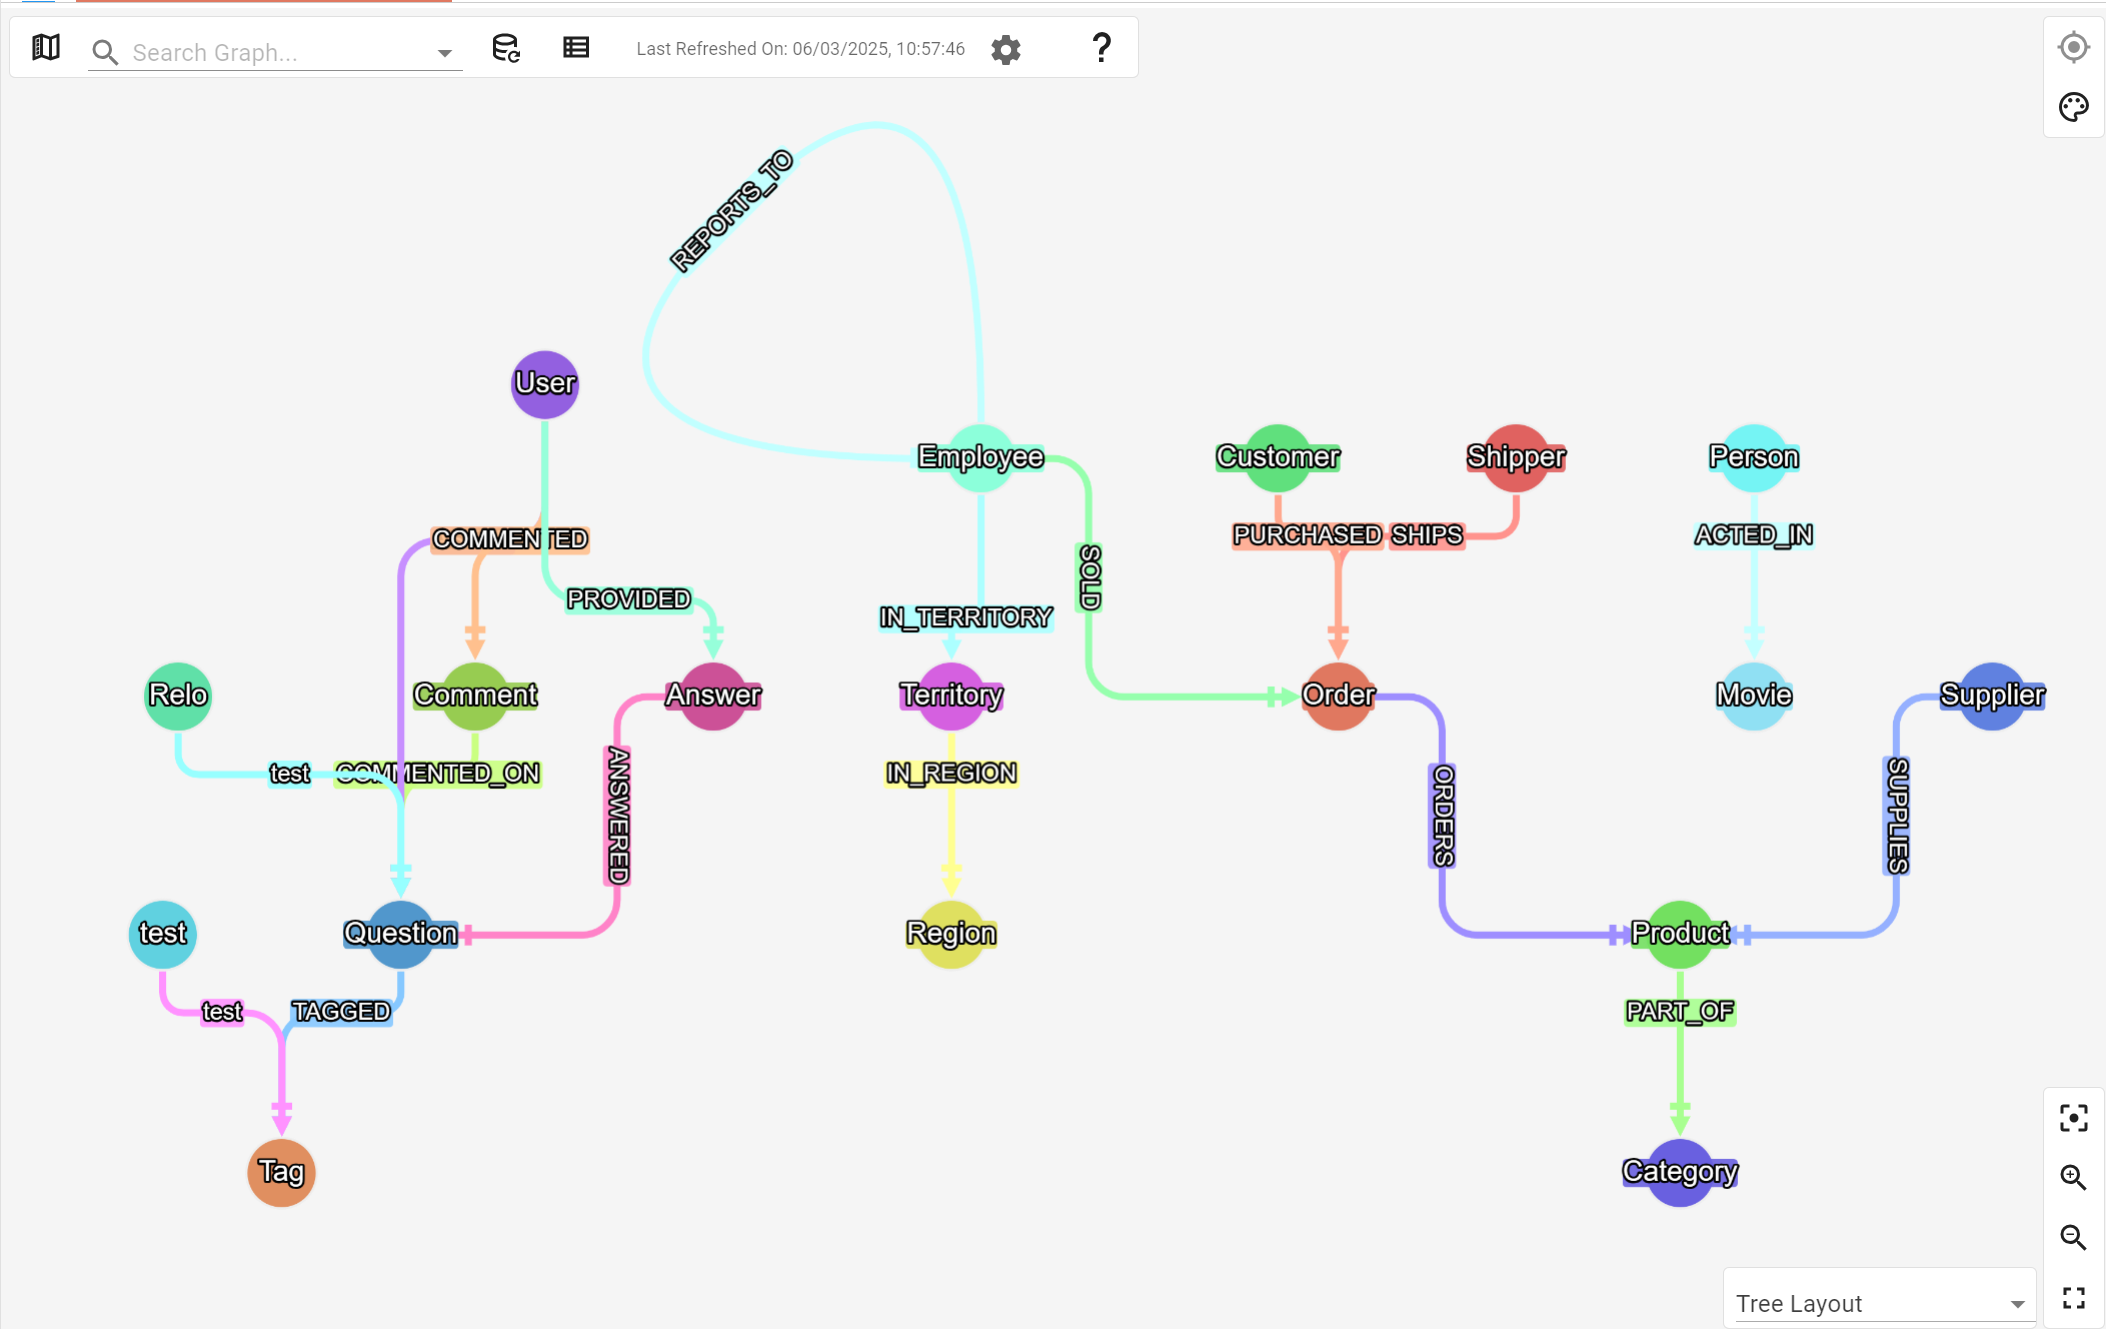
Data Model Viewer Improvements
G.V()’s data model viewer gives users the ability to display their graph data schema, whether implicitly discovered or explicitly defined via vendor specific schema APIs.
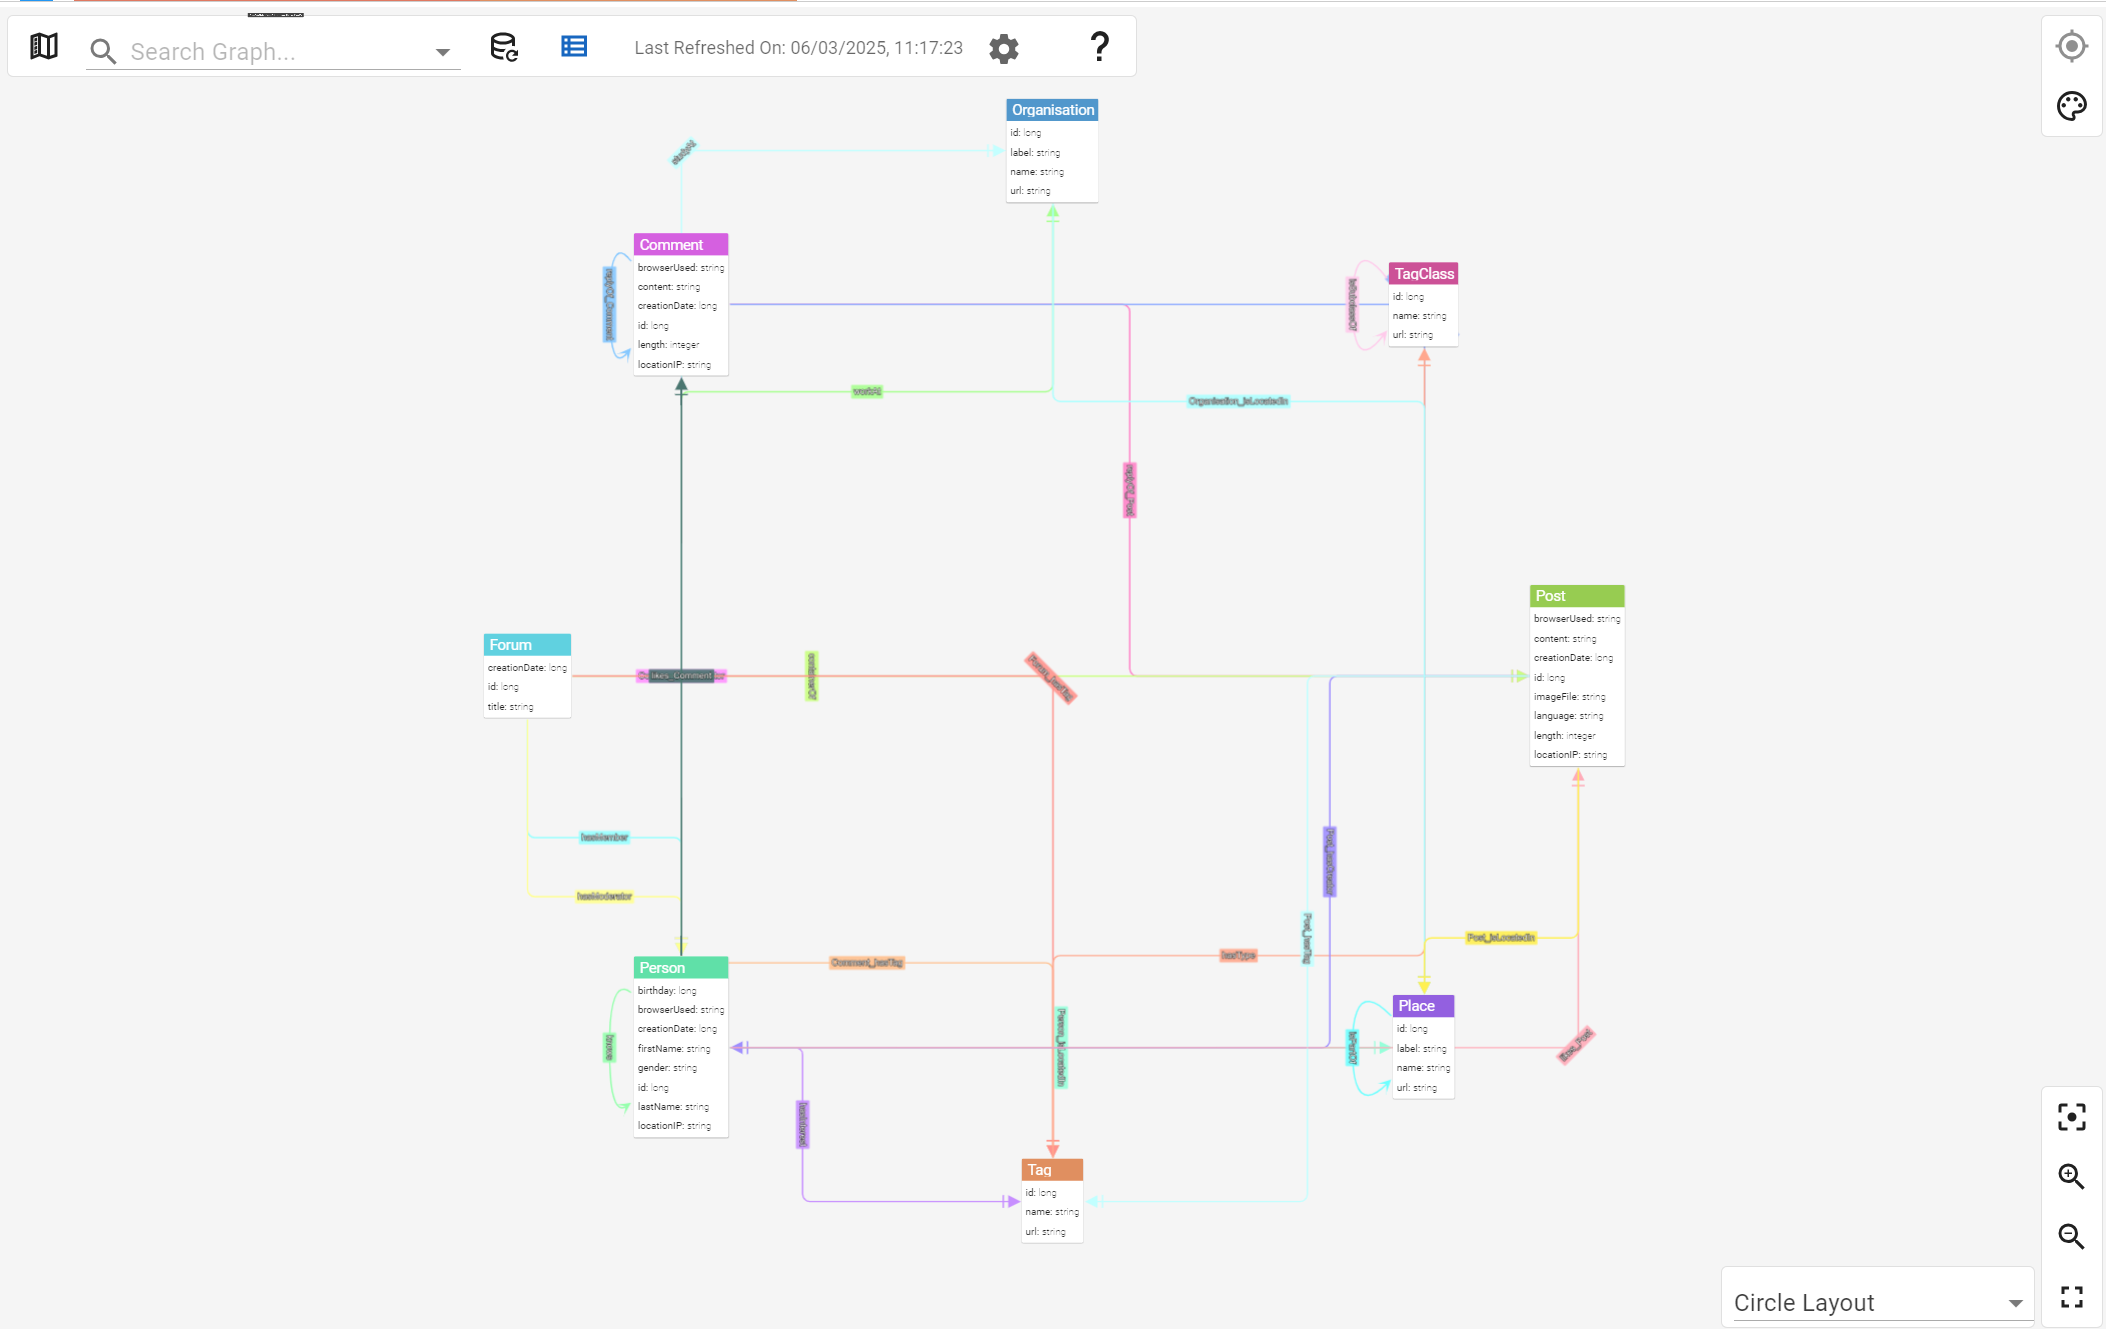
The graph data schema display is available both an Entity-Relationship diagram or a graph, and is very useful to keep a good visual understanding of how your graph is structured. Graph can get complex quickly and so can the resulting display. In this release, we’ve reworked aspects of the display to make it easier to navigate and visually parse. To illustrate, let’s have a look at the before and after, as well as some extra samples of the new schema view.
Before:
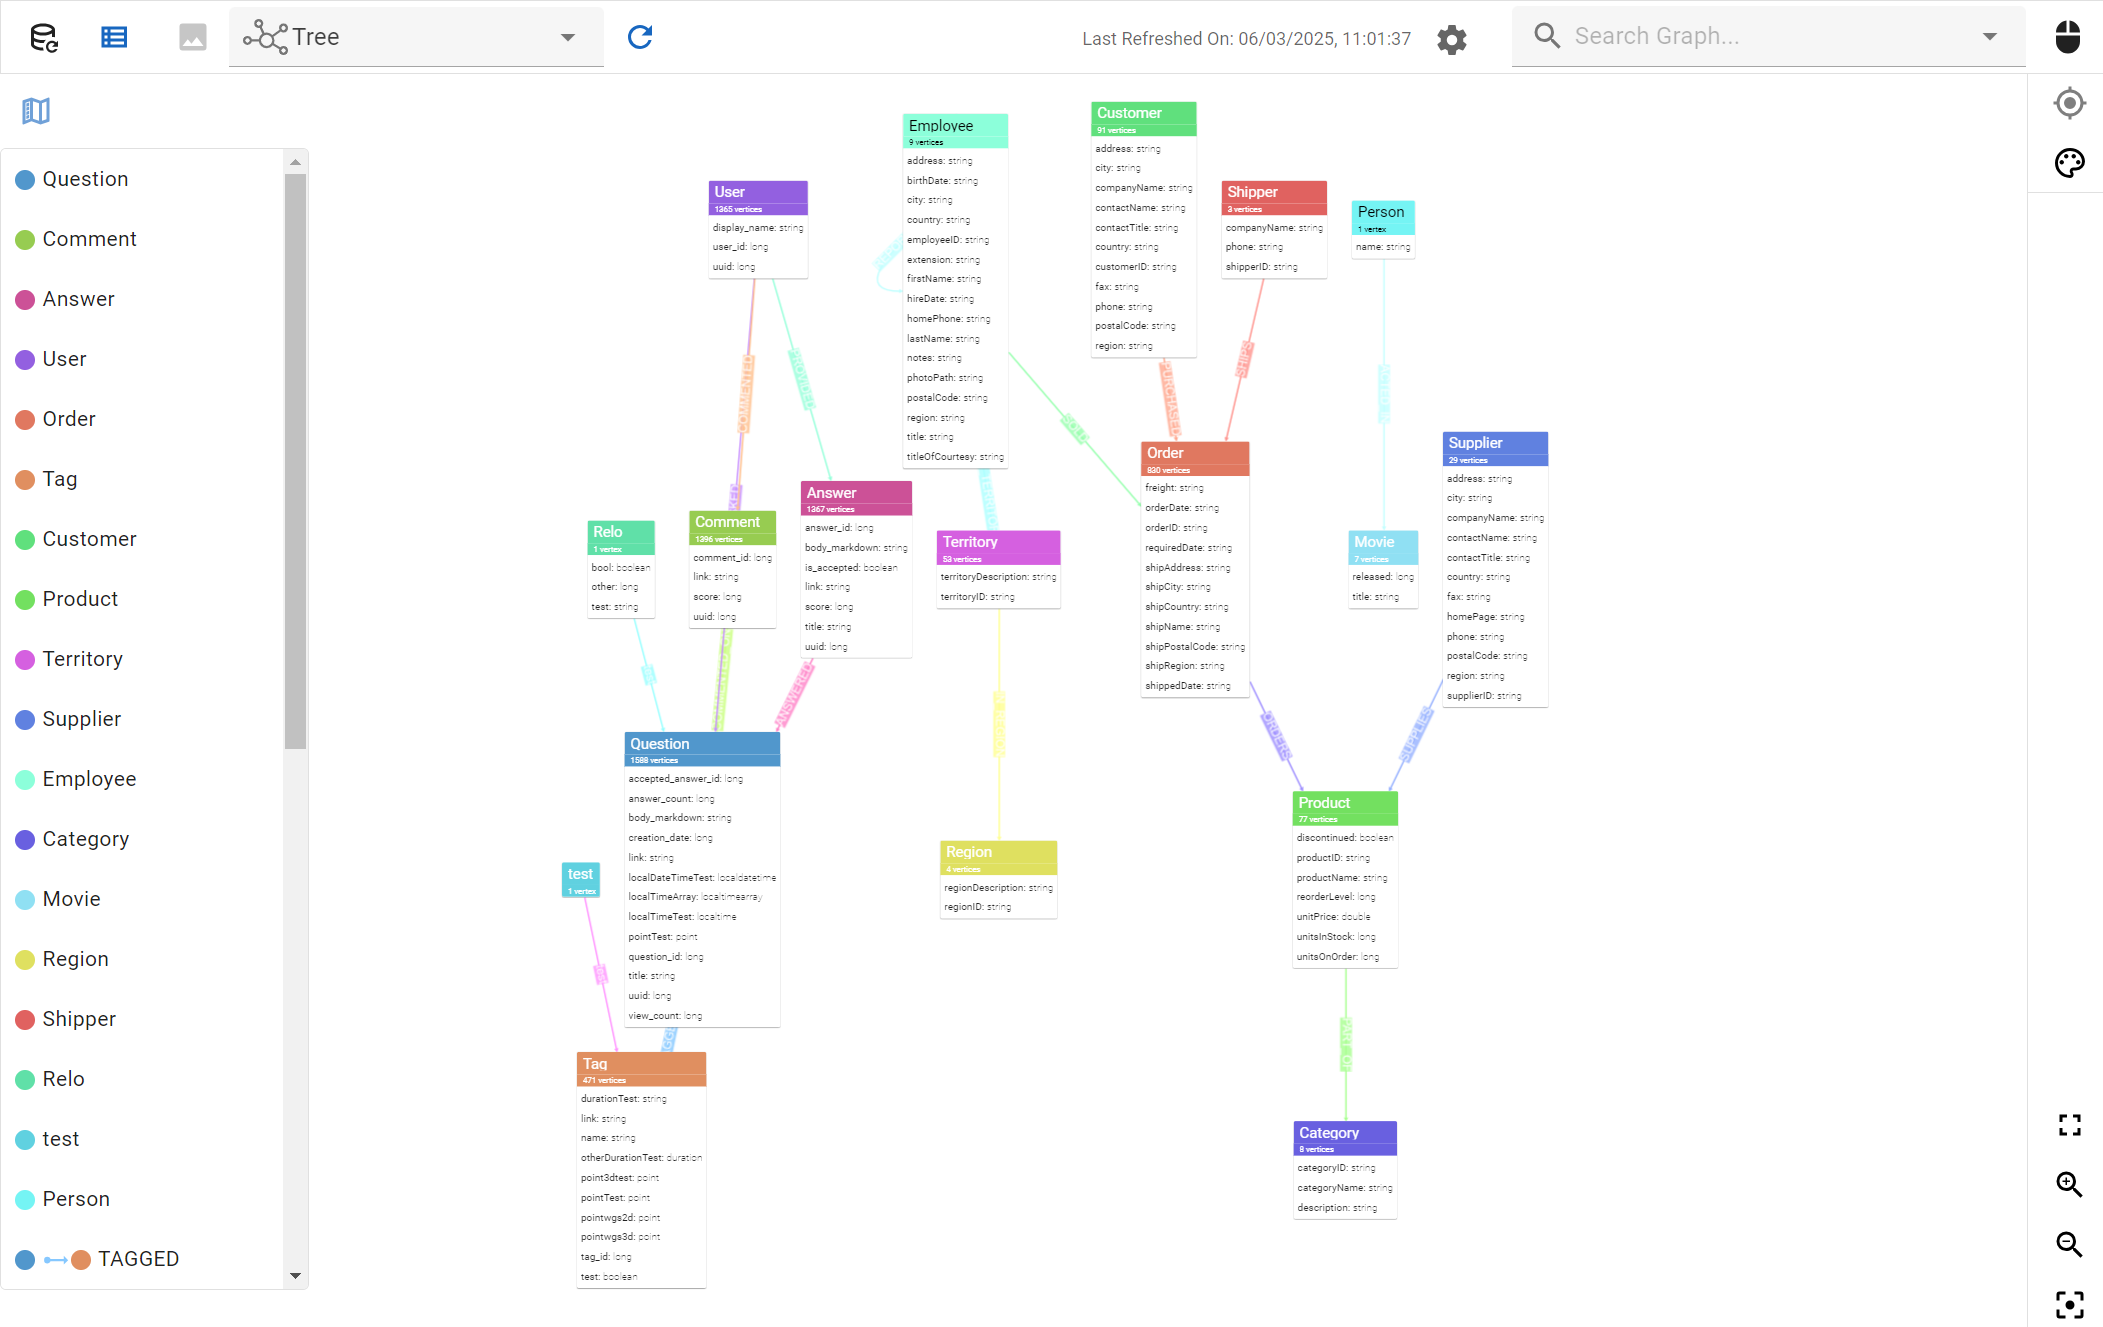 The previous version of our entity-relationship diagram display
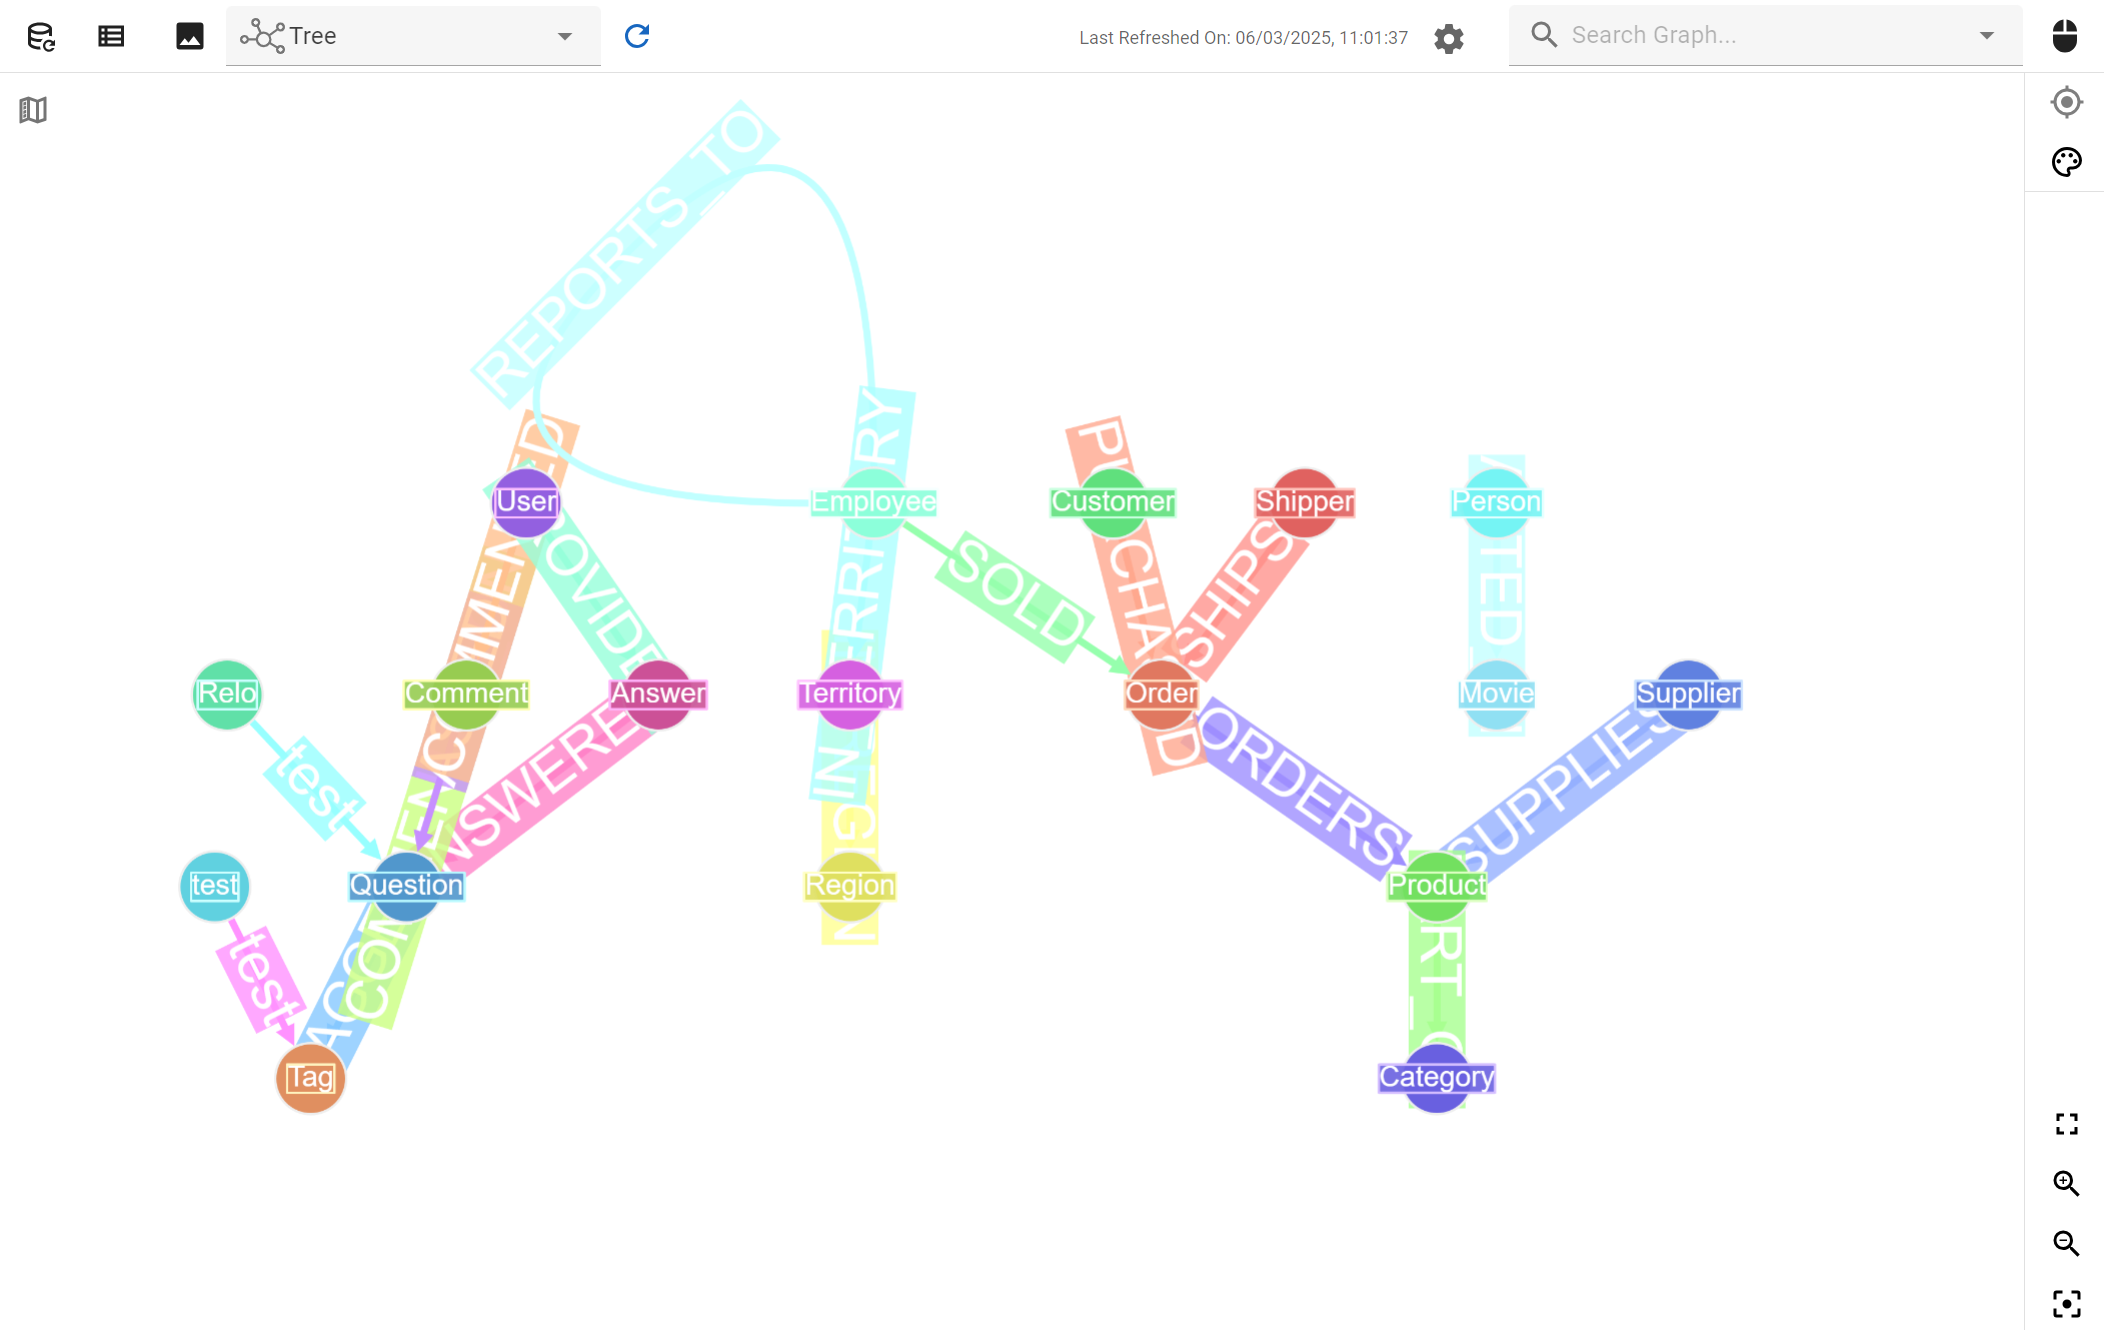 The previous version of our graph data model view
And after:
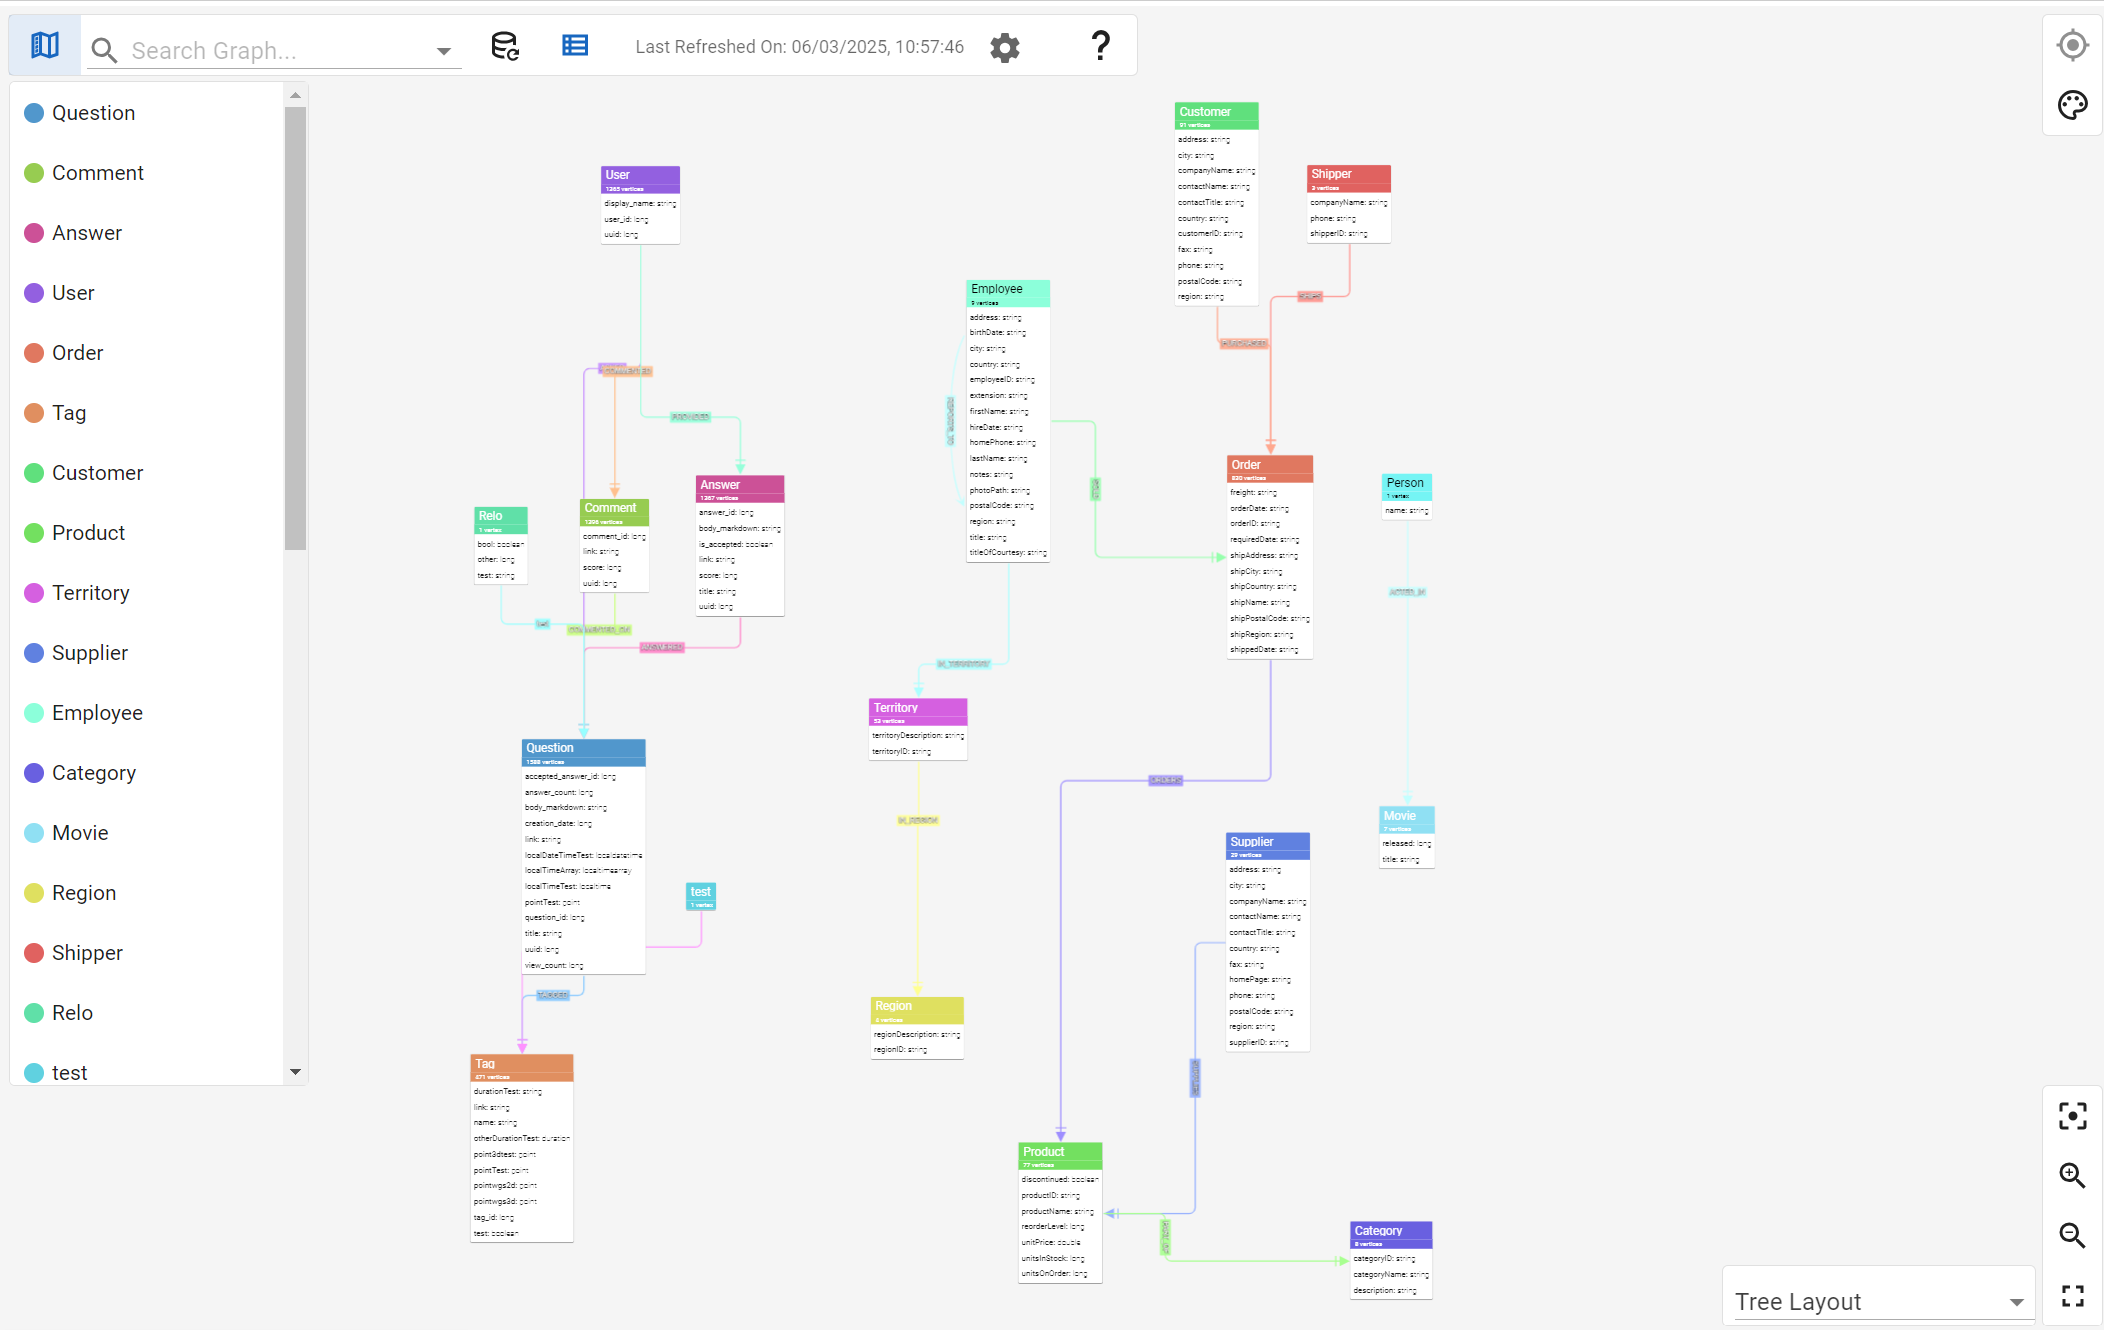

The differences should be self-explanatory here but the key point is that it’s now much easier to read the data model display, especially as it gets more dense. We’ve replaced curved edges with taxi edges that re-route edges from densely connected components much more efficiently. Layouts are also now animated to give the visualization a bit more life to it.
Here’s a couple more of the improved displays for good measure:
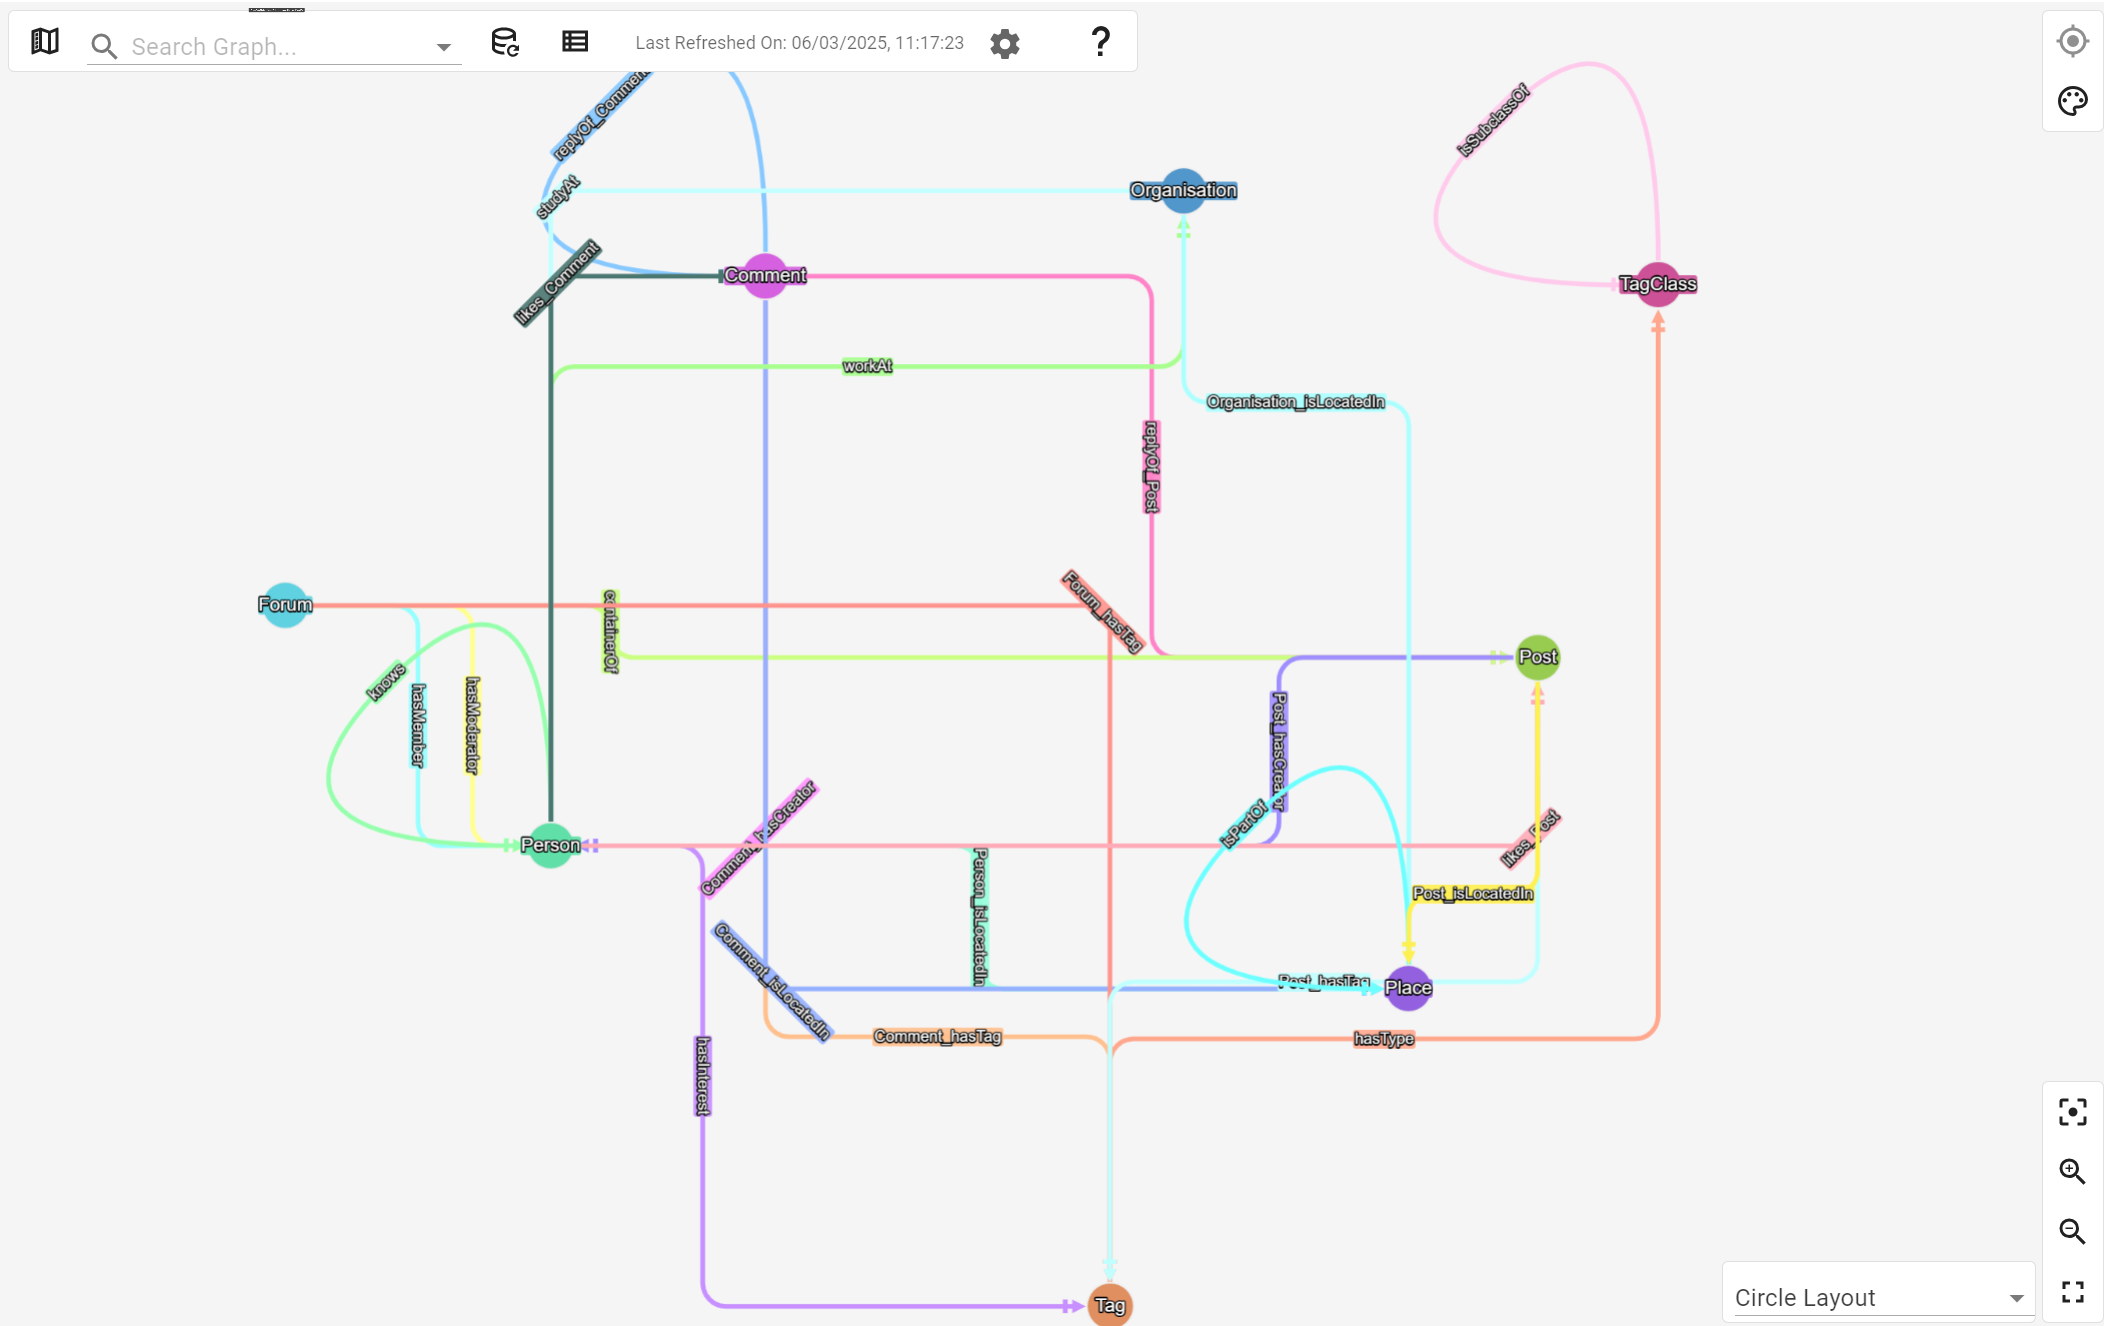
Improved graph visualization controls layout
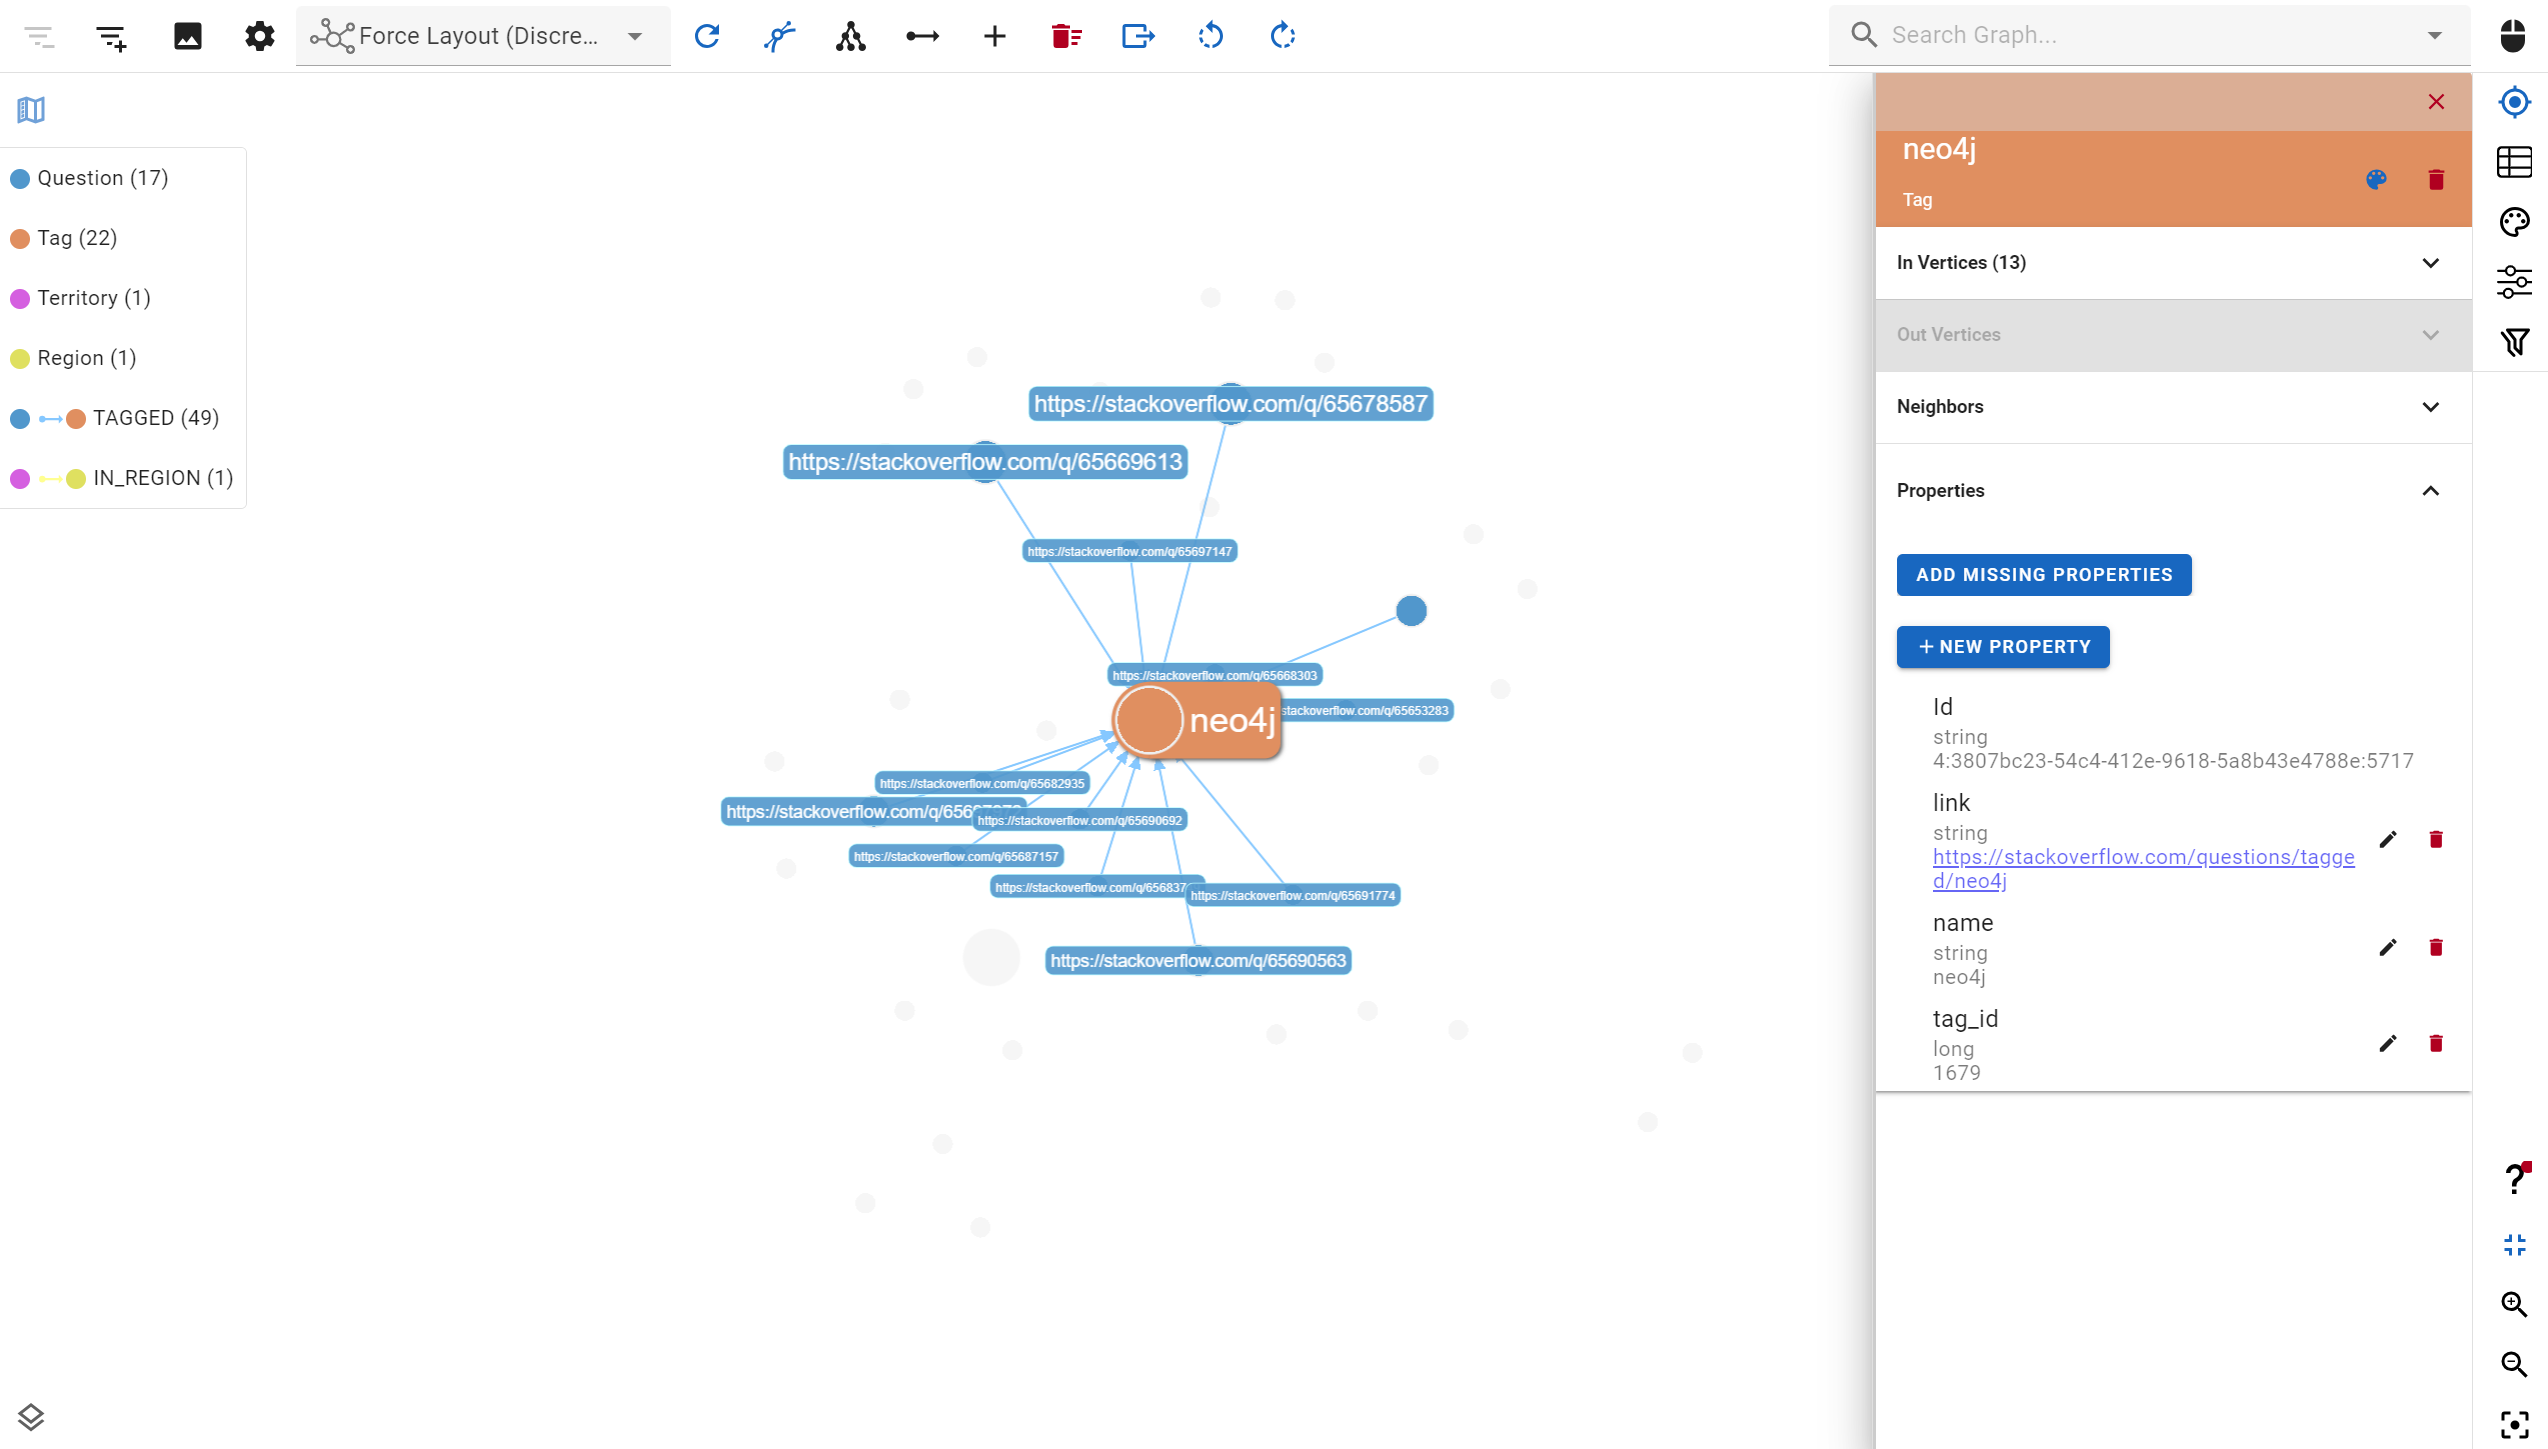
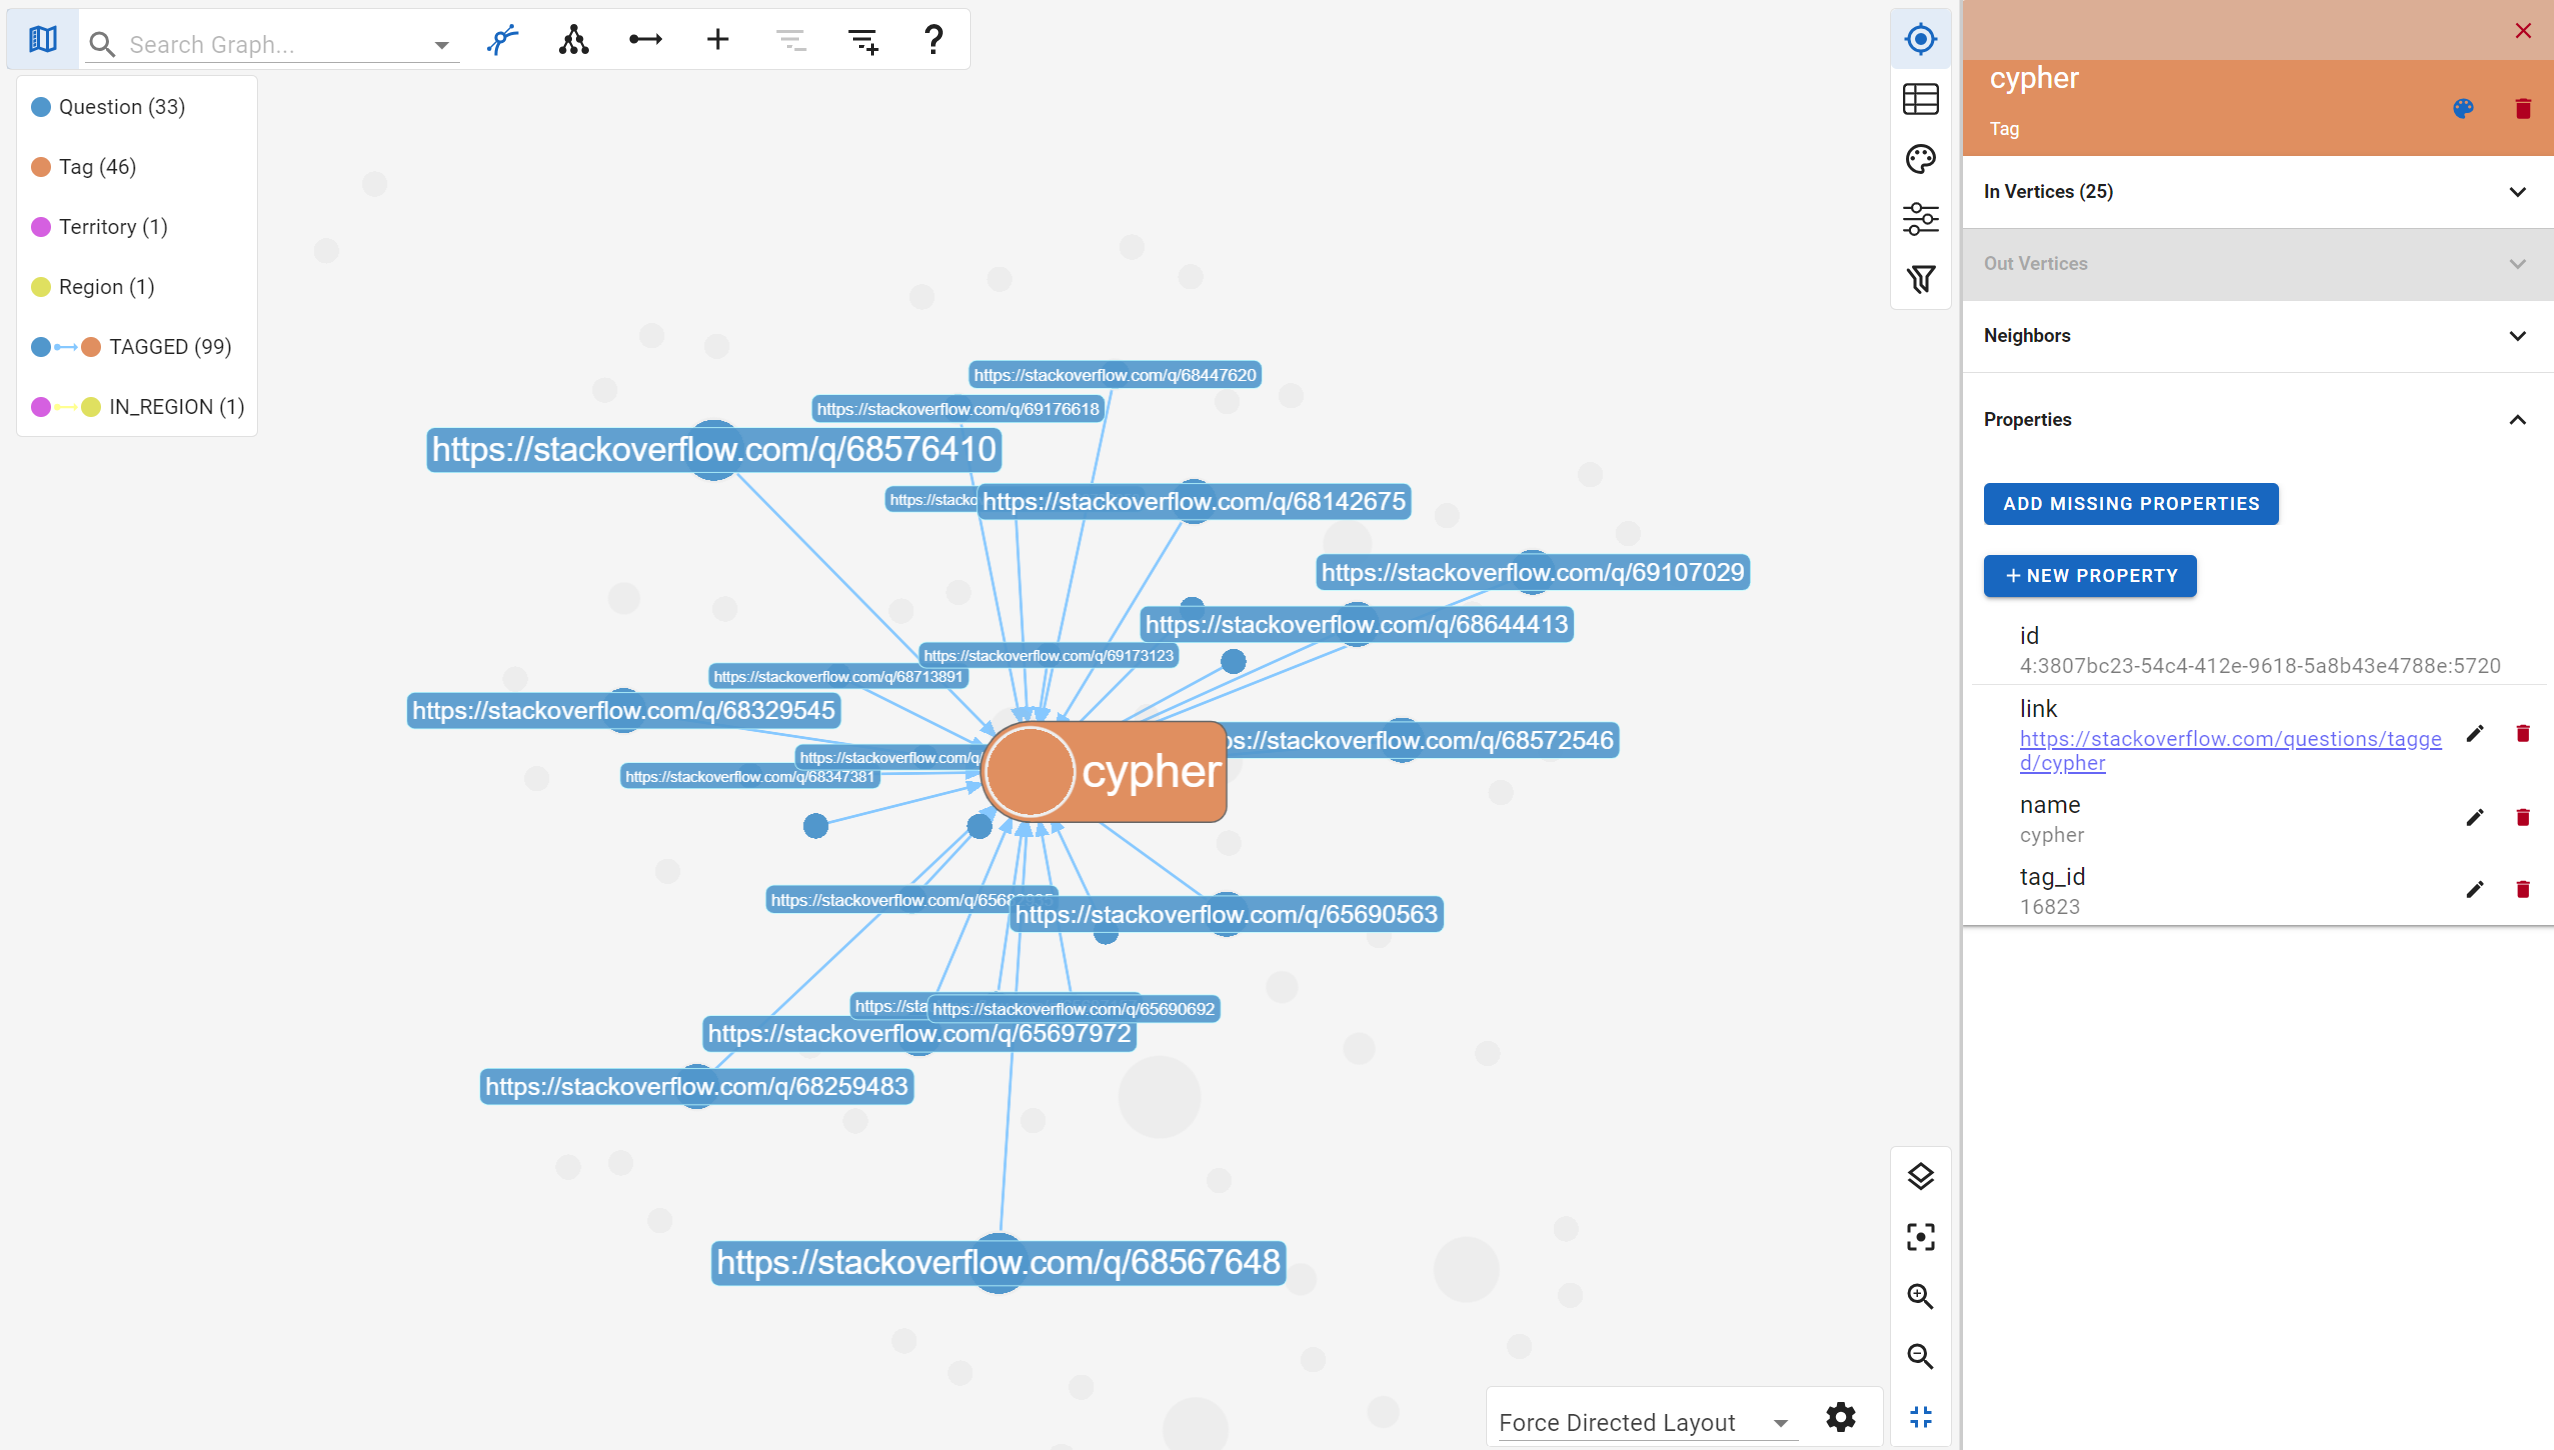
We’ve also reworked the layout of the graph visualization controls to use space more efficiently around the screen. Some graph view tips have been added to help you understand quicker what features are available on the graph view, and how to use them.
This results in a more aesthetically pleasing graph display with an overall much improved user experience. Interacting with the graph view is an important component of our software and we want to make it as straightforward as possible. Once again to illustrate these changes, have a look at this before and after comparison:
Before:
And after:
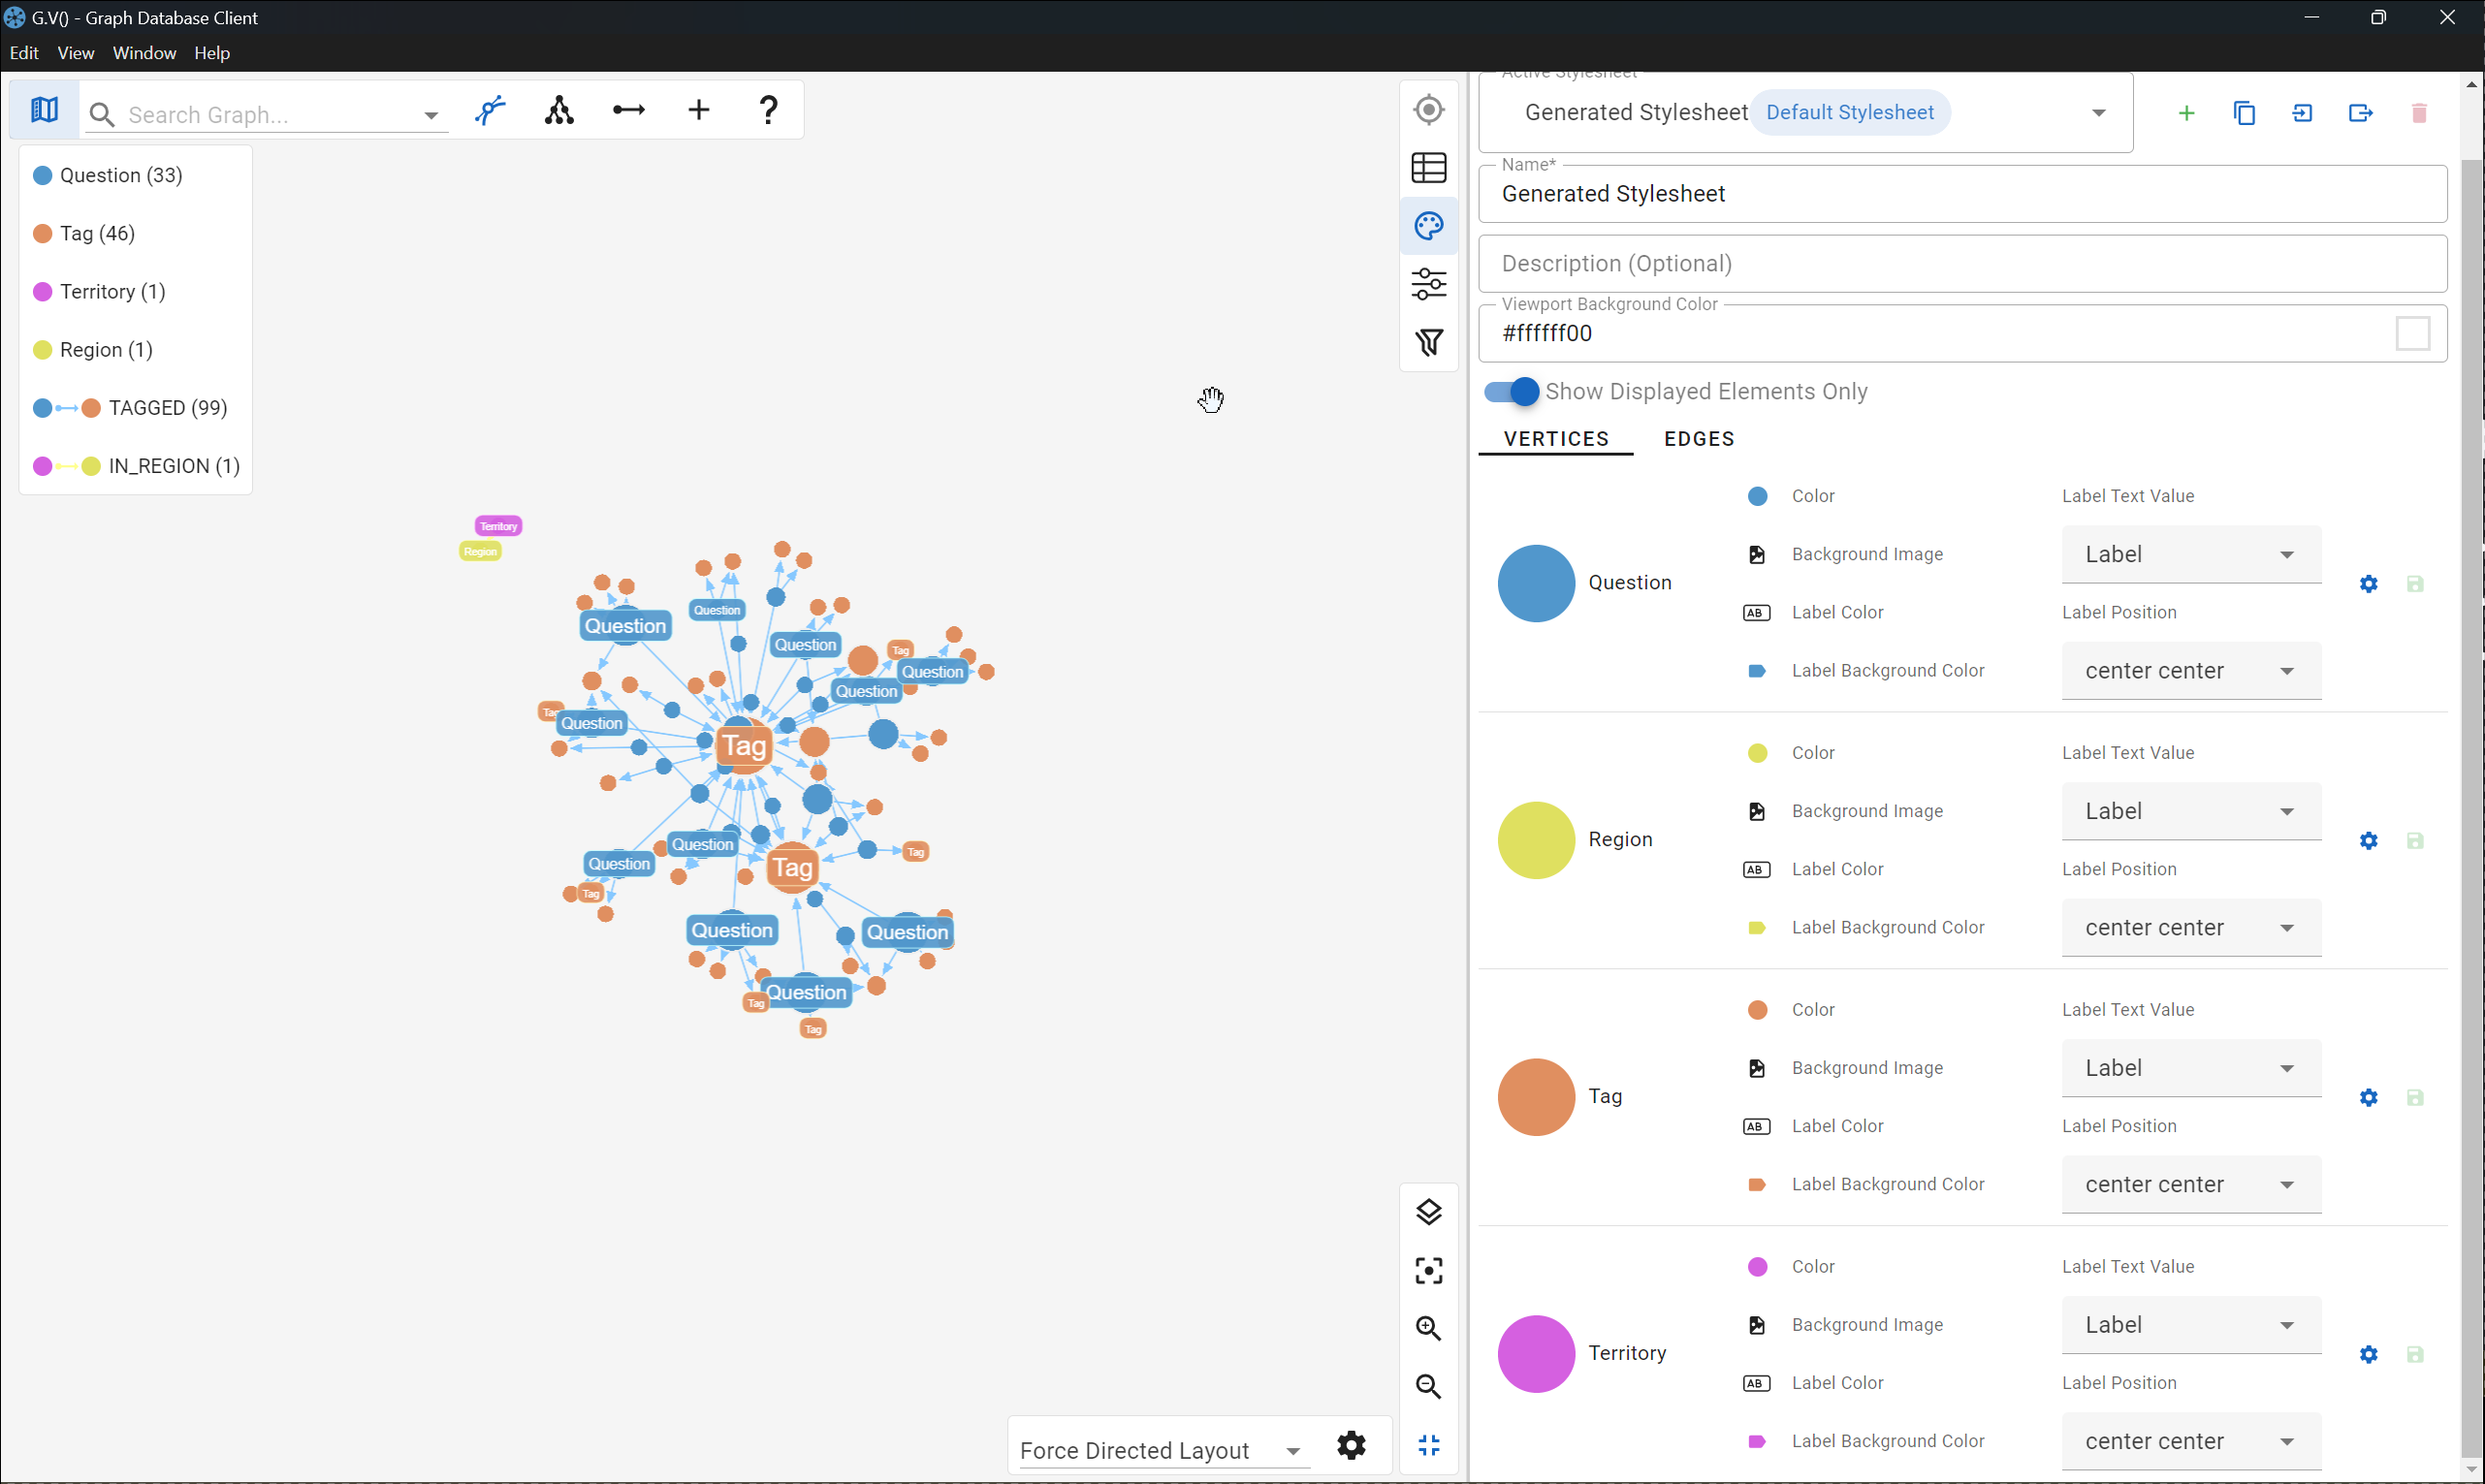
Stylesheet modifications now also modify the graph display as they’re being made so you can instantly preview your changes before saving them, as shown below:
Everything else and what’s coming next
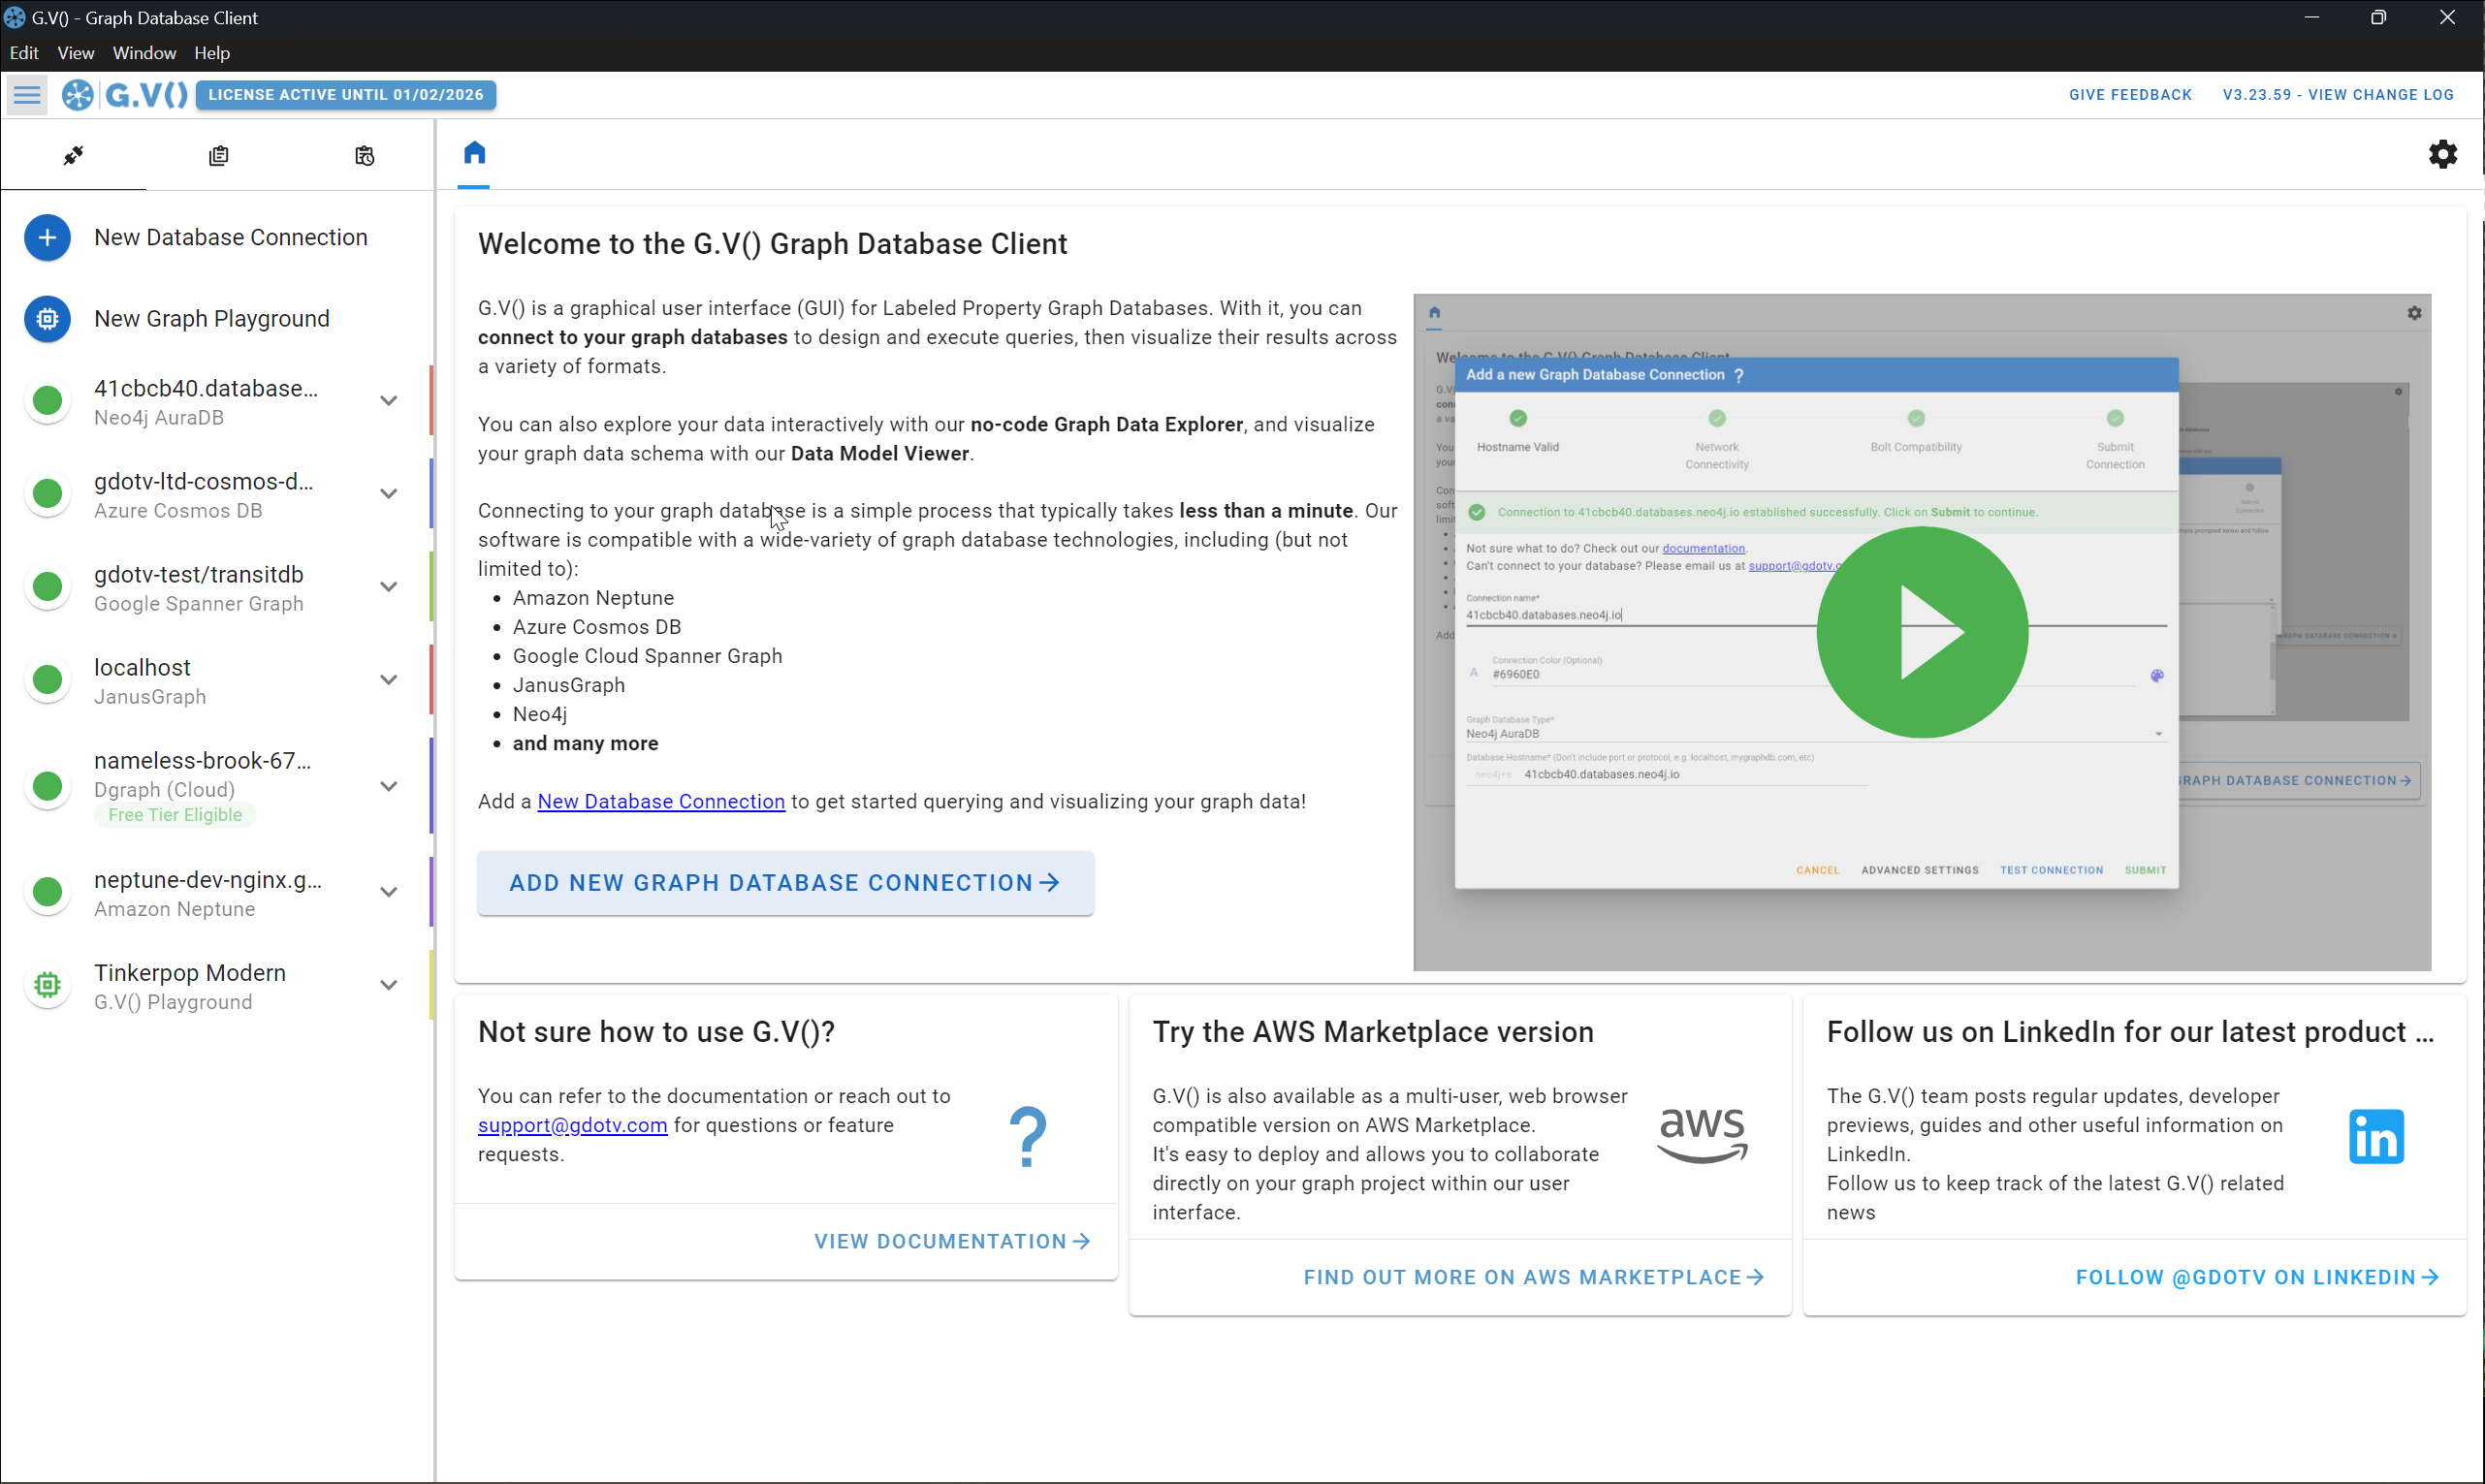
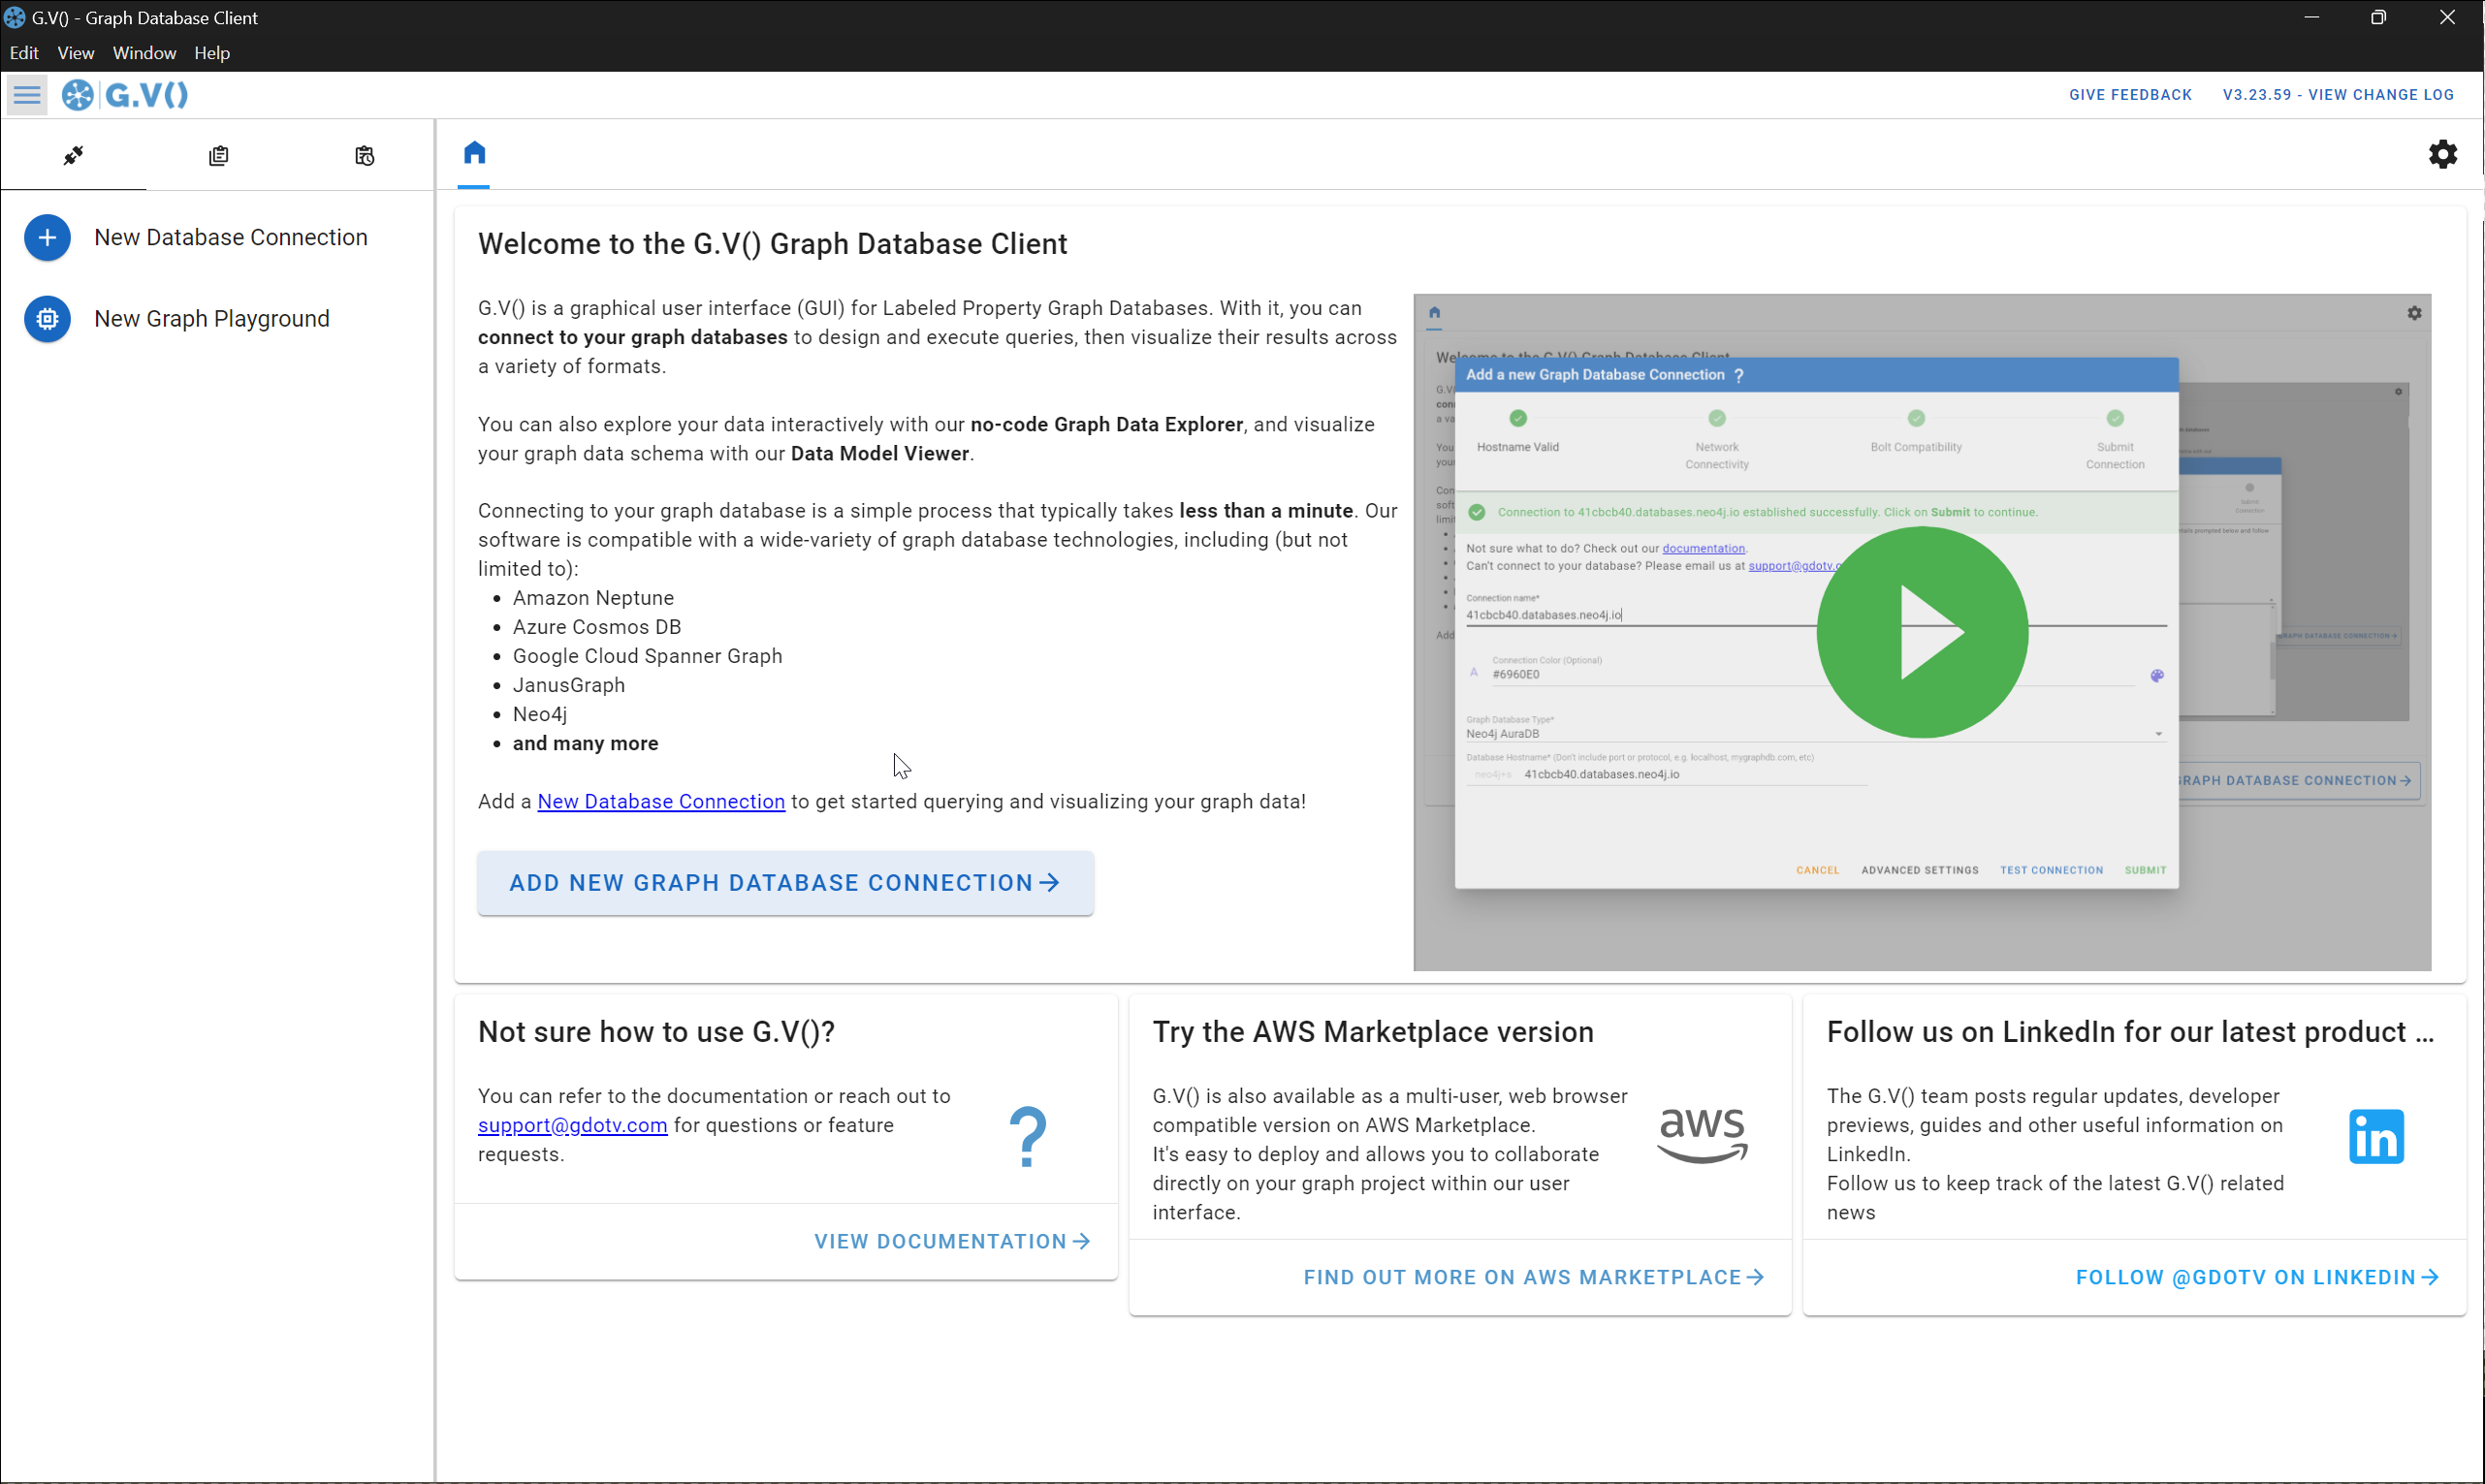
This release contains a few minor styles and UX improvements, such as a reworked desktop application startup screen and a new Welcome tab displaying more relevant and concise information.
We’re actively working on making the web version of G.V() available outside of AWS marketplace for self-service deployment, as well as integrating enterprise-grade Single Sign On (SSO) and user lifecycle management features.
We’ve also continuing on our journey to universal graph database compatibility and will continue to onboard new vendors to our tool, so you can work across all your graph databases directly from G.V(), with a consitent user experience and advanced features you simply won’t find in vendor native tools.
To see more details on our current and upcoming work, make sure to follow us on LinkedIn. If you haven’t tried G.V() yet, head over to our homepage to get started and remember – you can trial G.V() for free for up to 1-month as well as access our fully free version of graph databases with less than 500 vertices and 500 edges, without the need to sign up for a trial!
![The Weekly Edge: Knowledge Graphs at Netflix & Bloomberg, Graphs on Postgres, & Make Your Music SPARQL [9 January 2026] The Weekly Edge: Knowledge Graphs at Netflix & Bloomberg, Graphs on Postgres, & Make Your Music SPARQL [9 January 2026]](https://gdotv.com/wp-content/uploads/2026/01/graphs-postgres-janusgraph-cassandra-sparql-weekly-edge-9-january-2026.png)

