G.V() is now Compatible with Kuzu, the Embedded Graph Database
Introduction
We’re unveiling support for Kuzu, the embeddable graph database, on G.V(). We’ve been working with the Kuzu team over the last few weeks to create this seamless integration for graph database users.
Kuzu is free and open-source, and uses the Cypher query language. It uses columnar storage combined with novel join algorithms to provide extremely fast performance and high scalability.
With this integration, Kuzu users can now benefit from a feature-rich graph visualization and Cypher writing suite of tools to simplify their day-to-day development and data analysis tasks. But that’s not all we’ve got to offer, let’s take a closer look:
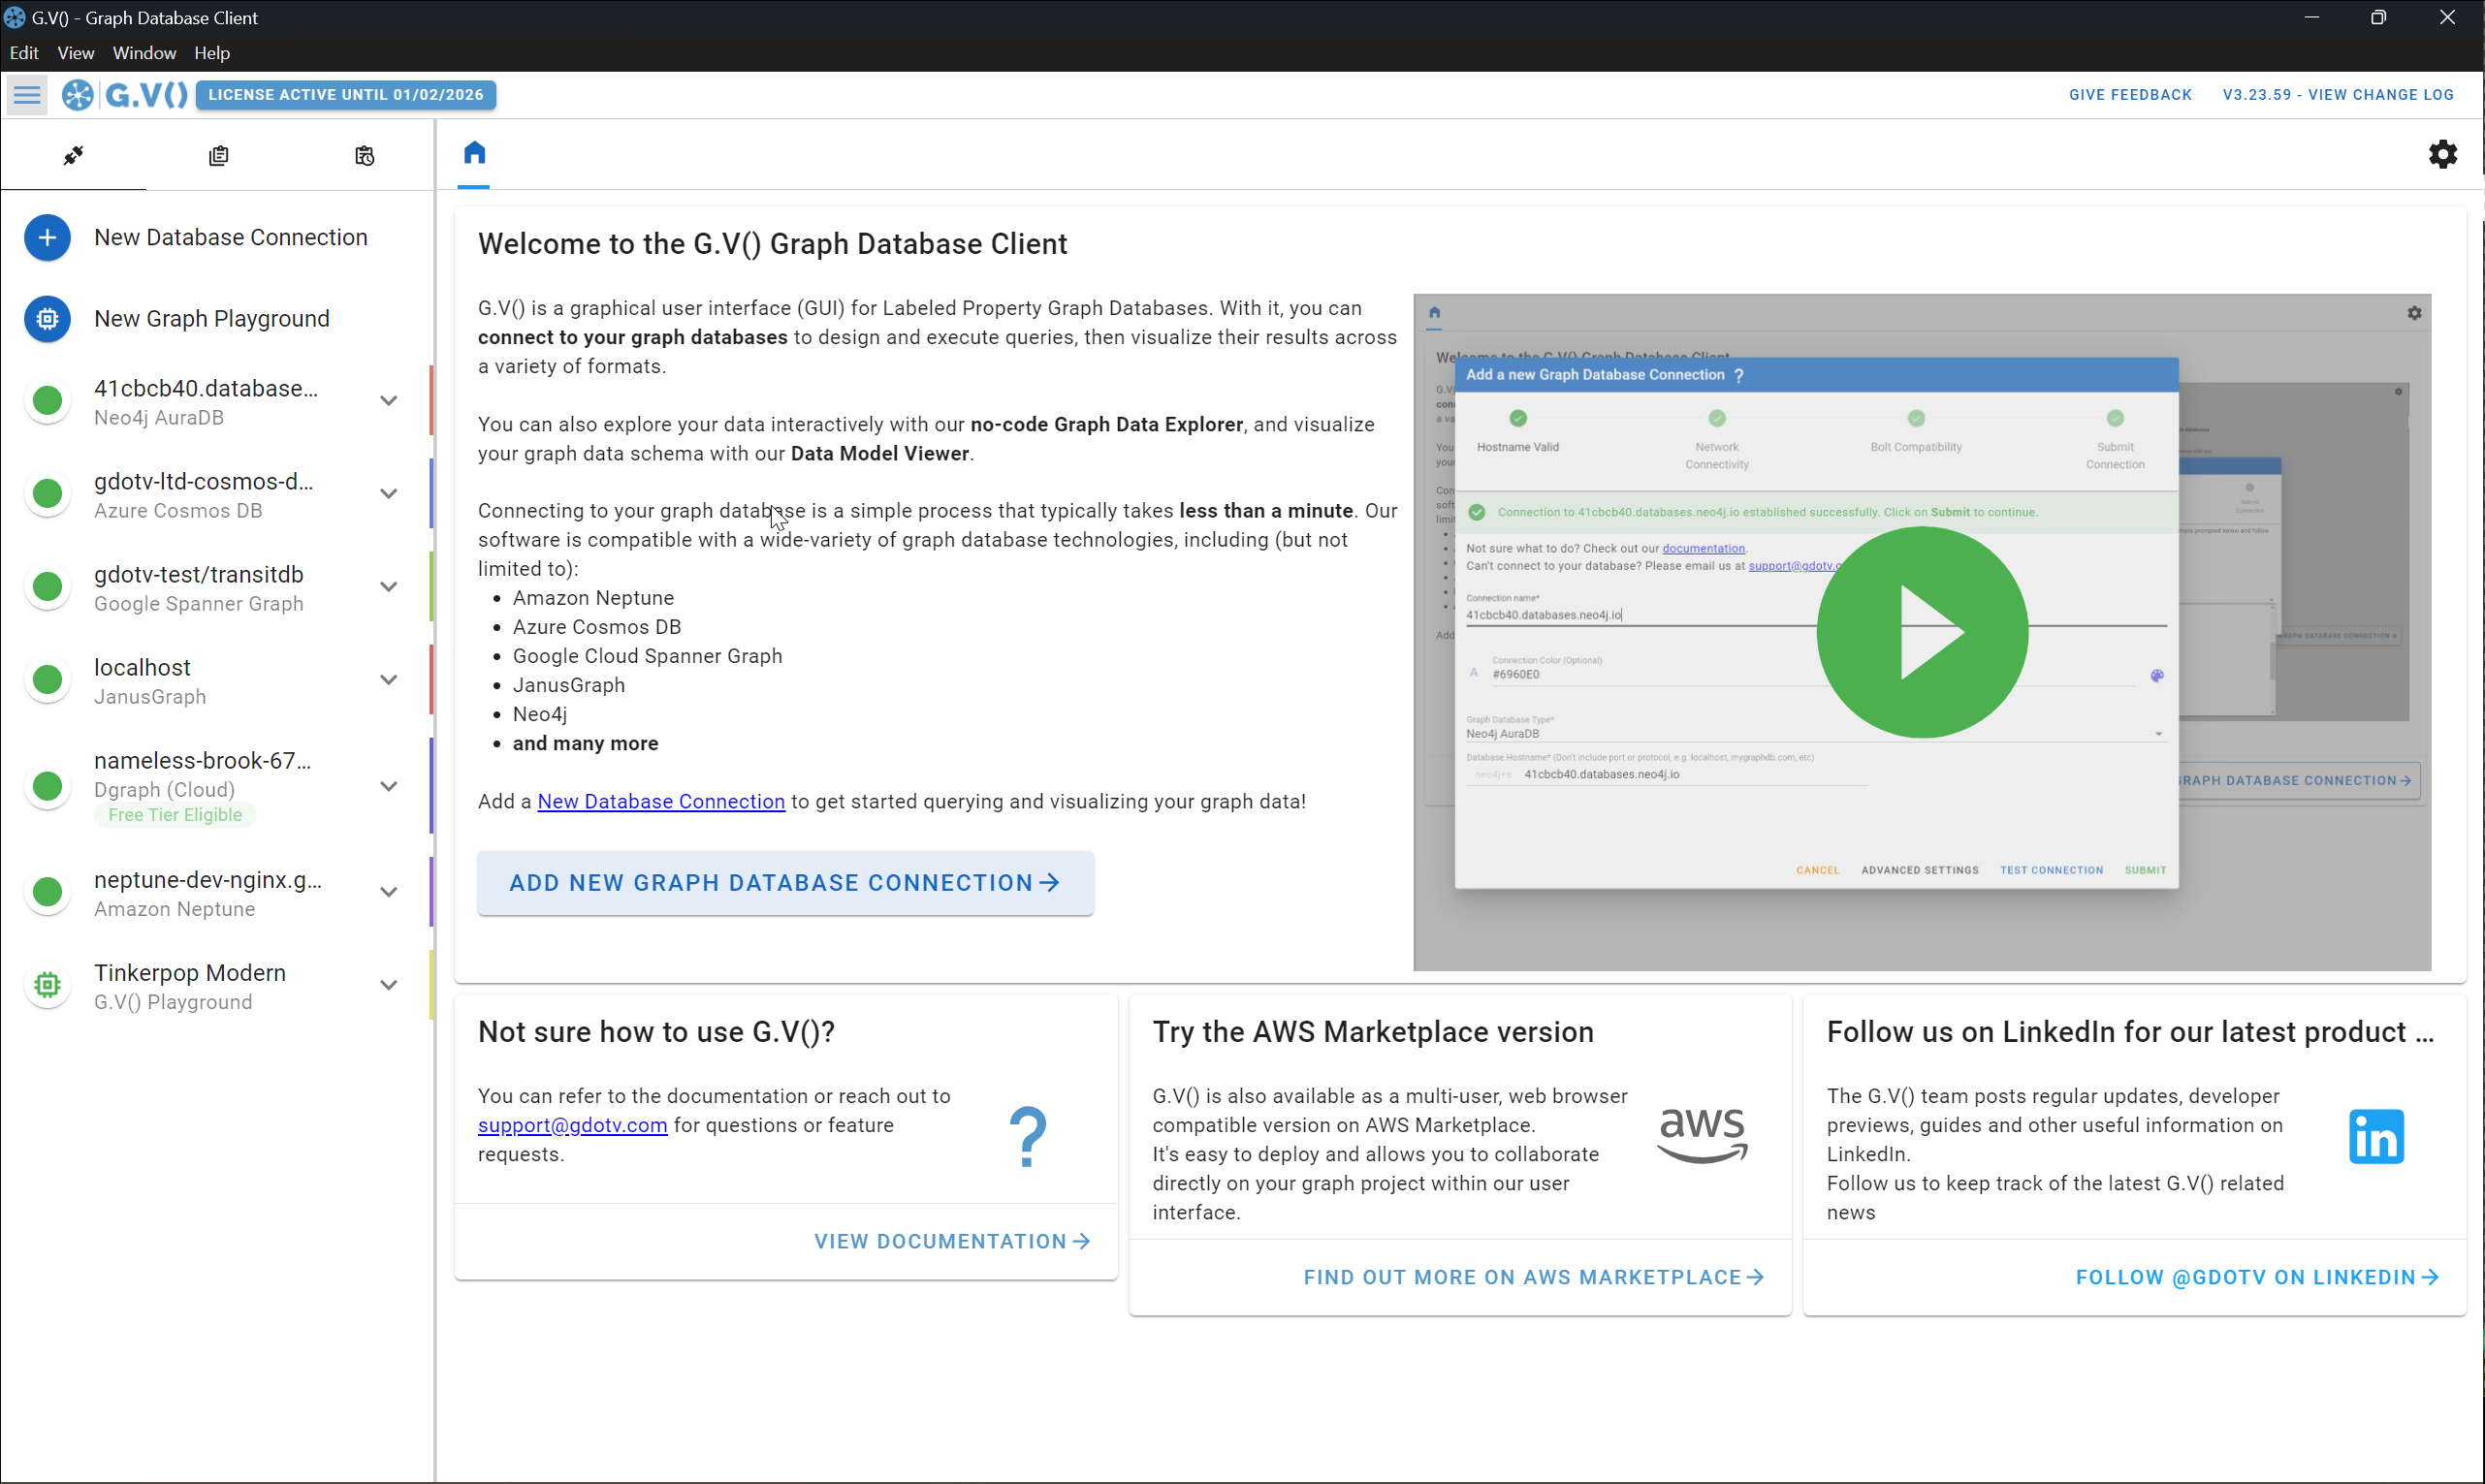
Get setup with G.V() less than a minute
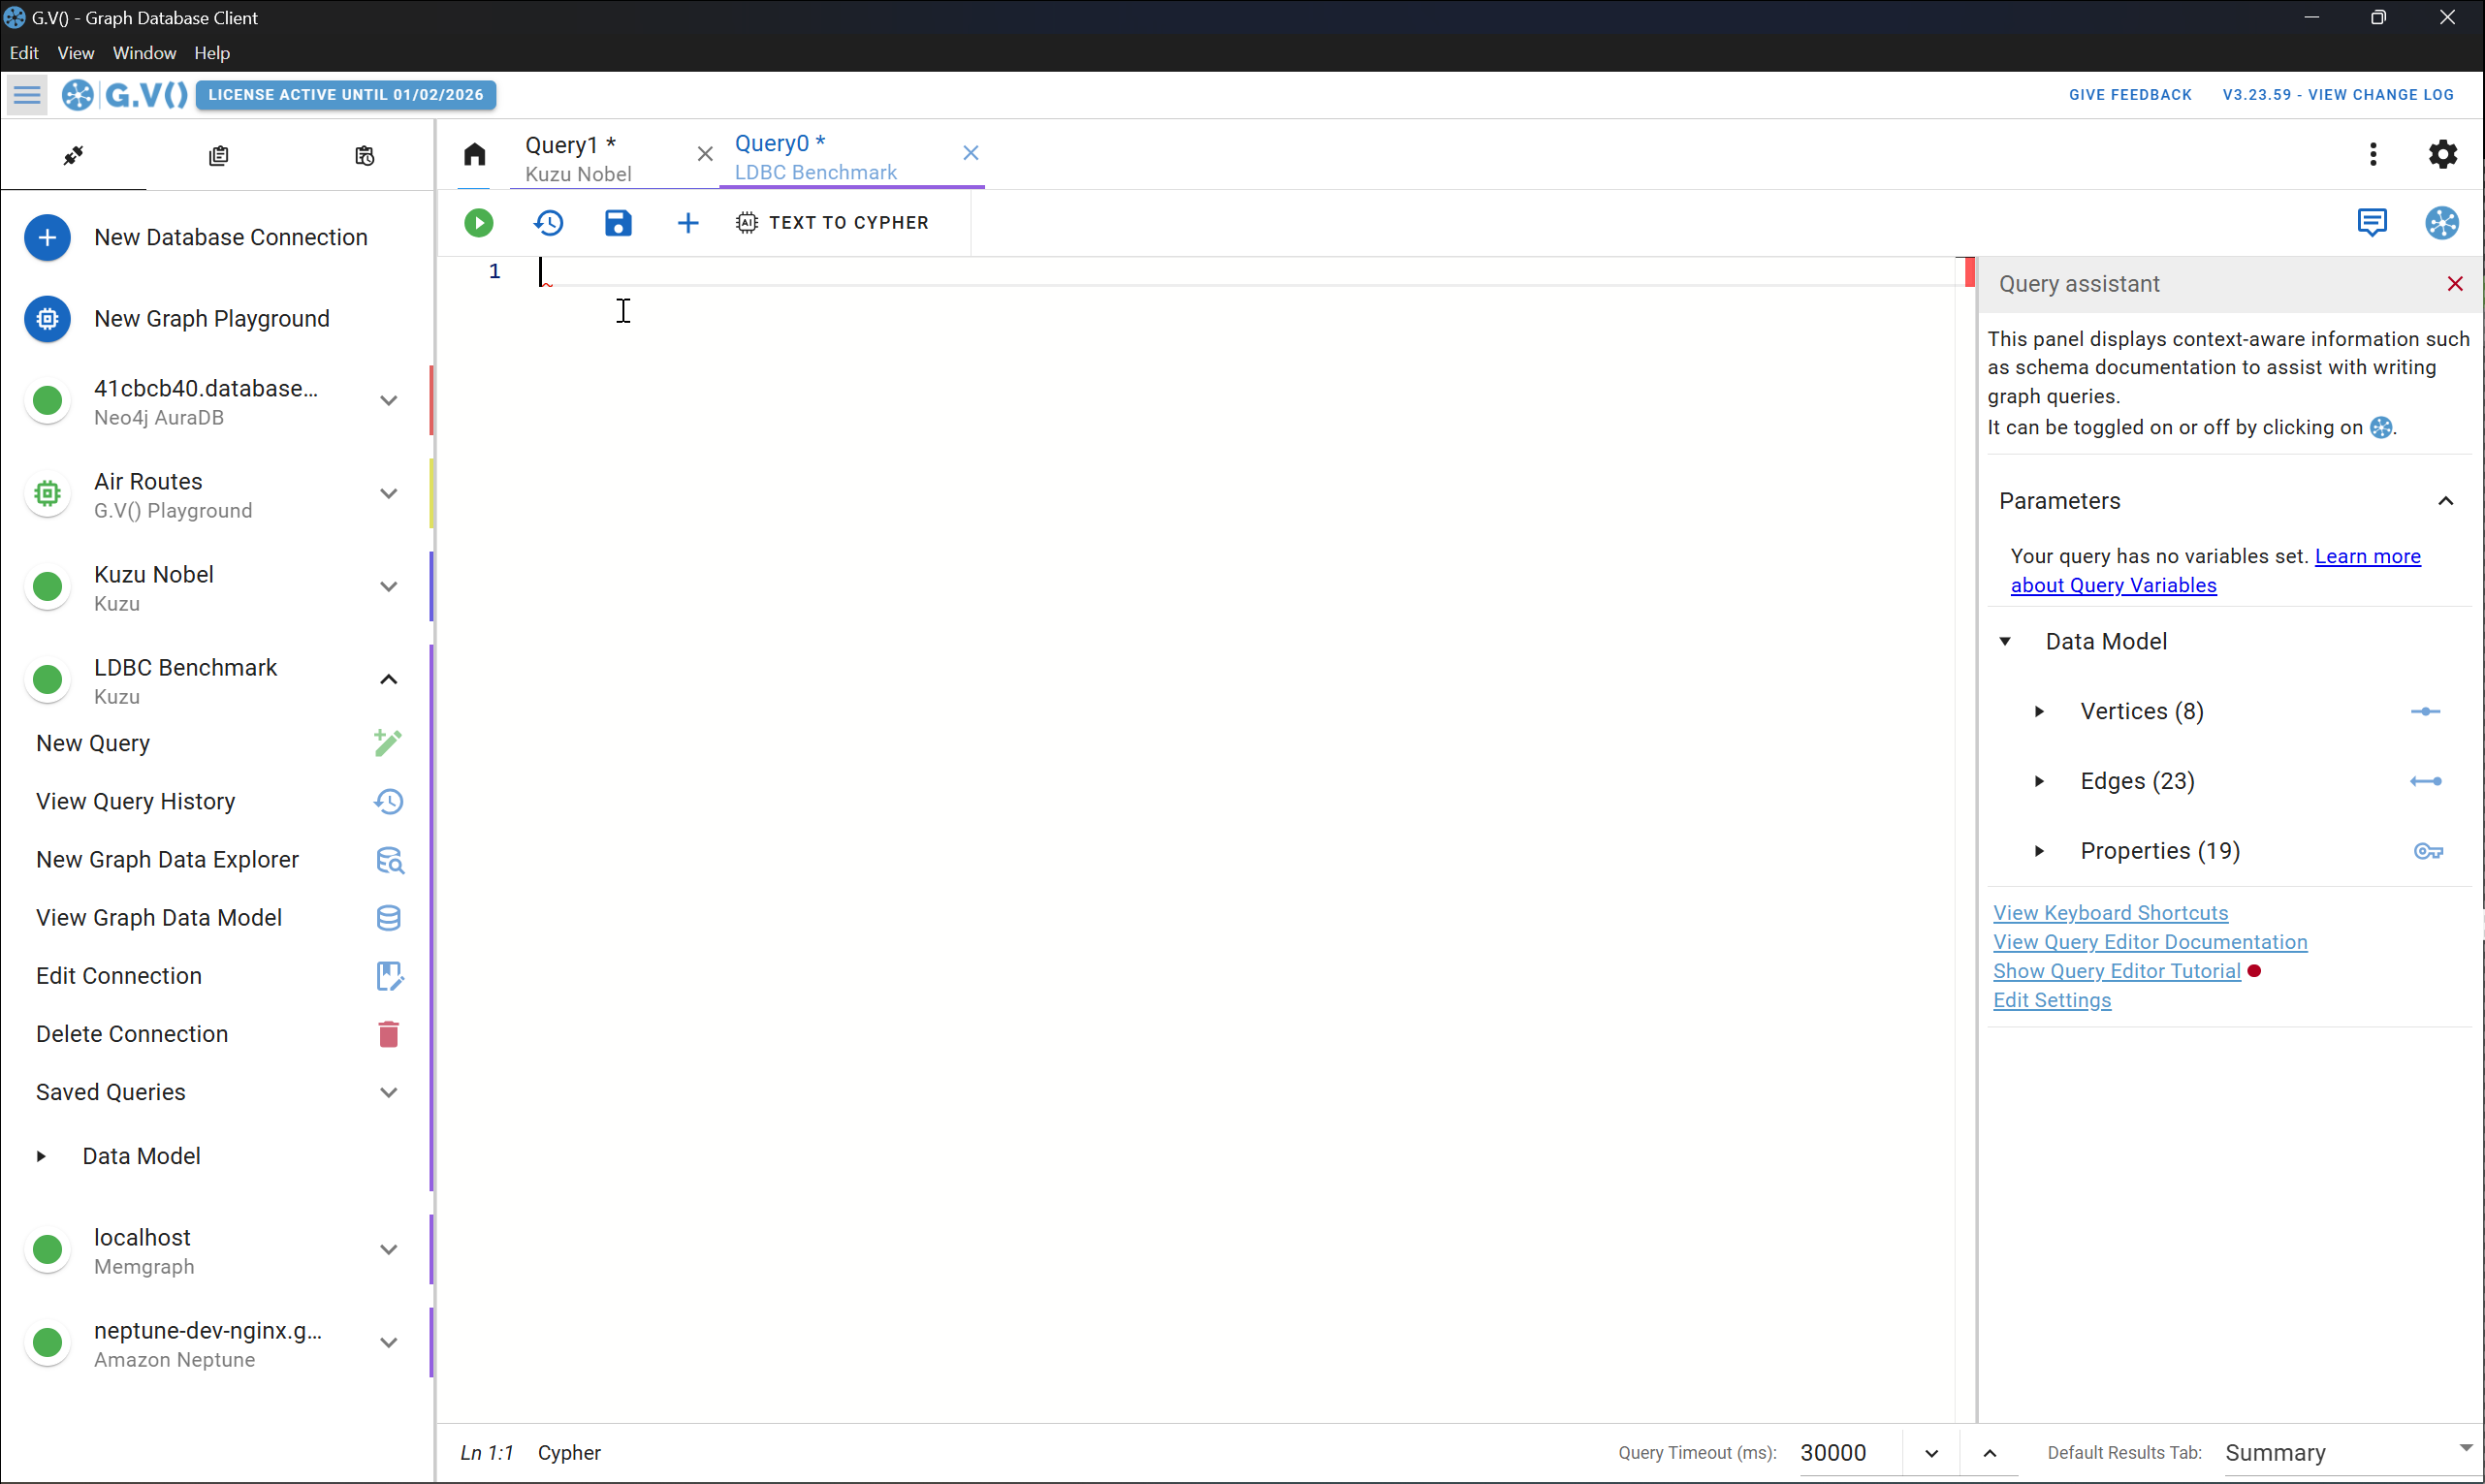
Cypher query writing made easy with our query editor
- Cypher syntax validation
- Autocomplete suggestions based on your graph data schema
- Embedded schema documentation so you can immediately identify the relevant labels and property keys for your nodes & edges
- Procedure autocomplete
- Query parameter support
With G.V(), you can also save and organise your queries into folders, and create parameterised reports that can be easily re-run to get straight to extracting insights from your data.
Centrally manage and query your Kuzu instances
Unlike most traditional graph visualization tools, G.V() allows you to work concurrently across multiple graph databases. This effectively means that you can interact with all your Kuzu instances from the one installation or deployment of G.V(), without the need to constantly switch between databases.
Our query editor, data model viewer and graph explorer are all organised into tabs that you can seamlessly switch between – gone are the days of having to manage multiple database tooling deployments to work across all of them.
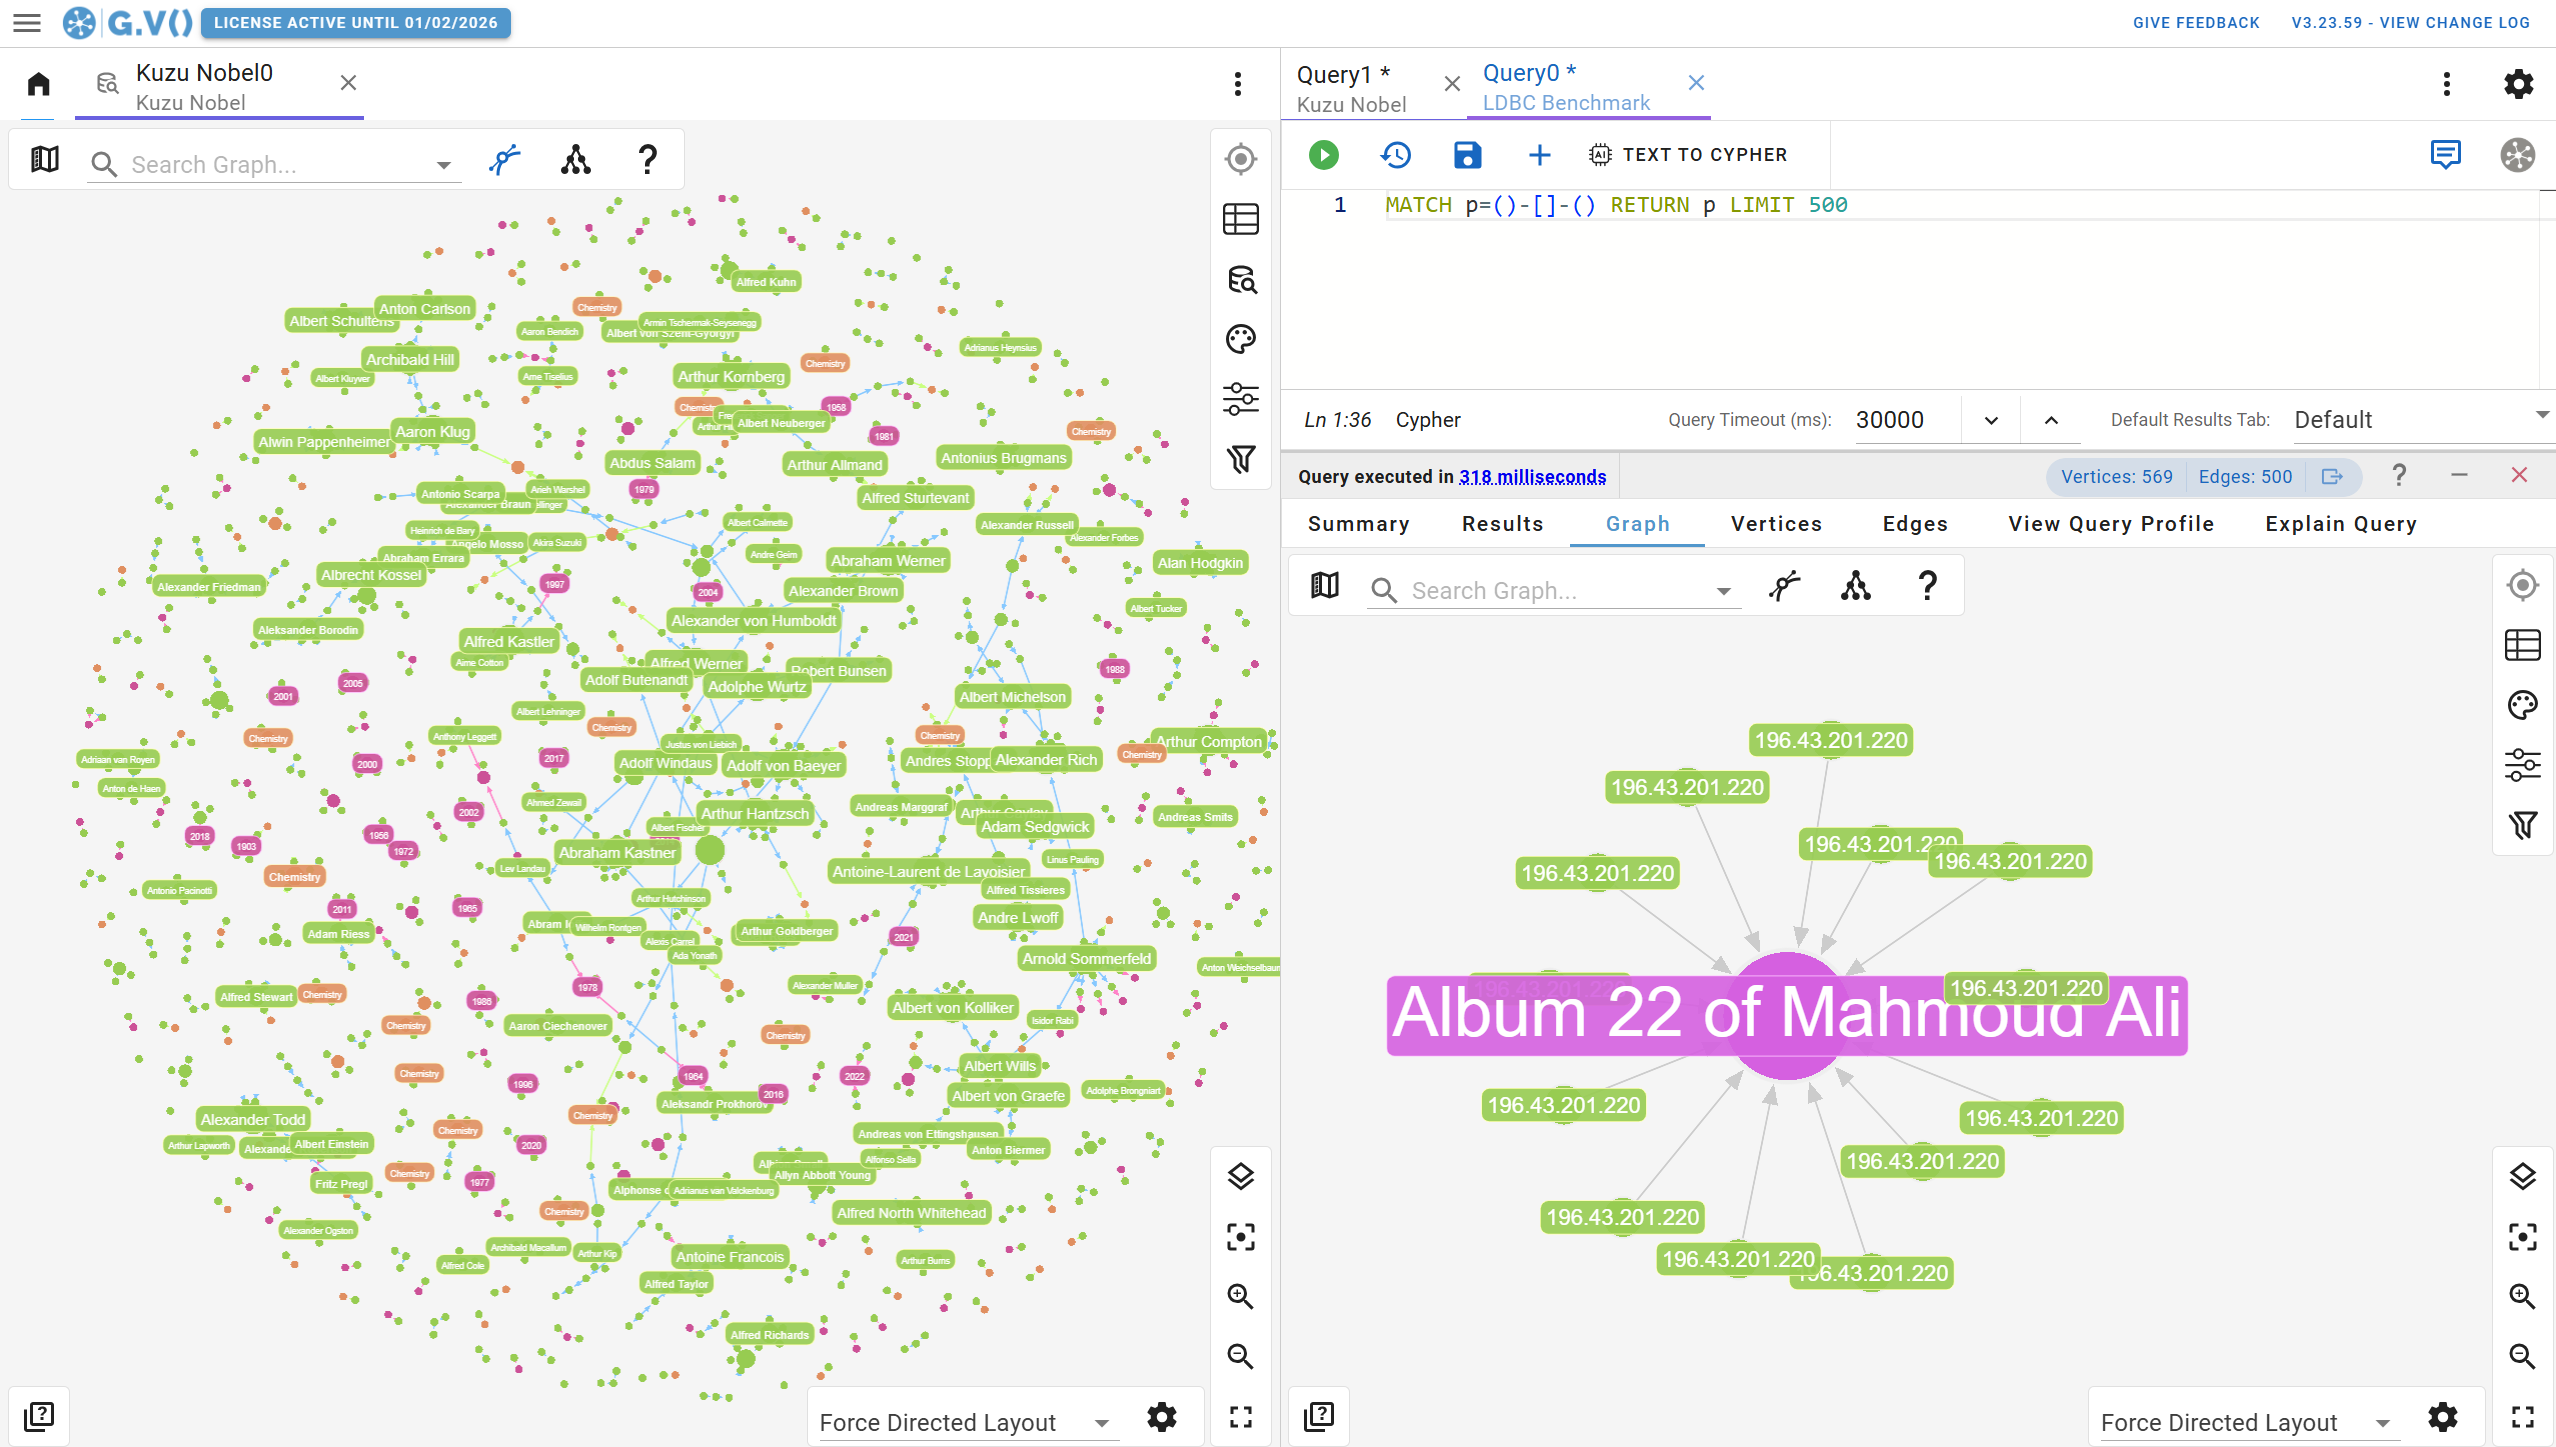
Visualize and explore large graphs with ease
G.V() turns graph data to graph visualizations directly from your Cypher query results – simply return graph elements and we’ll do the rest.
We offer highly interactive visualization options that match the structure of your Cypher results data (graph, tabular, plain, etc).
To give you a better idea of what this looks like, check out the sample data visualization outputs below:
- Graph visualization, best suited for visual analysis and demonstration purposes, with a wealth of customization options
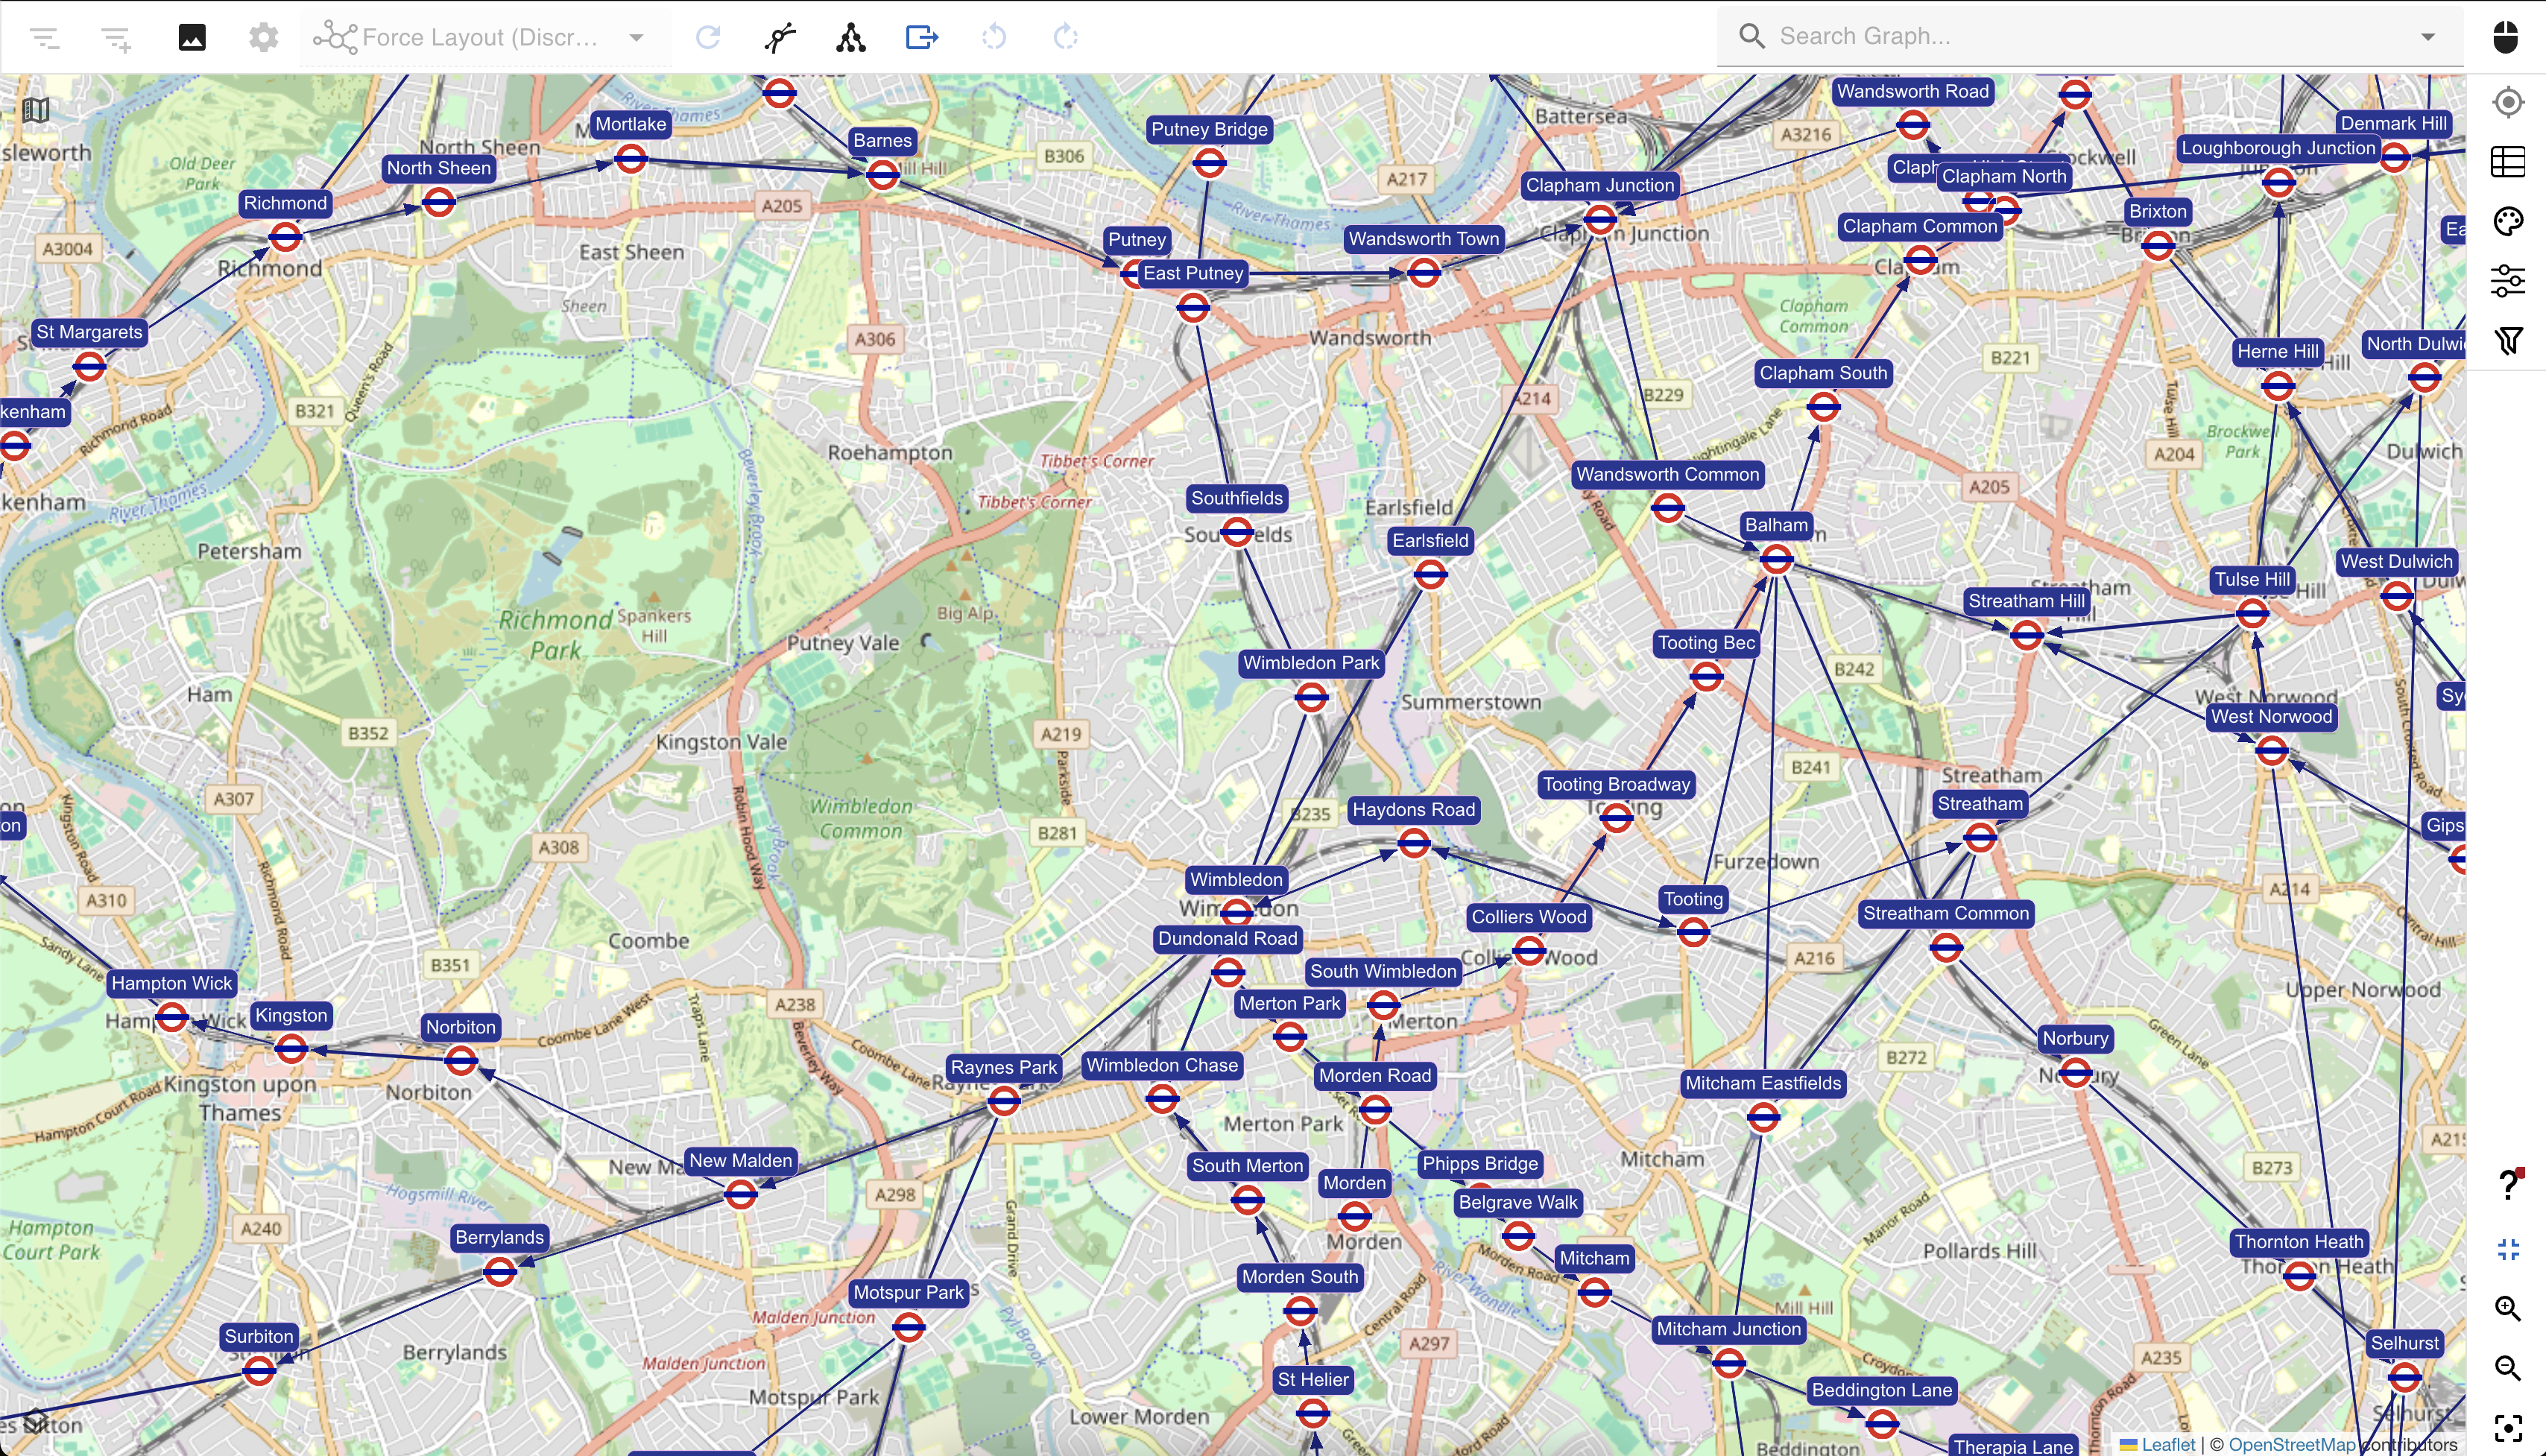
- Map underlay on graph visualization for geographical data plotting
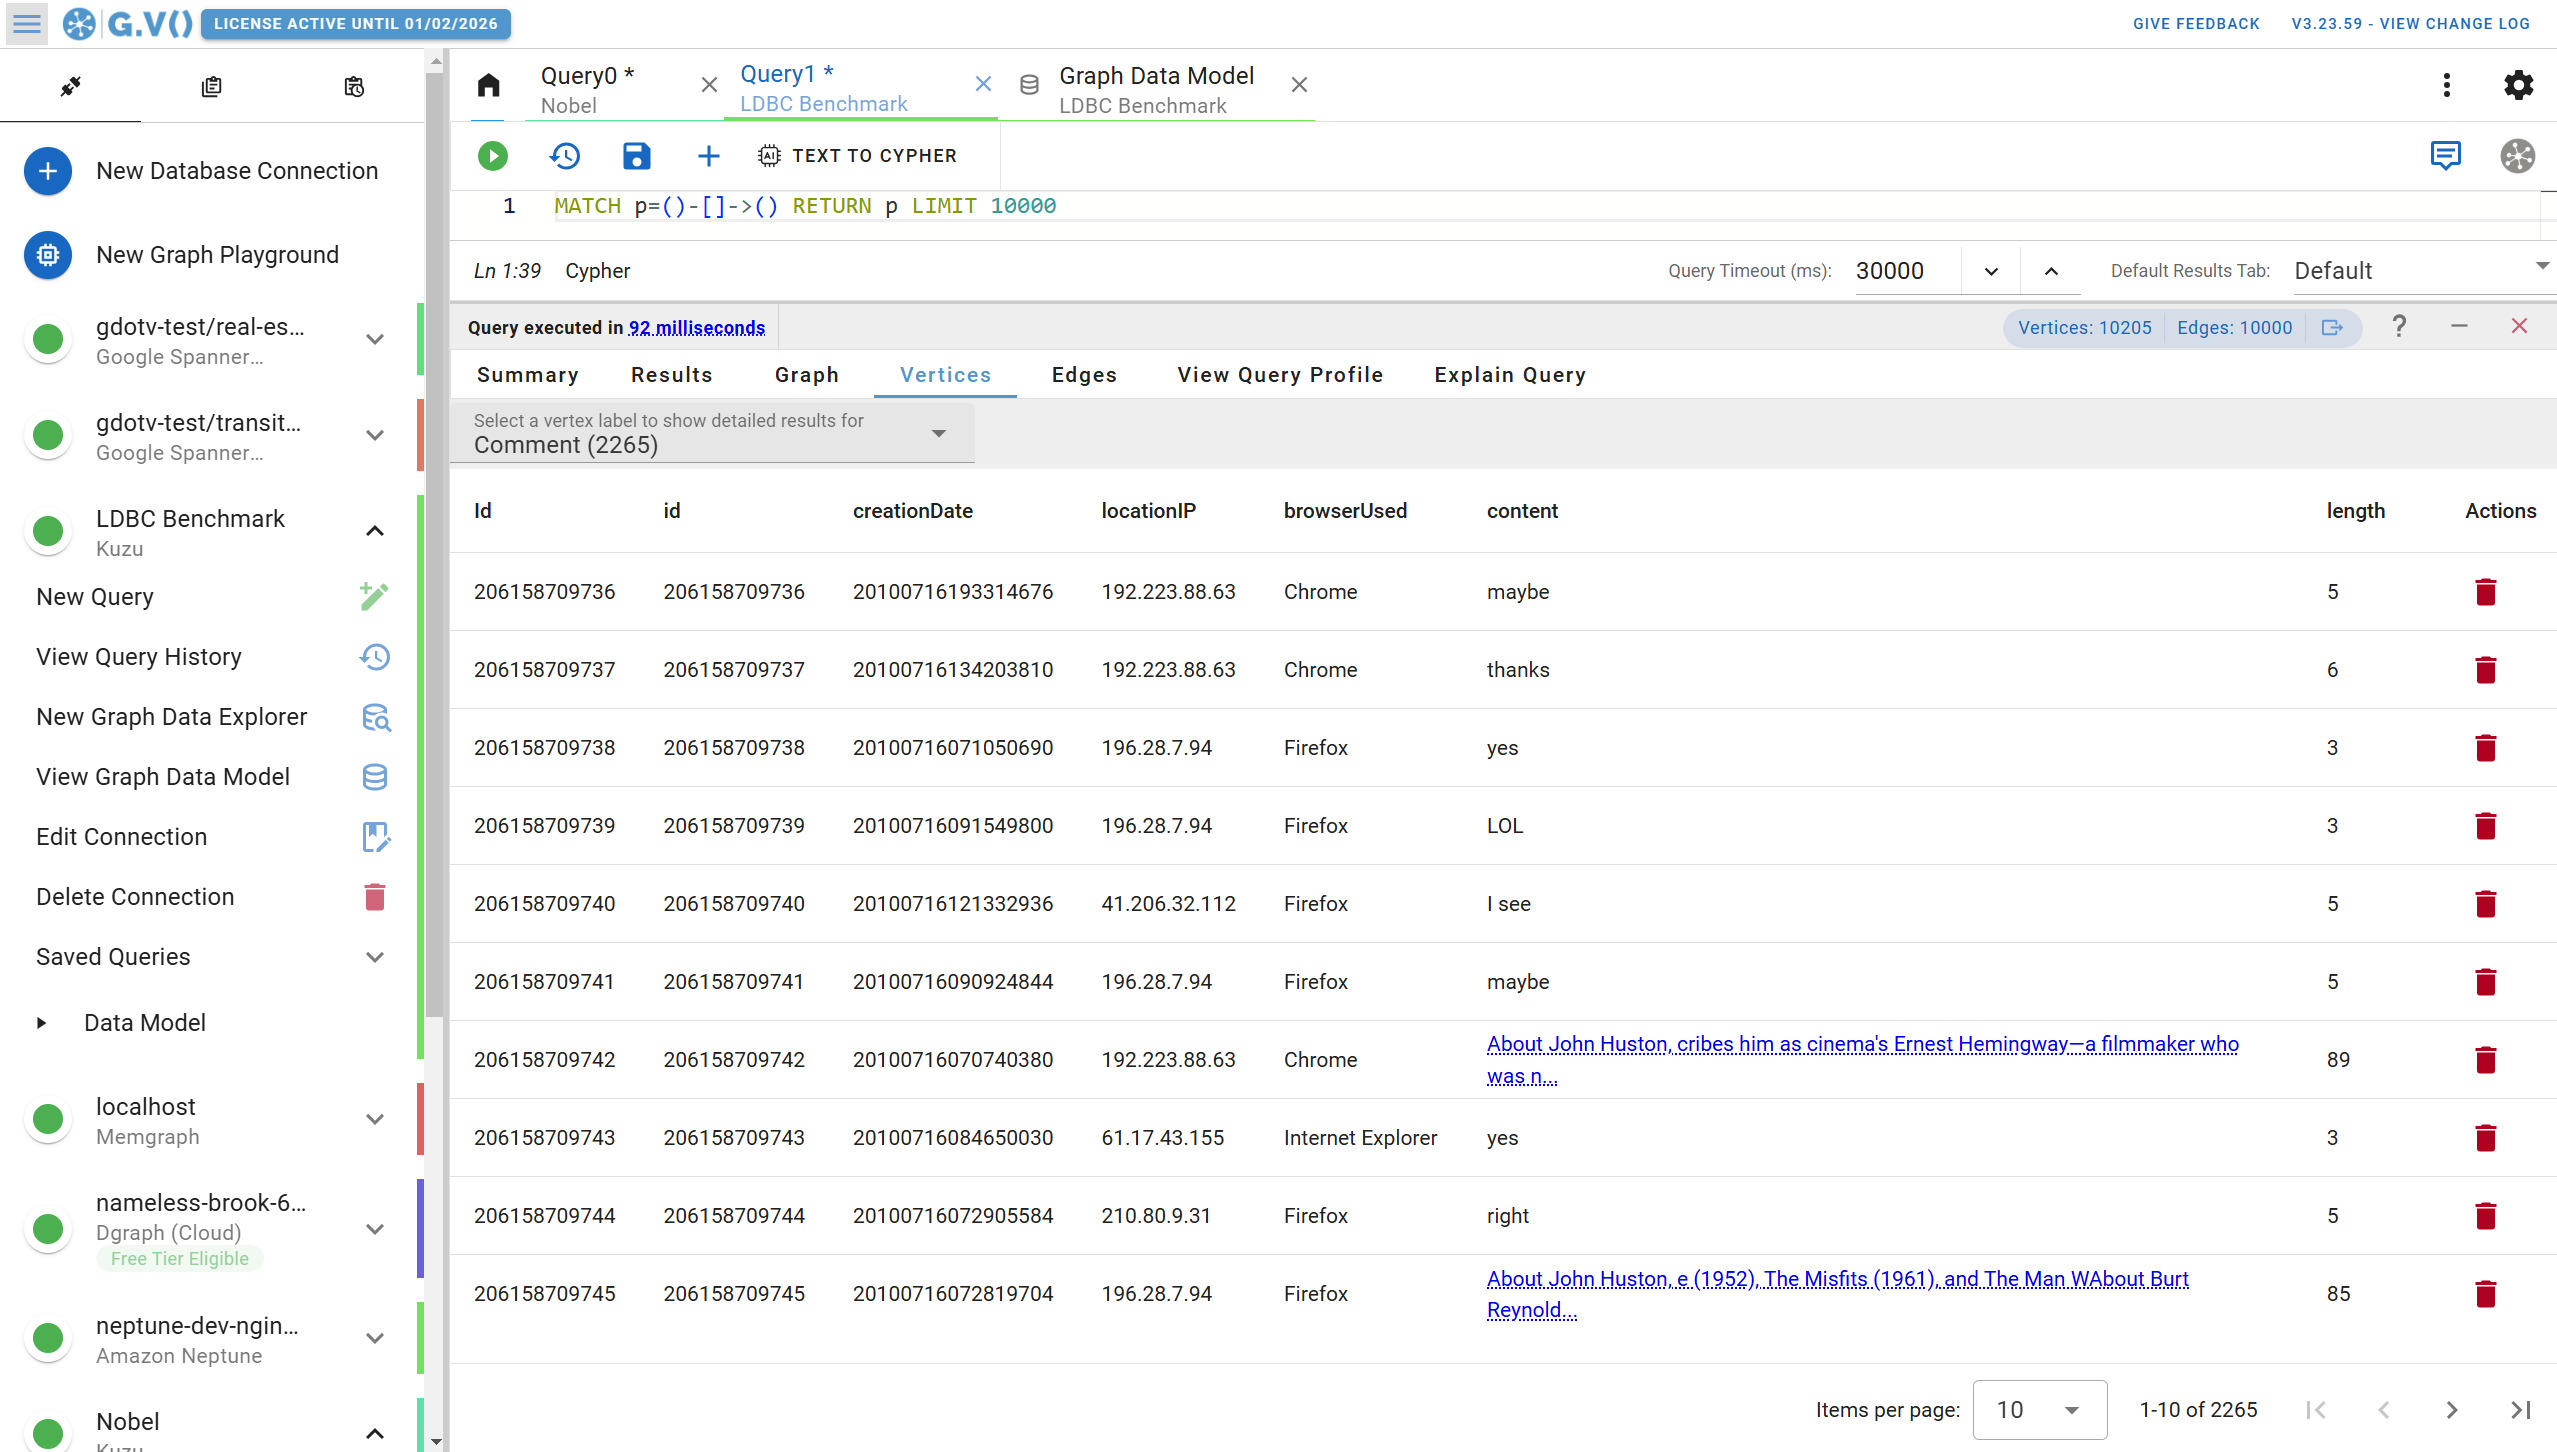
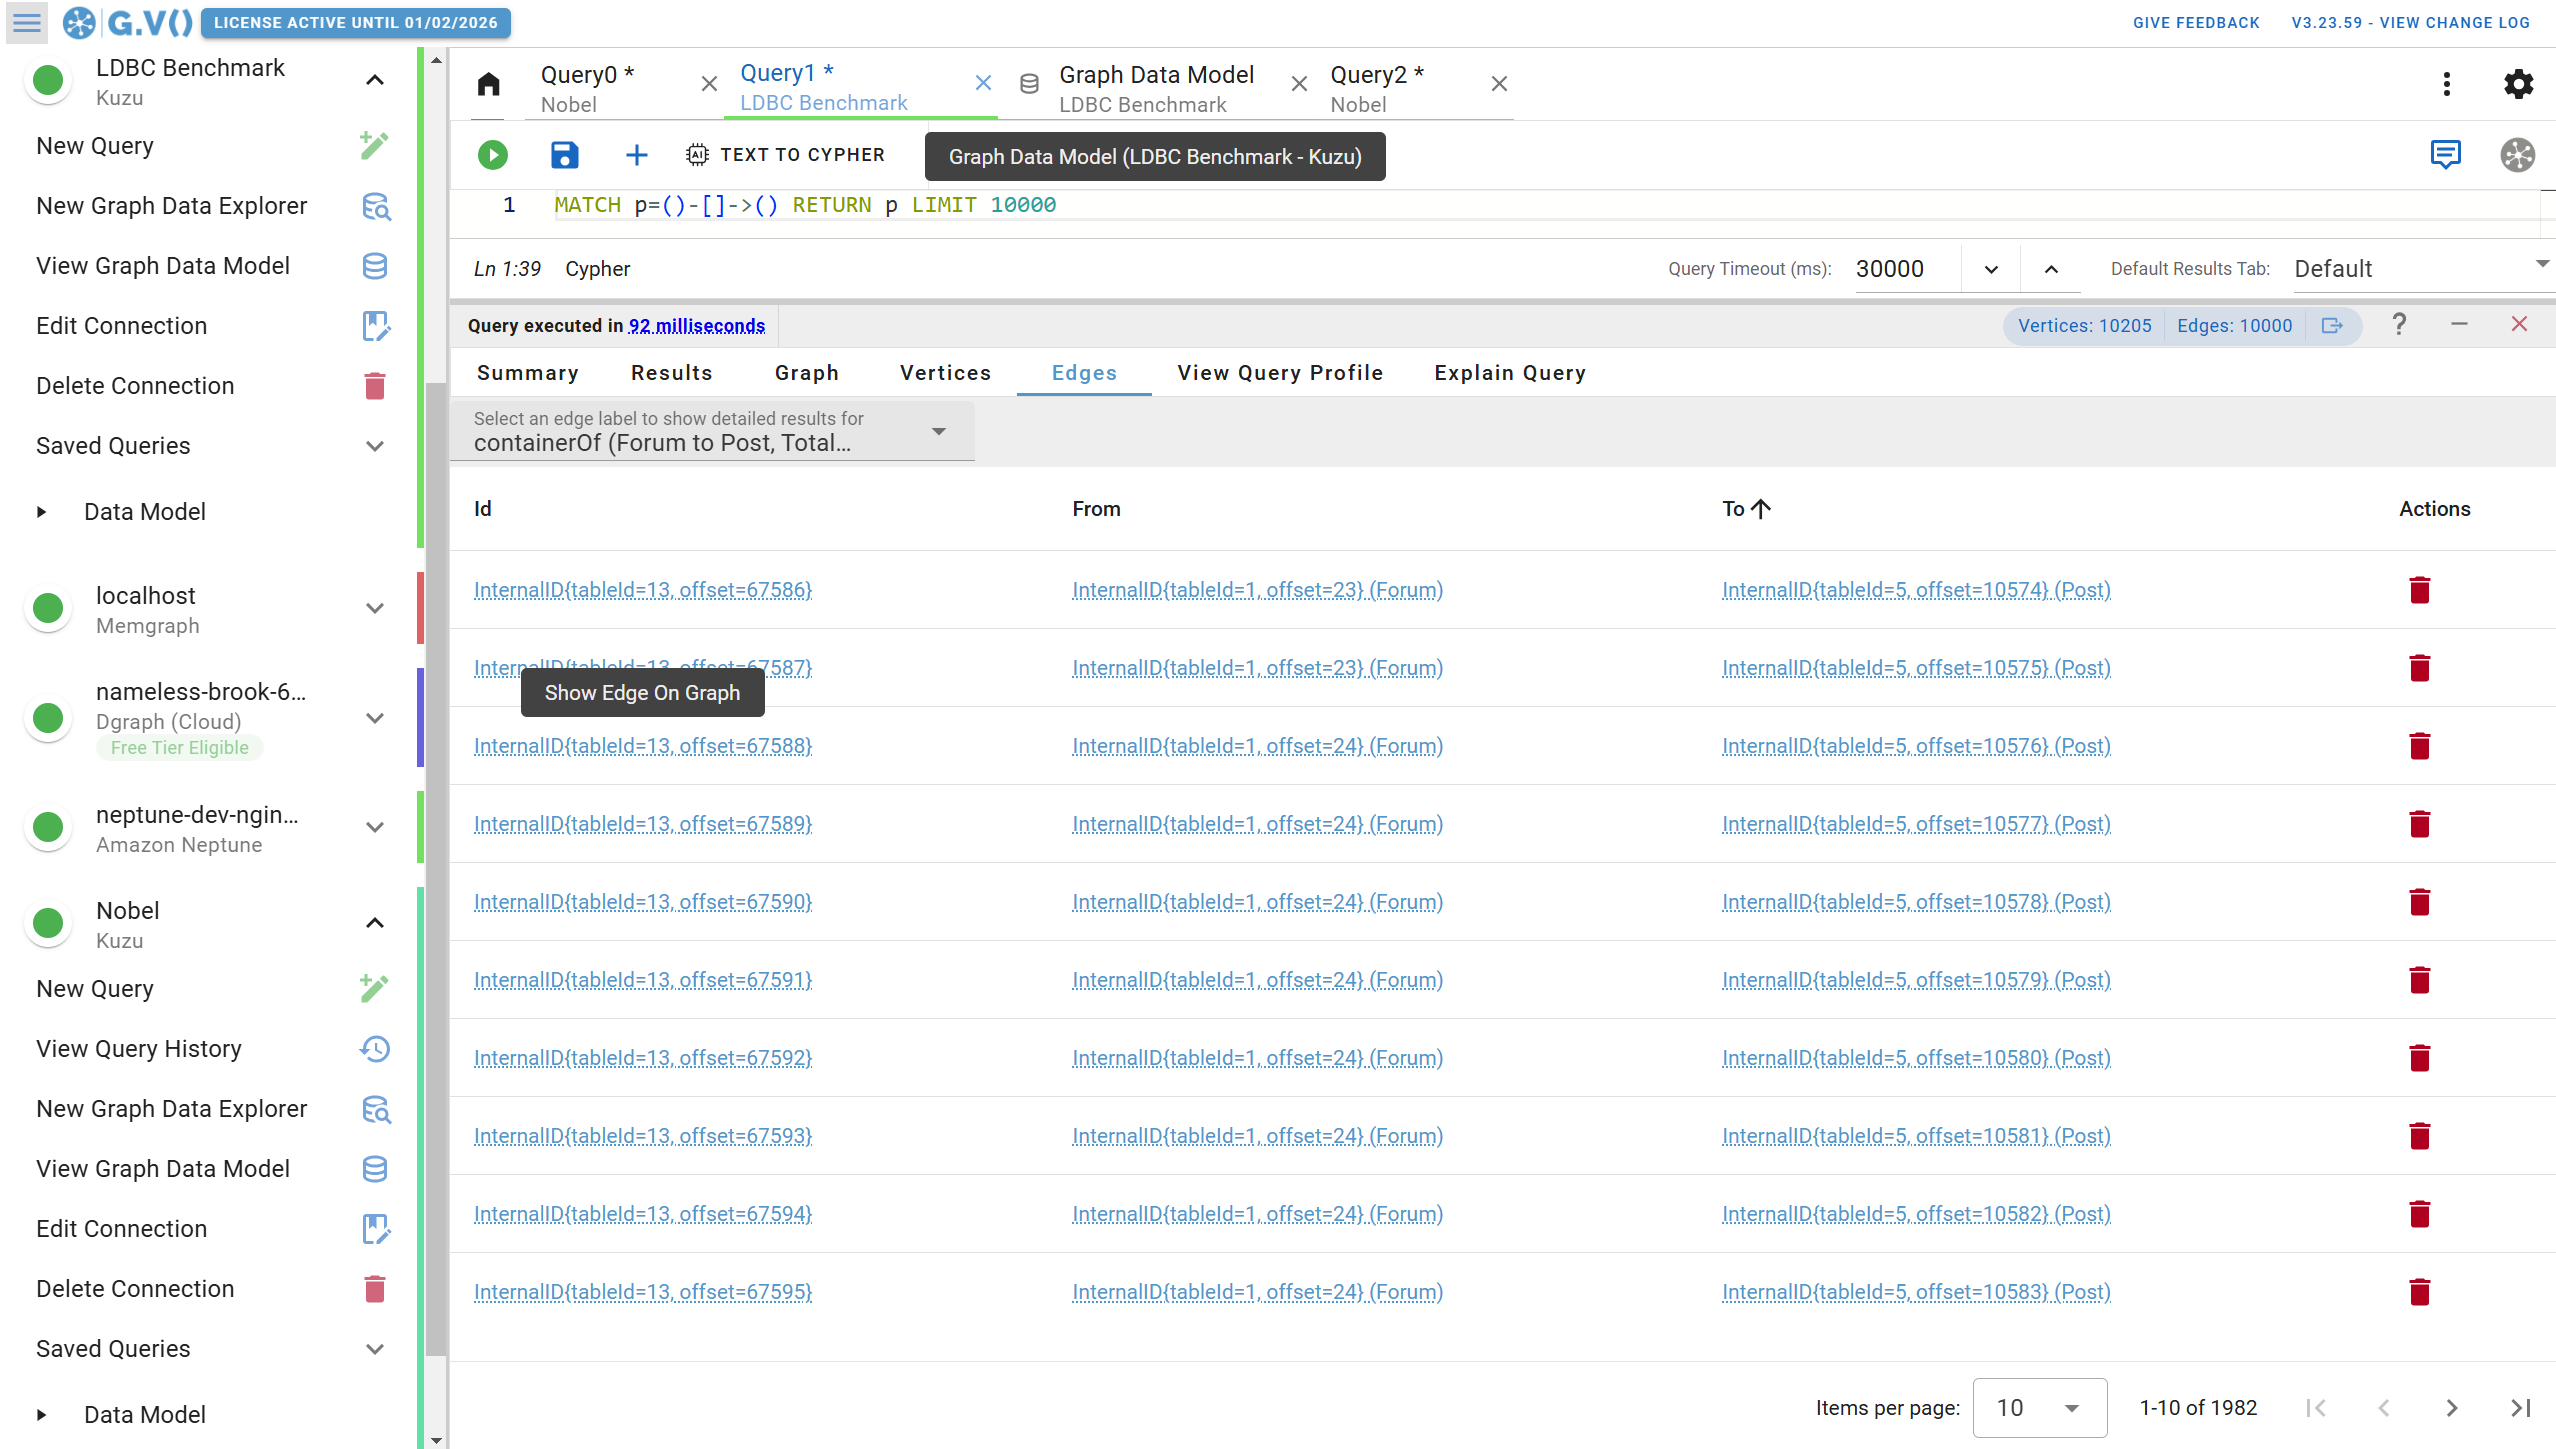
- Table view for nodes and edges when you simply need data organized in rows to rapidly compare
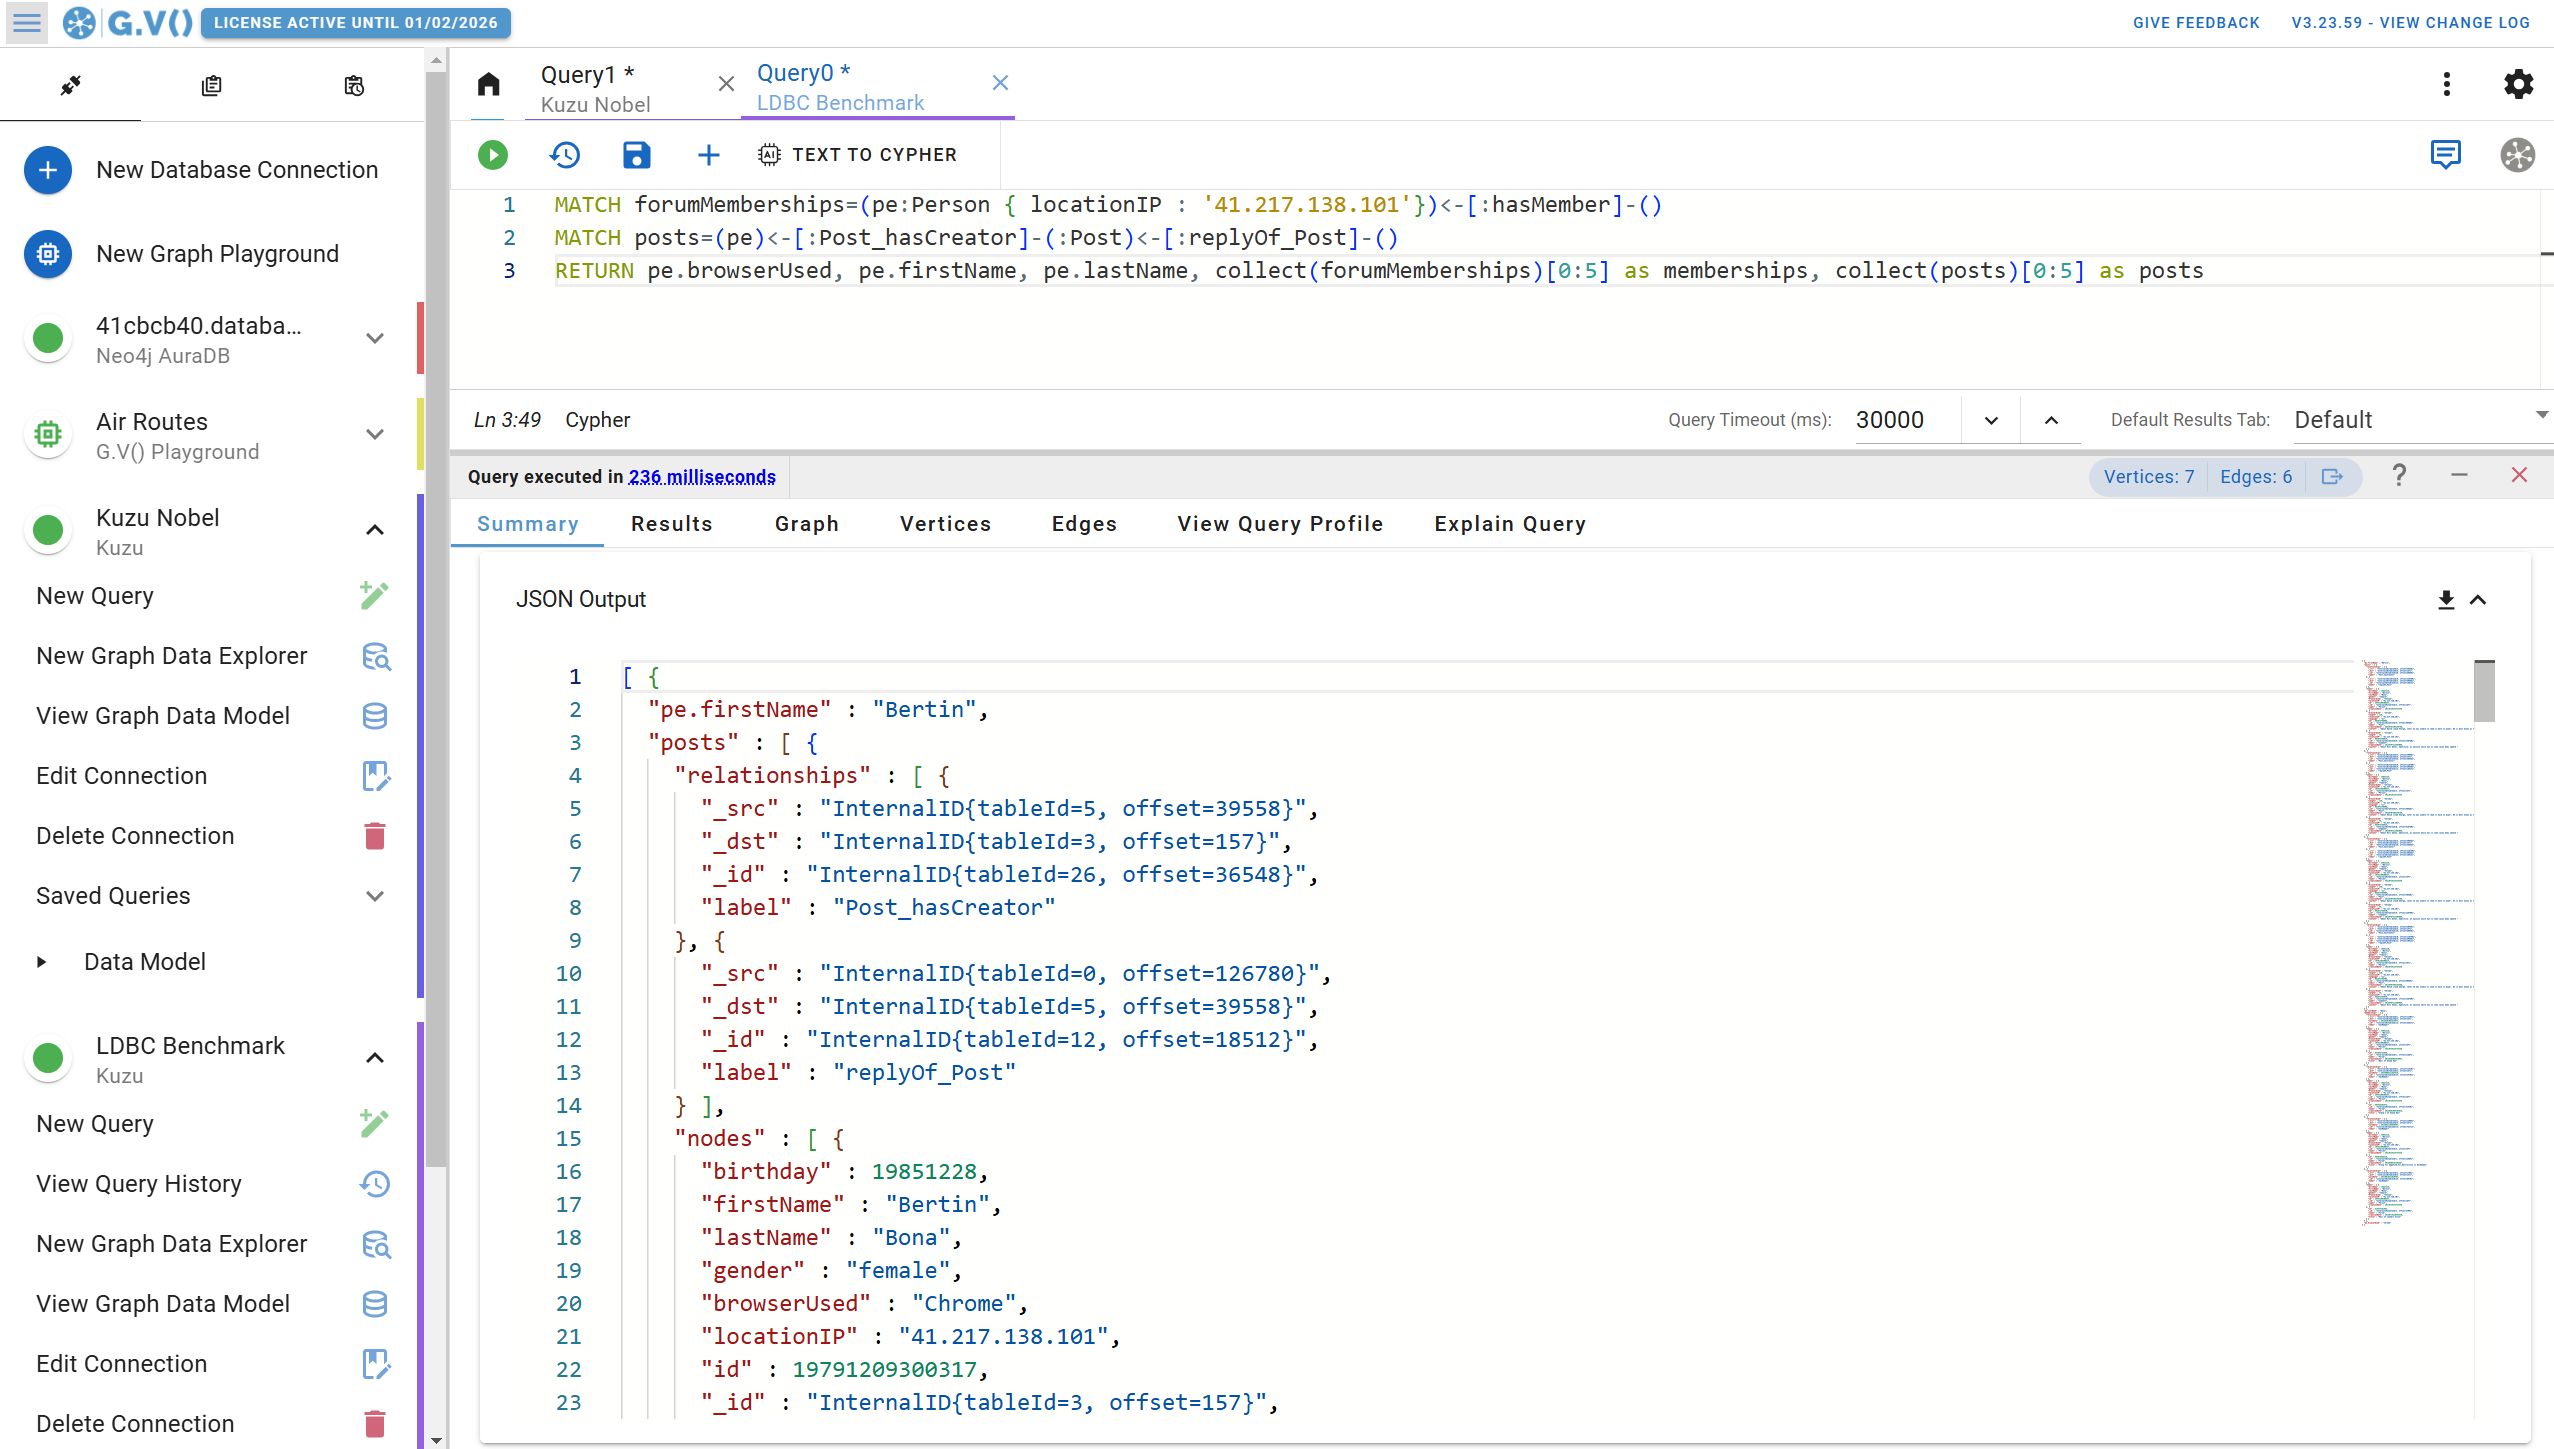
- JSON data format when all you need is a developer friendly output to extract and use elsewhere
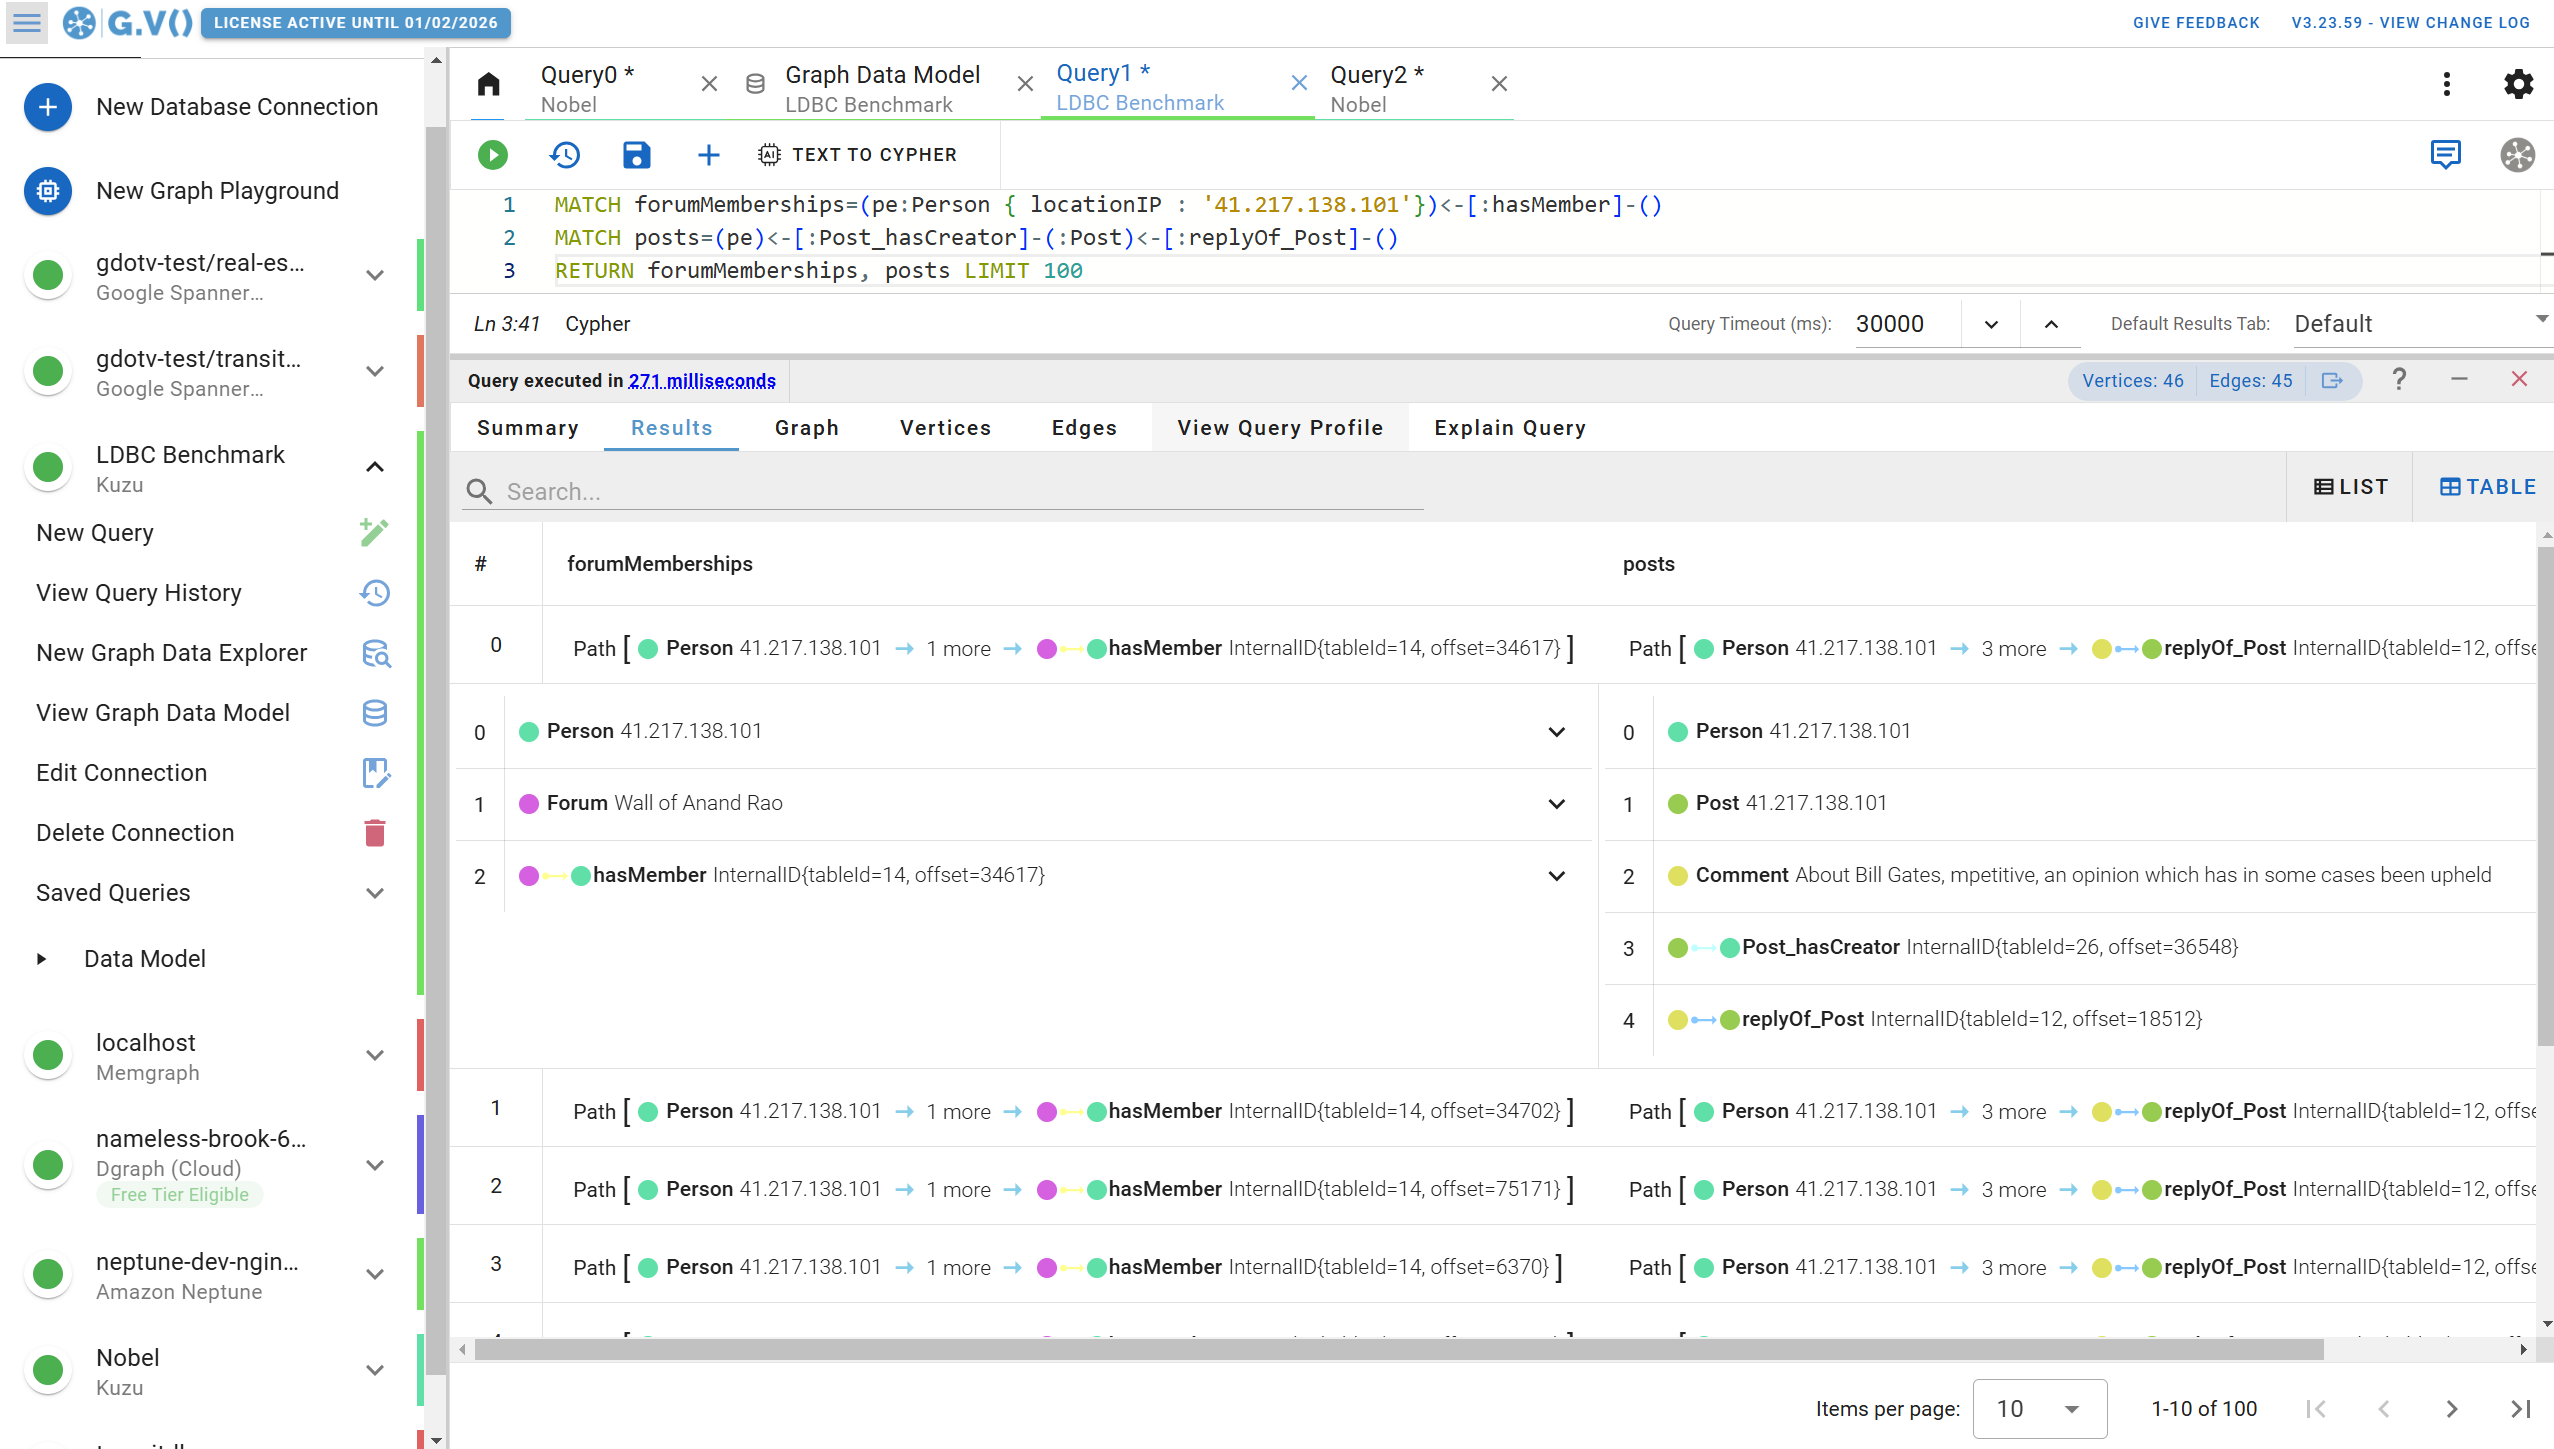
- Object browser to navigate your data based on its hierarchical structure, best suited for complex aggregations of information
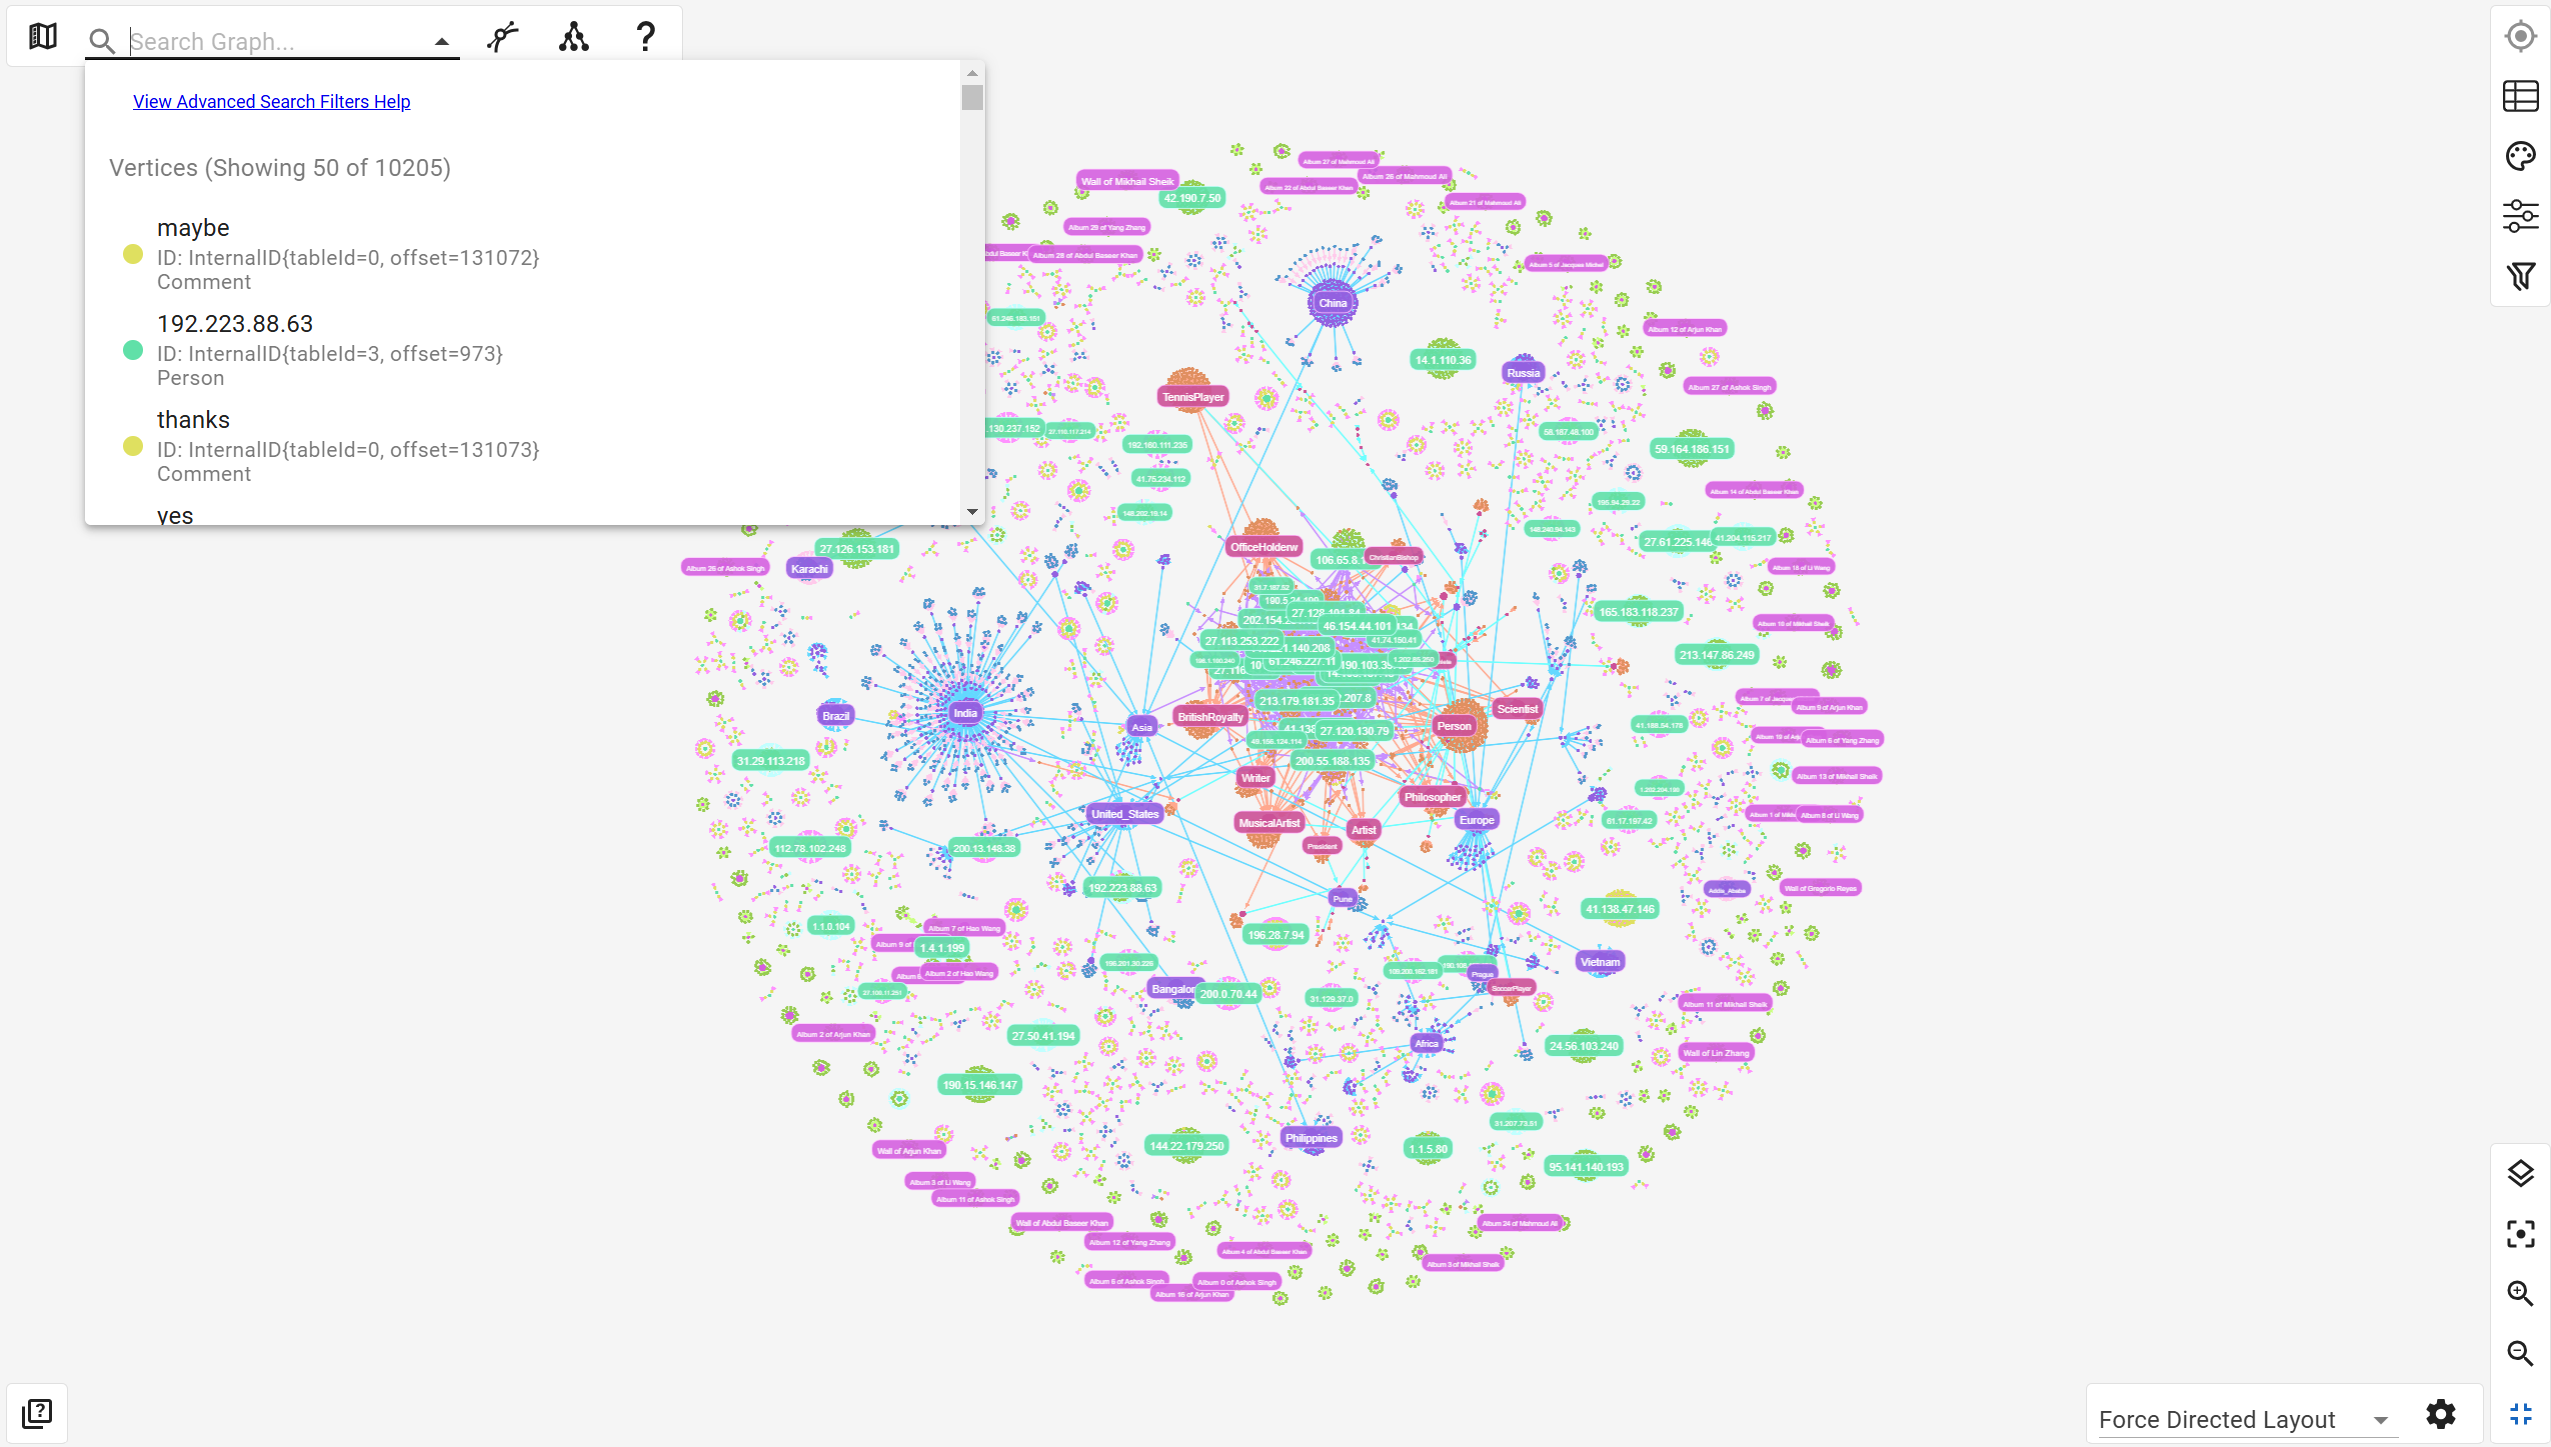
No-code exploration of your Kuzu Graph Database
G.V() has a lot to offer data professionals, but non-technical users can also use the no-code Data Explorer features to easily explore and interact with their Kuzu datasets.
With just a few clicks and flexible data filters, there’s a lot you can do to sift through, sort, and analyze your connected data. No graph expertise or query writing required.
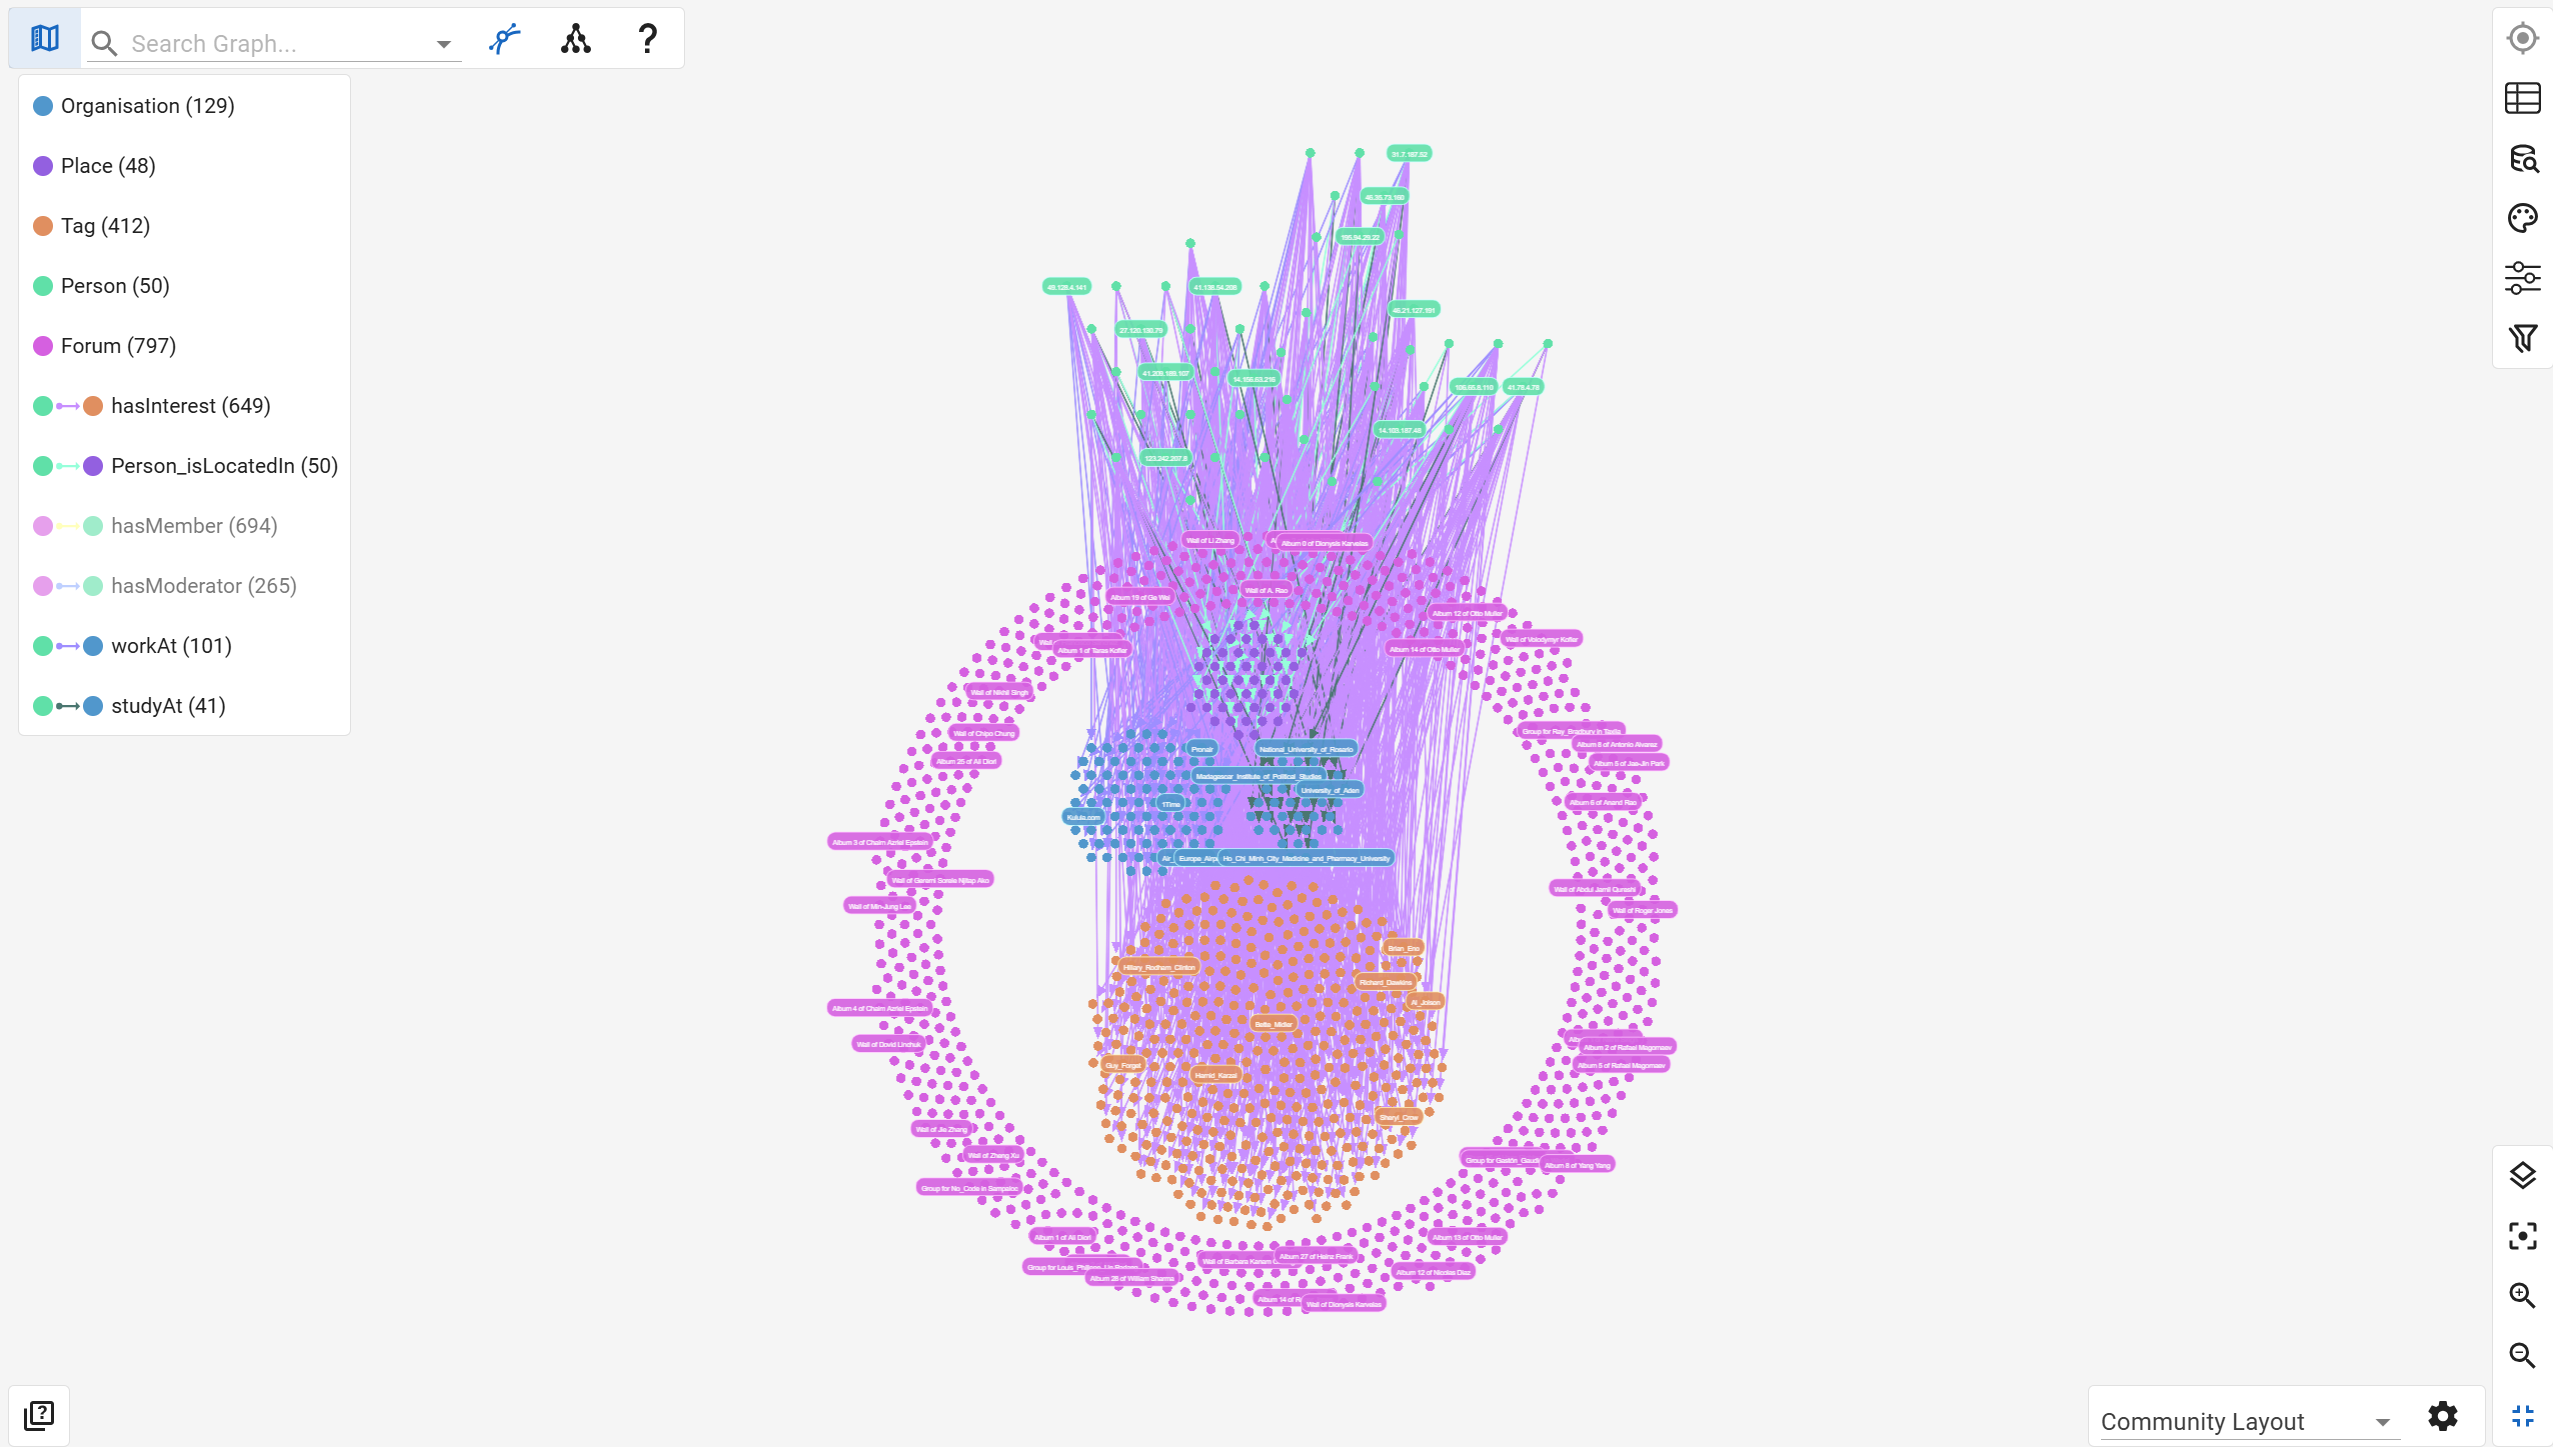
Another important aspect of data exploration in G.V() is the ability to view your existing graph data model.
Kuzu implements a structured property graph data model with strict types on node and relationship properties. G.V() includes a visualization of your graph data model so you can visualize and demonstrate your schema in just one click.
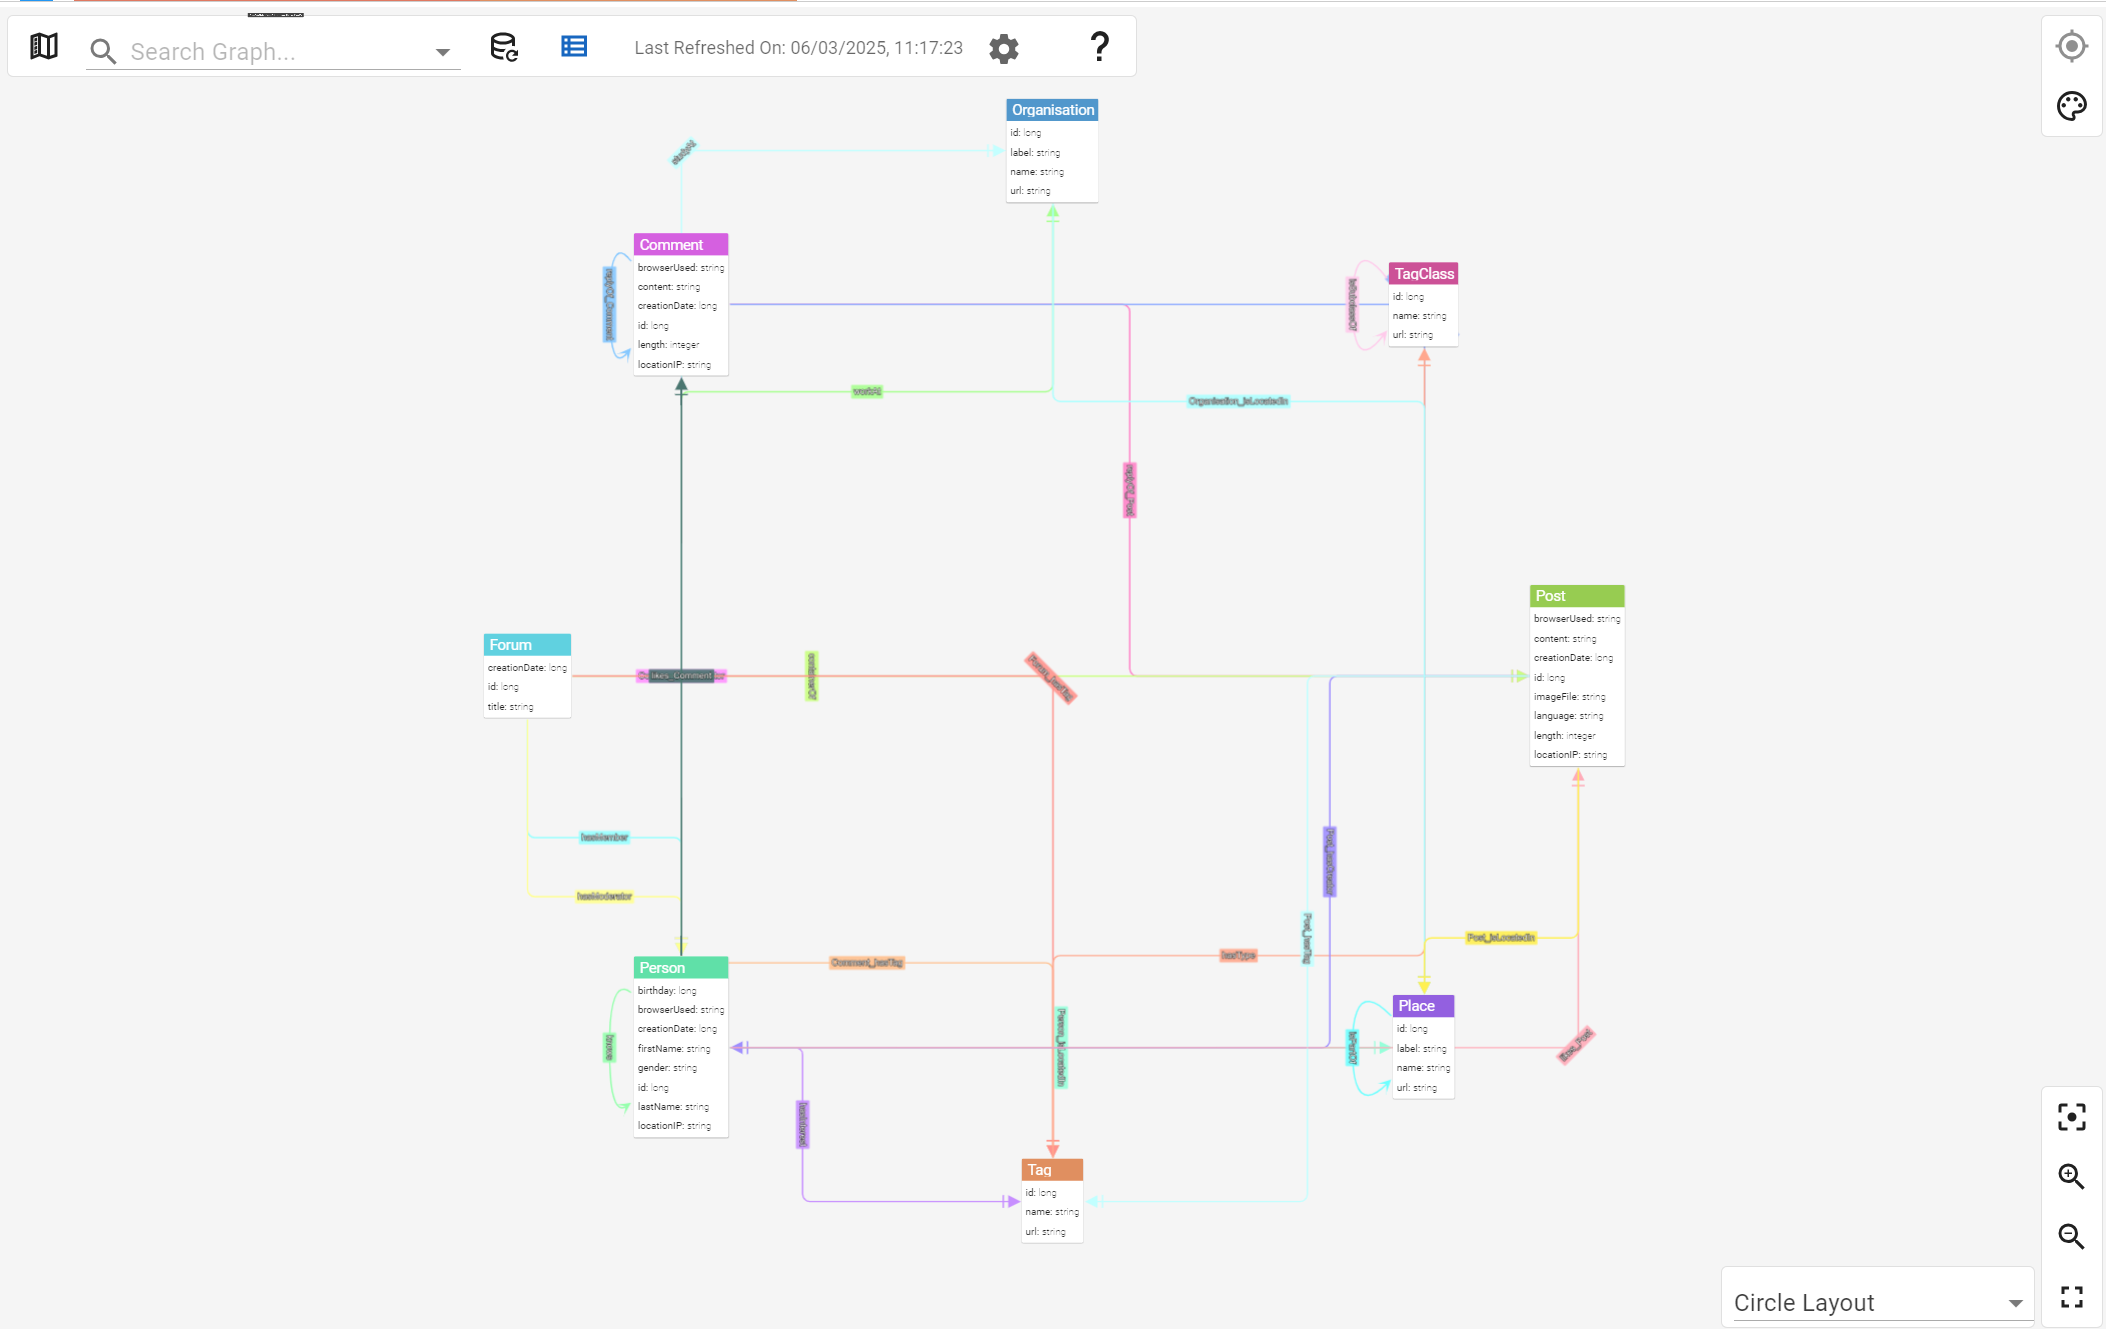
As you can see in the example above, the model shows you nodes and edges available in your graph database, as well as their properties, in a concise and easy to digest view.
Conclusion
We hope this showcase will convince you to pick up G.V() and Kuzu. The two technologies combined offer powerful graph analytics and visualization capabilities. Best of all – it won’t cost you anything to get started!
Stay tuned for future showcases of Kuzu and G.V() working together, and until then, we hope you enjoy this integration.
![The Weekly Edge: Knowledge Graphs at Netflix & Bloomberg, Graphs on Postgres, & Make Your Music SPARQL [9 January 2026] The Weekly Edge: Knowledge Graphs at Netflix & Bloomberg, Graphs on Postgres, & Make Your Music SPARQL [9 January 2026]](https://gdotv.com/wp-content/uploads/2026/01/graphs-postgres-janusgraph-cassandra-sparql-weekly-edge-9-january-2026.png)

