The Weekly Edge: European Railways, Norwegian Weather, Metallic Graphs & more

Happy Thursday!
We’re back at it, once again keeping you updated on the latest graph news. Weather, chemistry and European Railways are the subjects this week. Speaking of Europe, Norway has emerged as an absolute powerhouse of graph updates this week, with not one but two of our news items coming from Norwegian researchers!
Headlines this week:
- I don’t have time for this! Veronika Heimsbakk explores how to use chrontext to retrieve time series data via SPARQL, without that data clogging up your knowledge graph.
- “Train-ing data”, not training data: Researchers in Belgium working on a multi-graph extension to SHACL have demonstrated use of SHACL-DS on the European Railway Infrastructure Knowledge Graph
- Tickets, please: Azure HorizonDB is the latest to demonstrate their LLM-powered function for knowledge graph construction
- Making a Fresh Star(t)dog: Database vendor Stardog has rebranded itself, pivoting towards the LLM market.
- Complex bonds and relationships: Researchers in Oslo have built a chemistry knowledge graph out of existing datasets on transition metals and their complexes.
If you’re new here, the Weekly Edge is your weekly tl;dr of graph technology news curated by the team at gdotv, giving you all the reads, repos, vids, and walkthroughs worth exploring from the past seven-ish days (or so).
/*
 * It’s time to level up your graph game:
 * Query, explore, edit, and visualize your connected data with the gdotv graph IDE
 * Try out the free dev tier or upgrade to a 1-month, no-fuss free trial.
 */
[Interest]: One Query to Rule them All, Querying Graph and Timeseries Data Simultaneously
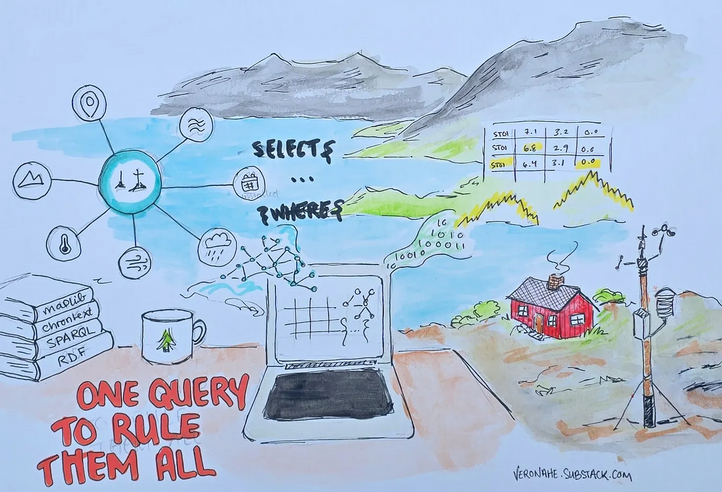
Being from Scotland, the gdotv team is used to trudging through the cold, wind and rain, but the rest of you might want to get out your umbrellas for this one!
We’re travelling to Norway, where knowledge graph specialist Veronika Heimsbakk has been demoing a use case for chrontext in her recent blog post. Chrontext is a library designed to allow knowledge graphs to access large sets of analytical data, particularly timeseries. Heimsbakk showcases how this can be used to probe a knowledge graph of 12 Norwegian weather stations. (And showcases this brilliant artwork above as well!)
Each station is continually accumulating a large volume of time-sensitive information on temperature, wind speed and precipitation. Importing all this data directly could quickly overwhelm our graph, so chrontext offers a way to query it via SPARQL without directly importing it.
The process begins with a simple CSV-to-RDF mapping. As the demo shows, you must take care at the beginning to ensure each weather sensor retains an explicit link to its timeseries. That’s because the timeseries itself stays inside the original relational store (in this case, DuckDB). From here, we create a wrapper for DuckDB through which we’ll run SQL queries, define how we want to pull time-sensitive data (like temperature) via SQL, and map those results to RDF triples.
The end result is that everything can be queried by a single, federated SPARQL query that integrates the graph and timeseries results into one place. Impressive! As Heimsbakk says: it’s “One Query to Rule Them All” and, given the meagre daylight of Norwegian winters, probably in the darkness bind them too.
[Result]: Signal Checks on the Line! Running SHACL-DS Against European Railways
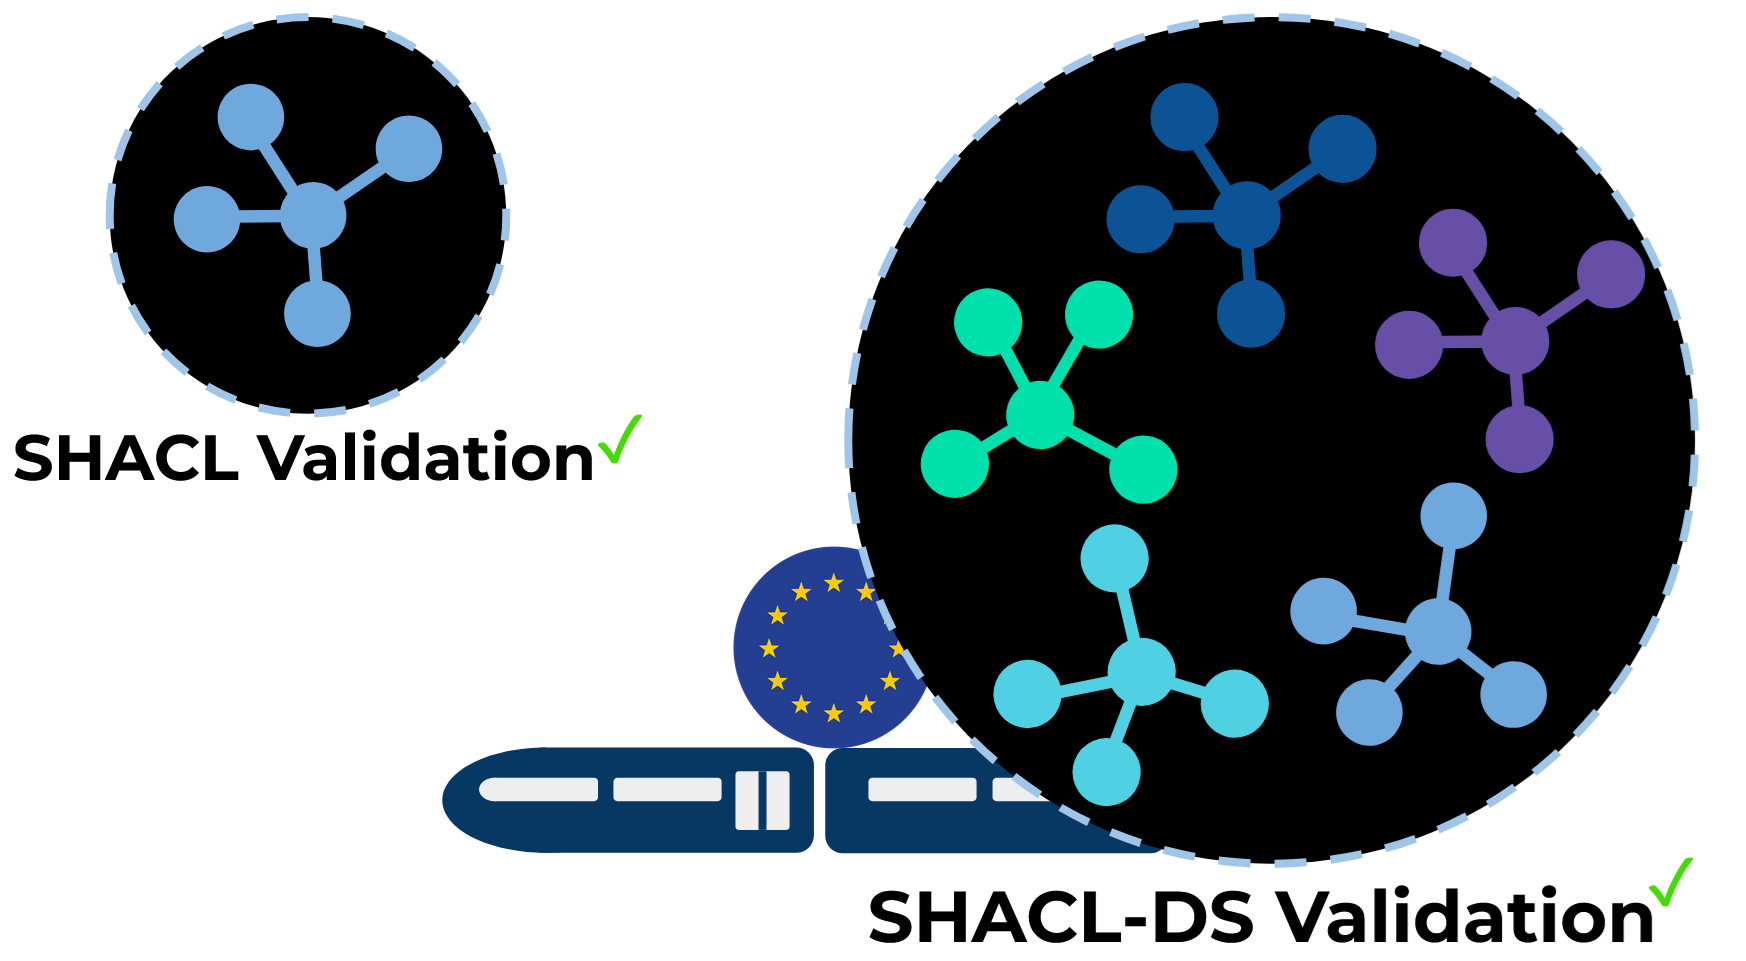
When I previously published my blog post mapping the public transport networks of Scotland as a graph, I discovered that a lot of people who like graphs also like trains. So here’s another satisfying crossover for you: in a collaboration between researchers at the University of Liège, Belgium, and the European Union Agency for Railways. Thanks to their efforts, SHACL-DS has been run against the European Railway Infrastructure Knowledge Graph.
If you’re familiar with RDF, you’re probably well-aware of the Shapes Constraint Language (SHACL). For those who aren’t, let’s recap: SHACL is an RDF-specific language designed for validation. You use SHACL to write rules for your data, and then you run it against that data to check it follows the rules.
So what’s this about SHACL-DS? Well, the “DS” stands for “dataset” – and SHACL-DS is designed to do something SHACL itself isn’t designed to do easily: validate multiple graphs at once. SHACL assumes you have just one graph. SHACL-DS lets you run it against a dataset – which in this context means a collection of graphs.
SHACL-DS was designed by that same team at the University of Liège, but, as the paper notes, it’s never been deployed against a real database, so this is the first proof-of-concept on a large, scalable knowledge graph. Check it out!
[Tutorial]: LLM-Built Graphs on Azure HorizonDB with Apache AGE
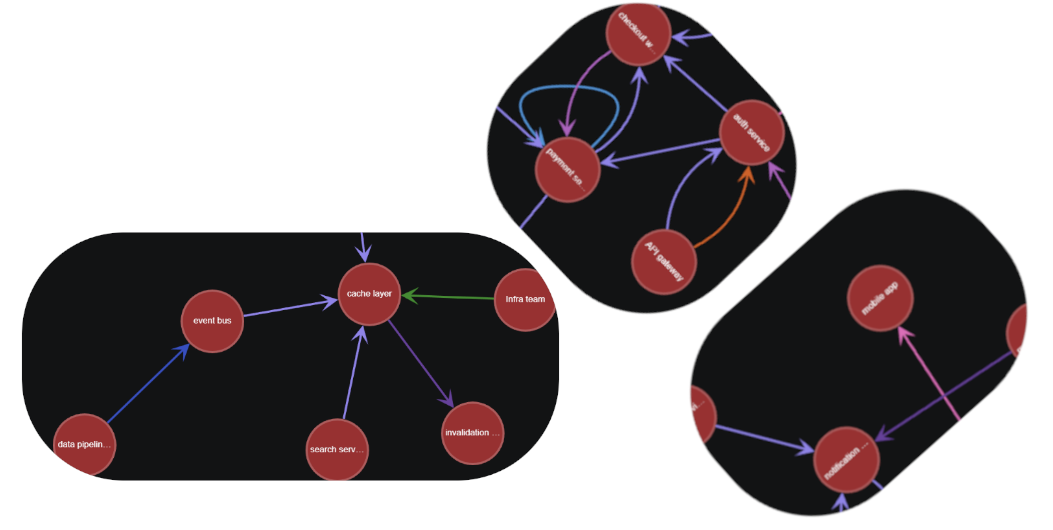
Building graphs is fun, but it’s not always easy. As graphs become an ever more popular way to manage, query and display data, everyone is looking for shortcuts to build their knowledge graphs as quickly as possible.
Using the natural language processing capabilities of large language models to approximate your existing information into a graph form is becoming an increasingly popular practice. It’s not hard to see why, parsing entities and relationships from thousands of documents (or more) is a fundamentally challenging exercise. When manual builds simply take too long, LLMs may be able to get you to a usable knowledge graph quickly, or at least give you a head start on construction.
This tutorial from Microsoft previews how to use an Azure function called azure_ai.extract() to process some natural language data, such as contracts or support tickets, and receive a knowledge graph at the end. The pipeline is targeted towards Azure HorizonDB. In this case, they process five support tickets and return a knowledge graph in Apache AGE loosely describing the system, with relationships such as (API gateway)-(CAUSED_FAILURE_IN)->(auth service). The resulting graph has no standardized schema, though you can indicate some possibilities as part of the prompt.
They argue the pattern can be scaled across thousands of tickets, to produce knowledge graphs that can in turn be re-processed further by additional language models. If you build such a pipeline, do get in touch!
To learn more about how you can connect gdotv to your Apache AGE instance, click here.
[News]: Stardog Pivots to AI-oriented Brand
Well-known graph database vendor Stardog has been making big moves in its marketing recently. Only last month, we at gdotv were blown away when we saw Stardog had easily the biggest booth at Knowledge Graph Conference 2026, complete with stuffed star-dog plushies (literally).
Now Stardog has made another big pivot, branding itself primarily as a knowledge layer for LLM agents. In their own words: “AI with more I.” Graph databases’ infrastructure potential for LLM-oriented systems has been a hot talking point for a while, so Stardog choosing to target that market is not entirely surprising. Nonetheless, their decision to go “all-in” may be unexpected to some.
The rebrand comes complete with new logo and new colour scheme. It’s not clear yet what changes it means for the fundamental Stardog product, many of the existing features like Stardog Explorer, Stardog Studio and Stardog Launchpad seem intact. Likely we’ll see the database design change in line with this new LLM-focused philosophy, but the sentiment shift may be as much about engaging a new audience as modifying the technology itself.
Fortunately, you can still use your Stardog database with gdotv. Learn more about that here.
[Dataset]: Complex Transitions: A Knowledge Graph with Chemical Potential
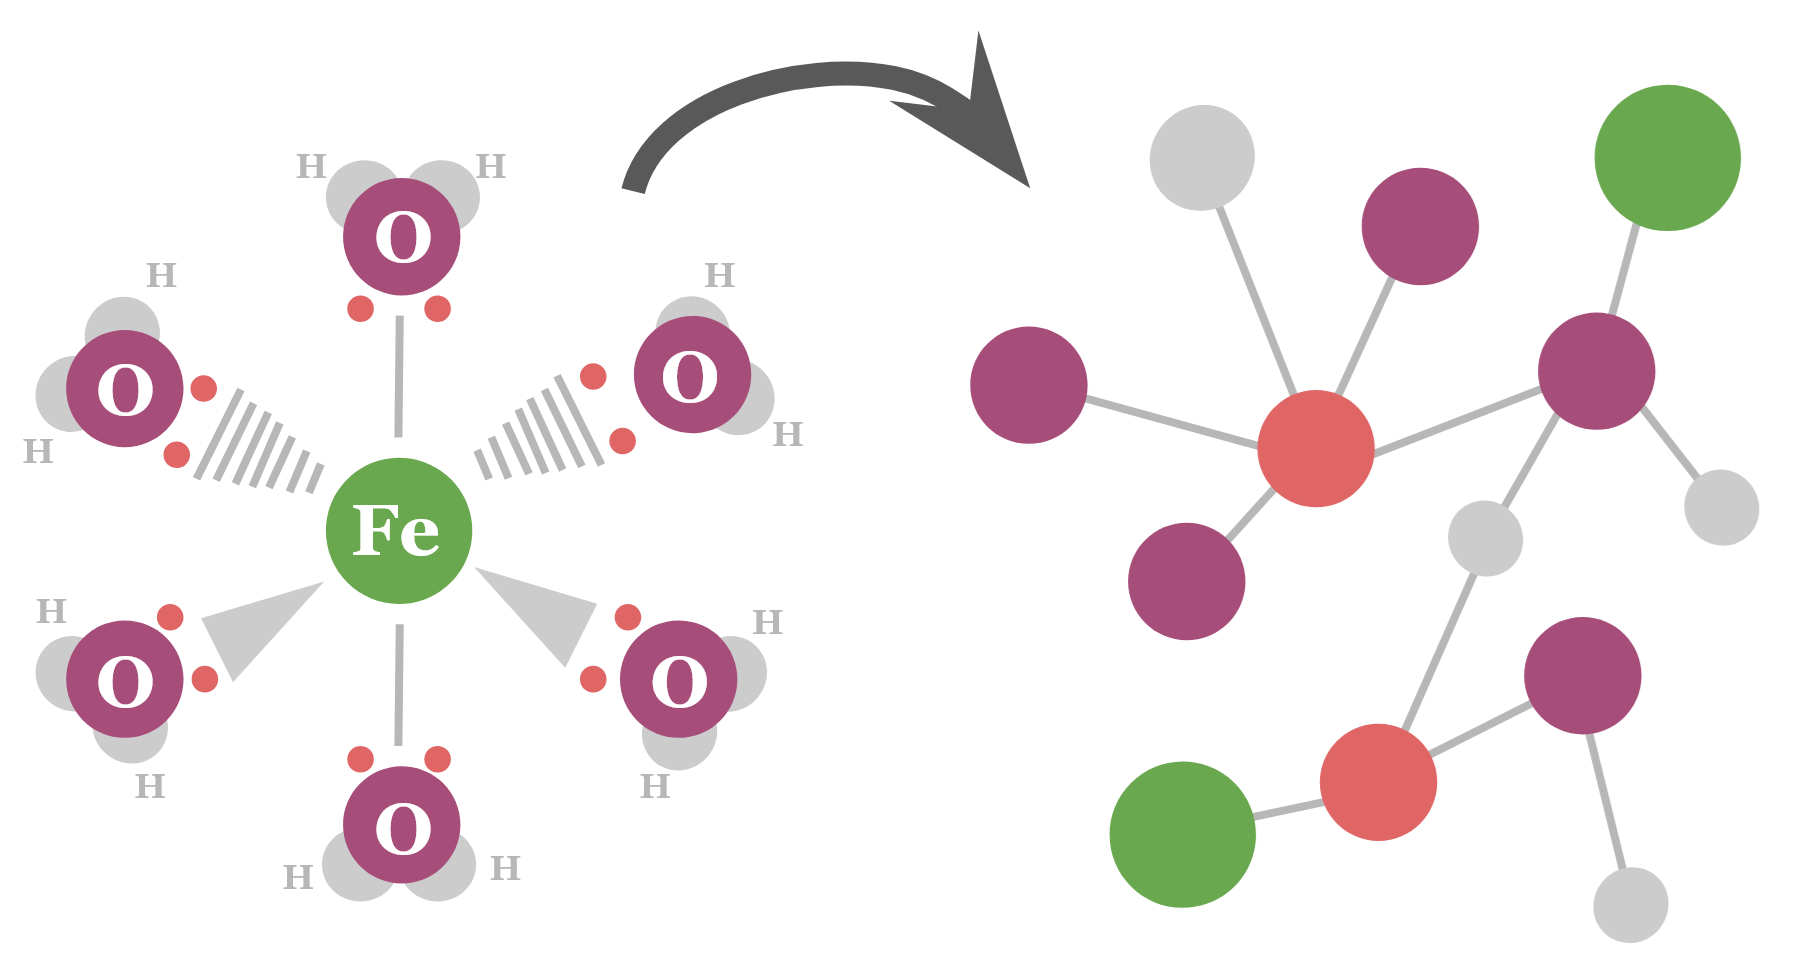
Look, we just really love to share interesting new knowledge graphs. In this case, we’re here to share the tmQM-RDF dataset, a knowledge graph representing Transition Metal Complexes or TMCs.
Possibly your first reaction to this news is “what on earth is a Transition Metal Complex???” However, if you took high school Chemistry, you might actually already know, even if you’ve forgotten. Transition metals are those elements in the middle of the periodic table that have a tendency to lose electrons. Because of that, they form positively charged ions, which can then invite other molecules or ions (“ligands“) to donate their electrons and bond with the transition metal to form a “complex“.
If that still sounds complicated, don’t worry about it. You’re in good company, since the properties of these TMCs are inherently hard to predict, even for experts. There’s just such a large number of them and so many possible configurations. That’s why some of those studying TMCs reckon that graphs might be a handy way to store all this information. The tmQM dataset itself represents one of the more prominent large datasets documenting TMCs, and the tmQM-RDF dataset is the effort of several researchers at the University of Oslo to consolidate that information into graph form.
Read more about it here!
P.S. News from Josh Shinavier of the Hydra project: The production hardening 0.16 release is here, and we might expect to see Hydra on the Apache Incubator track soon.
P.P.S. Putting the knowledge in knowledge graph: Check out this week’s edition of Graph Pulse, where we chat with Juan Sequeda of ServiceNow to discuss the future of data engineering.
P.P.P.S. Got an item to nominate for the next edition of the Weekly Edge? Hit me up at weeklyedge@gdotv.com or hit reply! ✍🏽
/*
![gdotv Adds Multi-Graph Connections & Automatic Data Models [v3.74.142 Release Notes]](https://gdotv.com/wp-content/uploads/2026/08/multi-graph-connections-automatic-data-models-gdotv-v3-74-142-release-notes-banner.webp "gdotv Adds Multi-Graph Connections & Automatic Data Models [v3.74.142 Release Notes]")

