Working with JanusGraph? Here’s how gdotv compares to JanusGraph Visualizer

gdotv vs JanusGraph Visualizer
When you’re working with JanusGraph, you may find yourself searching for a tool to query and explore your data. Today, we’ll examine two tools designed for this purpose, JanusGraph Visualizer and gdotv. JanusGraph Visualizer is the official web-based visualizer maintained by the JanusGraph project itself. gdotv is a commercial graph database IDE that also supports JanusGraph fully.
For developers who spend serious time working with their database, it’s worth understanding what each tool offers. Here’s a side-by-side look.
Overview
 JanusGraph Visualizer is an open-source, web-based tool maintained under the JanusGraph project on GitHub. It’s built on top of the original Gremlin-Visualizer project, and its purpose is straightforward: write a Gremlin query, execute it, and see the resulting nodes and edges rendered as a graph. It doesn’t aim to be a full-featured IDE. It’s more a lightweight companion tool for exploring graph data visually. Being open-source and free, it’s a natural starting point for anyone already running JanusGraph.
gdotv is a commercial graph database IDE built for developers and data professionals. It’s available as a desktop application on Windows, macOS, and Linux, and also on the AWS Marketplace. Where JanusGraph Visualizer covers one specific slice of the workflow – run a query, see a graph – gdotv is designed to cover the whole thing, from writing and debugging queries, to schema exploration, data editing, and visualization. Both tools support JanusGraph via Gremlin, but they approach the job at very different levels of depth.
Installation & Setup
JanusGraph Visualizer is a self-hosted web application, so there’s a setup process before you can use it. The recommended route is Docker: you’ll need Docker installed, then pull the image and run the container with the appropriate environment variables for your Gremlin host and port. You can also build it from source using Node.js and npm if you prefer. Neither path is especially complicated, but it’s still something you need to do before you can open a browser and start working. The configuration is minimal (mainly just specifying a host, port, and traversal source) but the self-hosted nature does mean it lives on your infrastructure rather than your desktop.
gdotv, by contrast, is a downloadable desktop application. Install it, open it, add a new connection with your JanusGraph hostname and port, and you’re already in a query window with the schema panel open alongside it. The whole process takes a few minutes at most.
The Query Editor
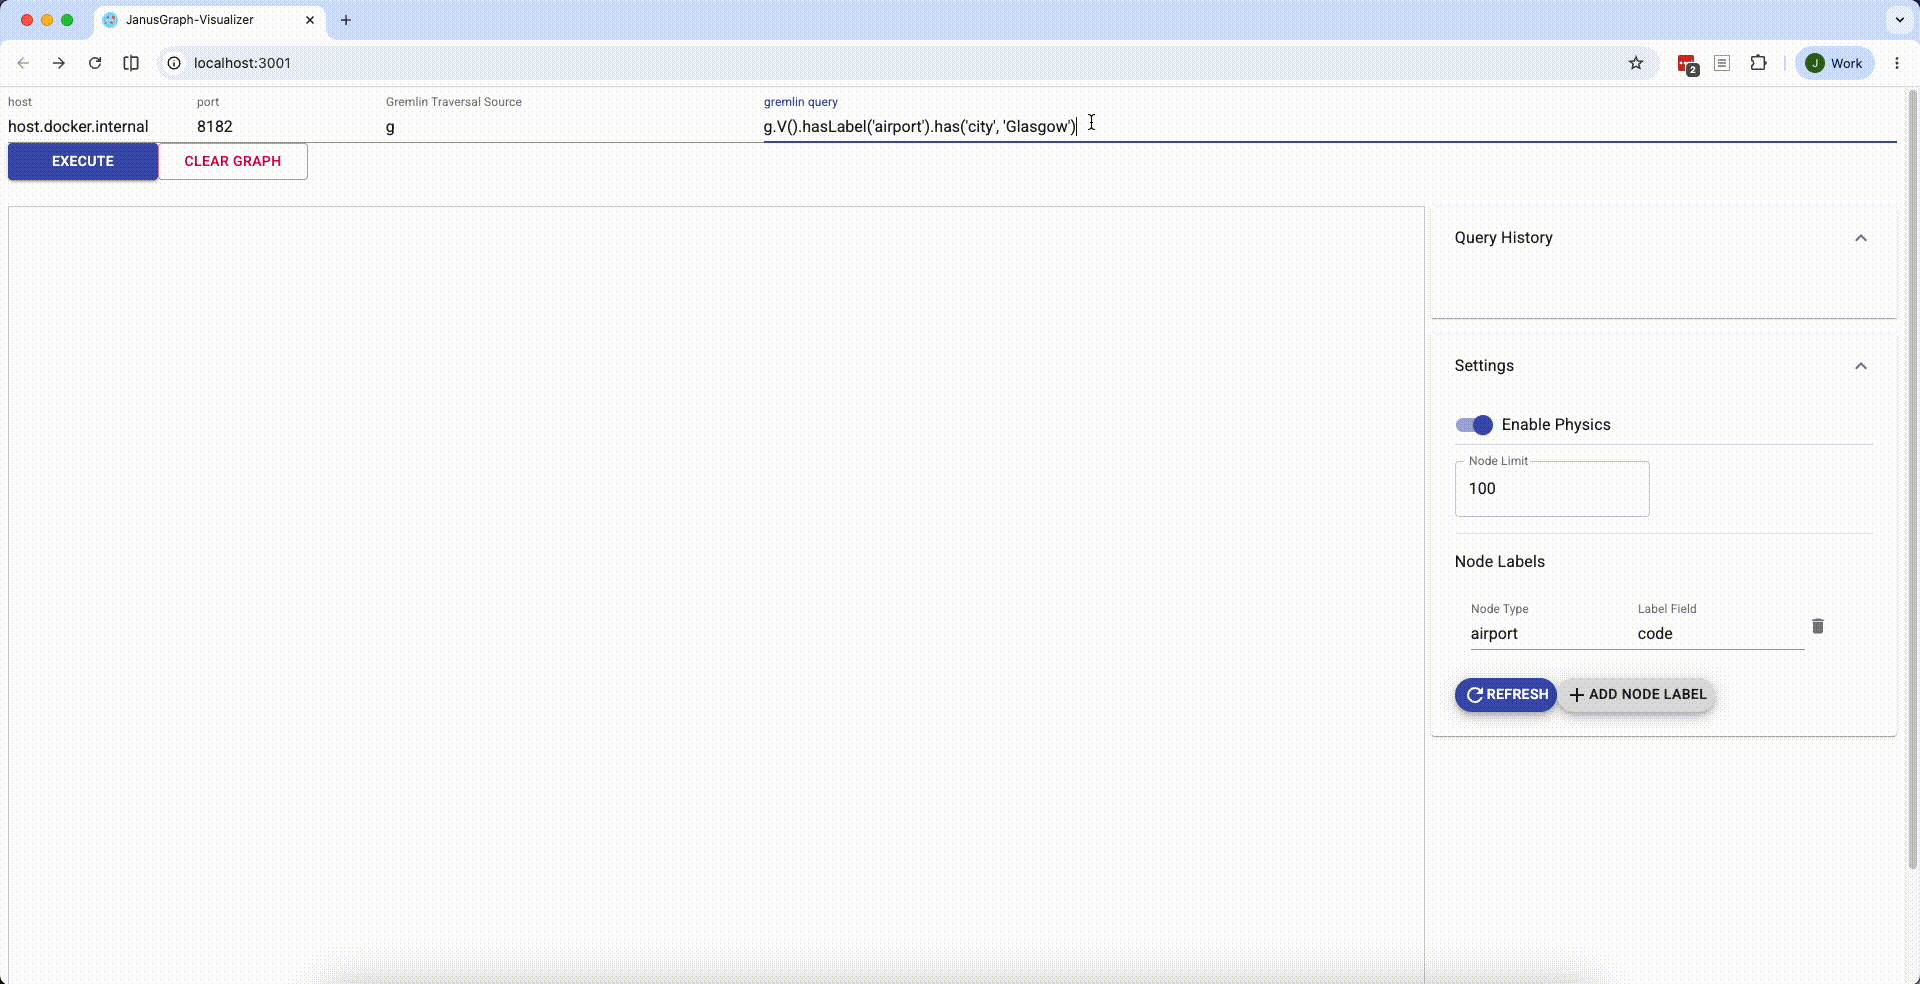
This is where the first gap between the two tools becomes apparent. JanusGraph Visualizer has a basic text input for writing Gremlin queries. There’s no autocomplete, no syntax highlighting, no inline documentation, and no awareness of your graph’s schema. You type a query, hit Execute, and see what comes back. For simple lookups and quick exploration it works great, but for writing anything non-trivial, particularly across a complex schema, you may find yourself looking for additional tooling.
![]()
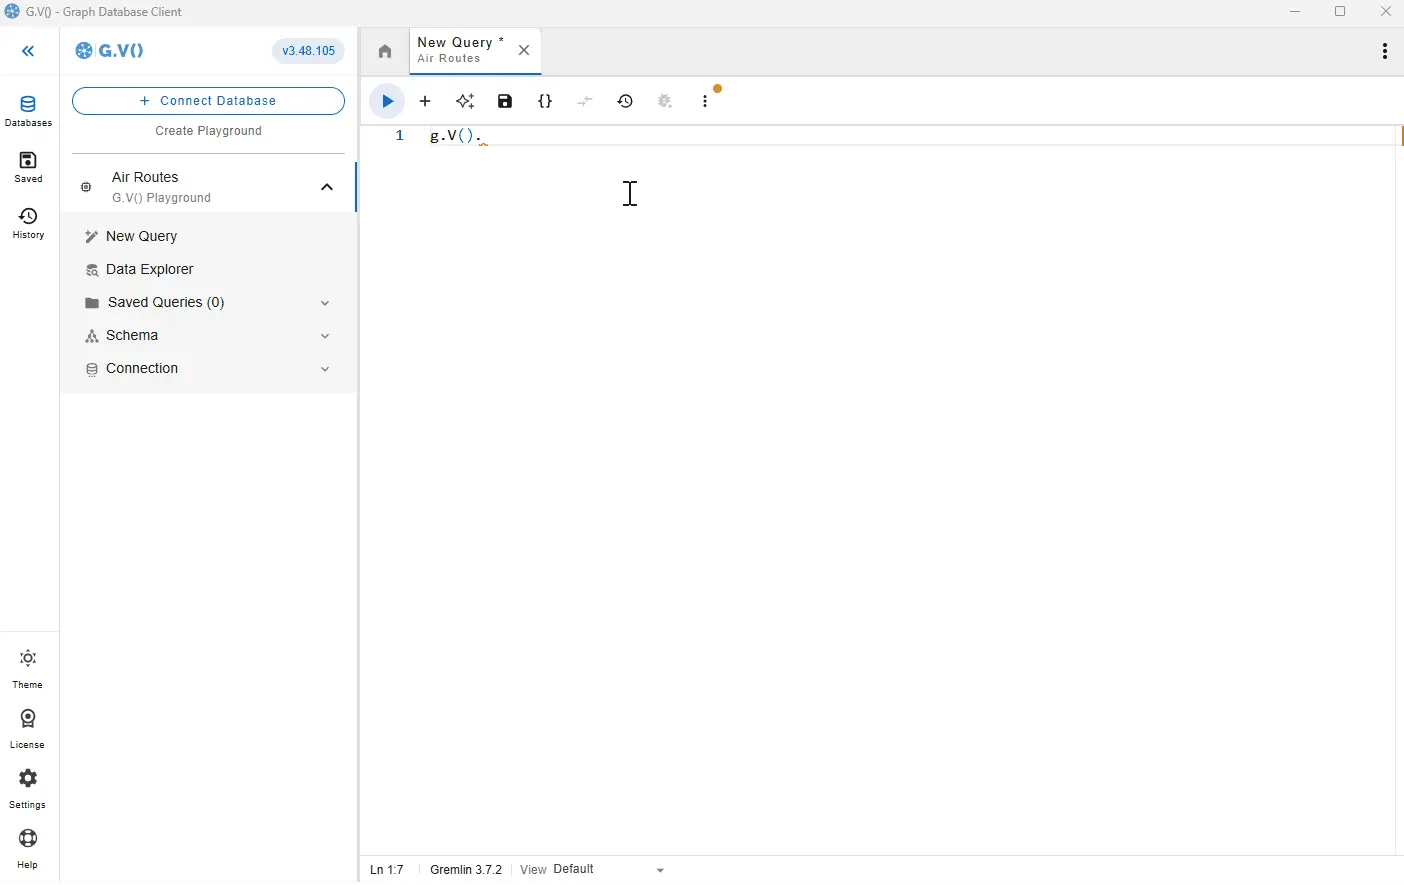
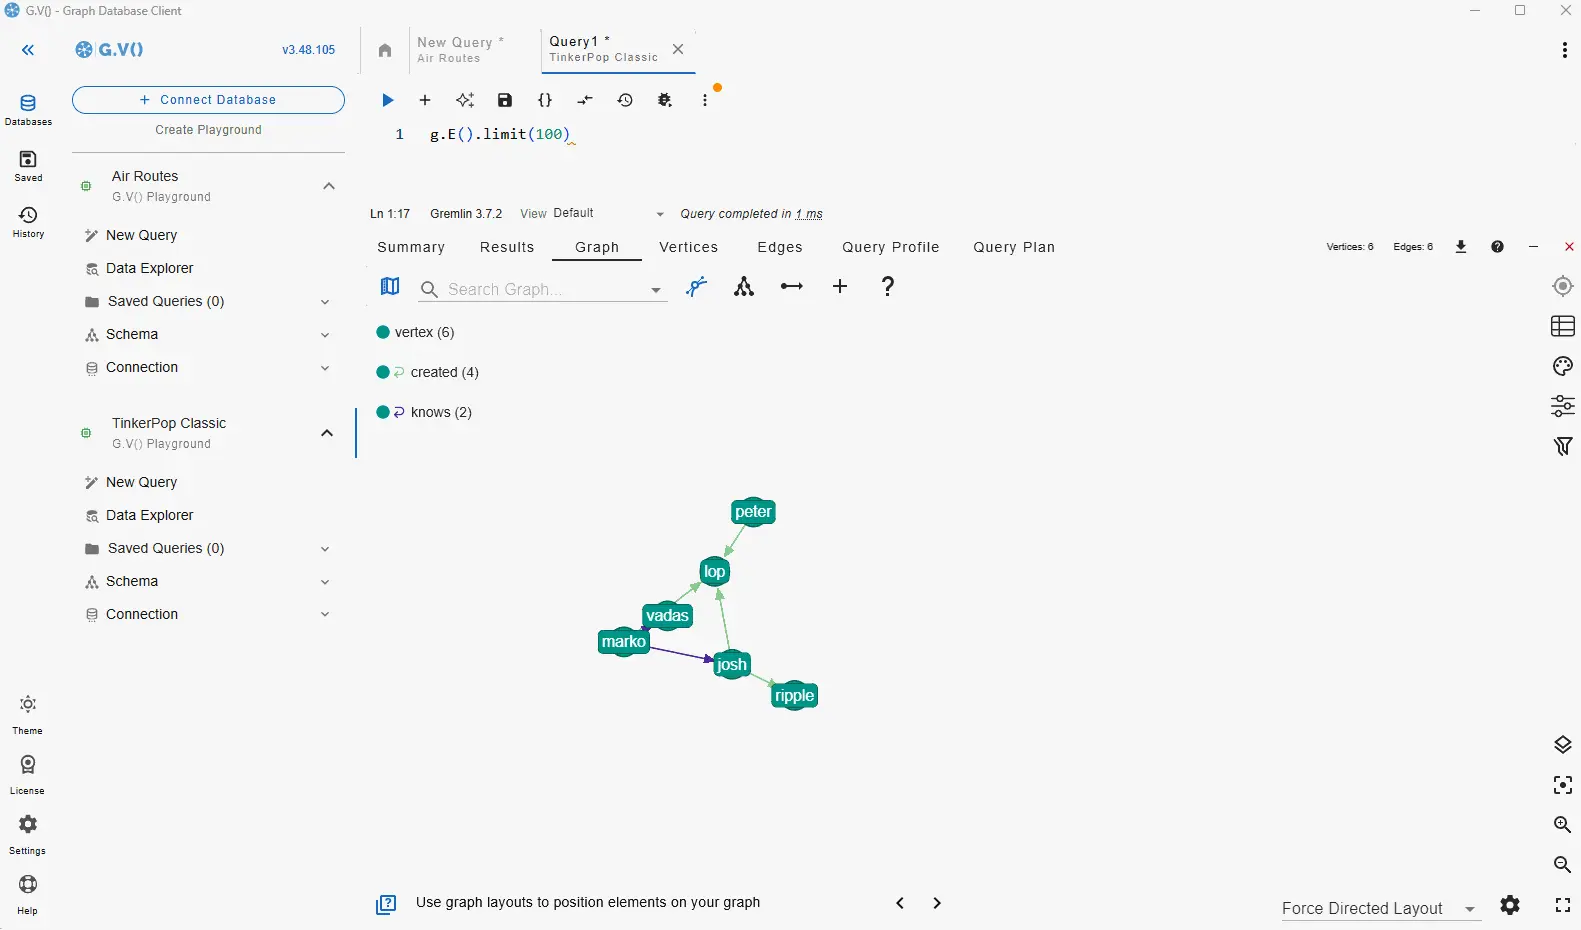
gdotv’s Gremlin editor is purpose-built for this kind of day-to-day work. It offers real-time autocomplete that’s informed by your actual schema, syntax highlighting, and embedded official Gremlin documentation. It also includes the first-ever Gremlin query debugger, which lets you step through traversals rather than having to instrument them manually. For anyone writing Gremlin regularly, these features could save you significant time.
Graph Visualization
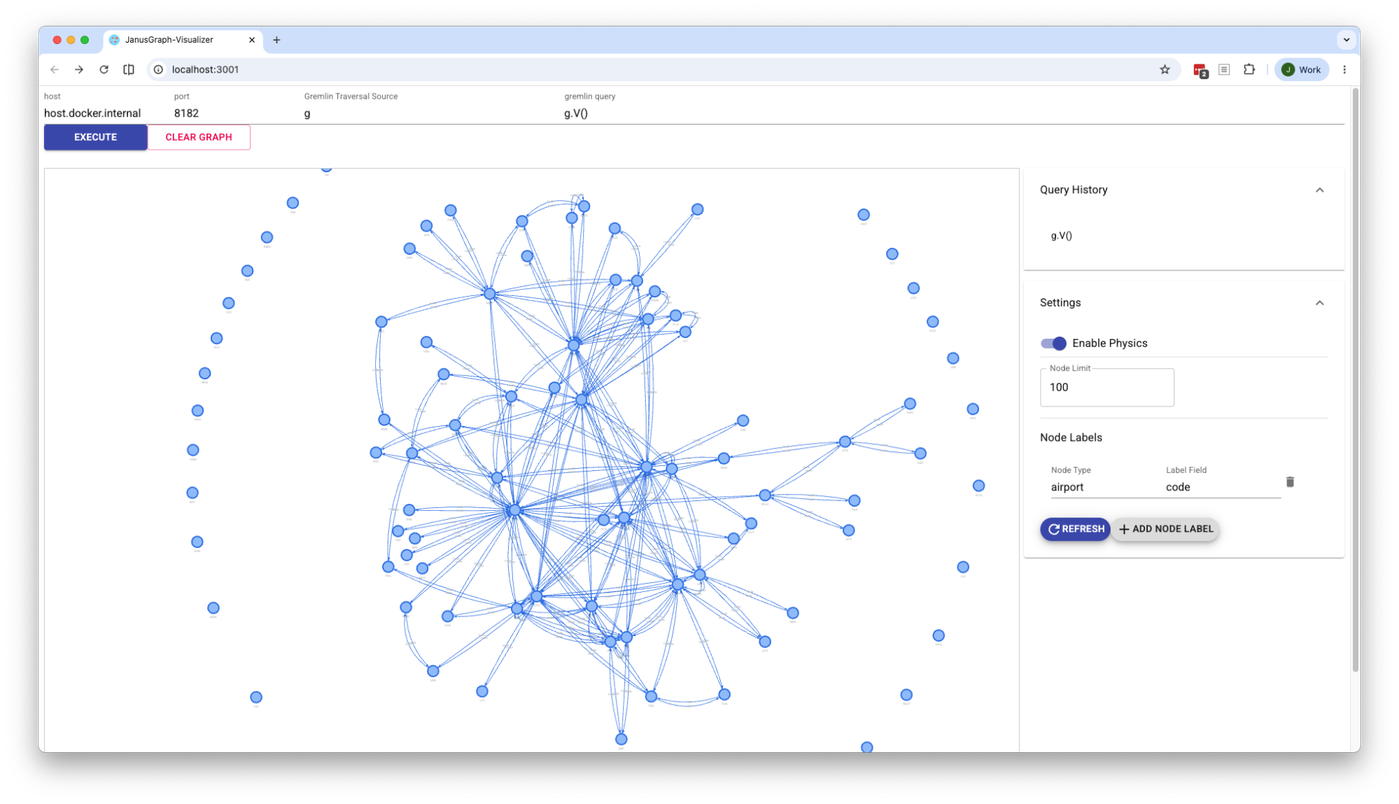
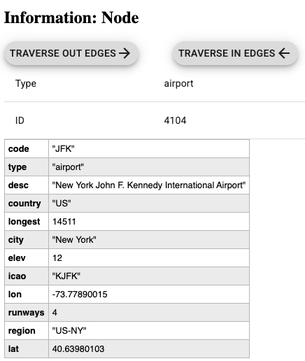
JanusGraph Visualizer renders query results as an interactive node-edge graph. You can click on nodes and edges to inspect their properties in a side panel, and results from successive queries can be merged and displayed together in the same view. It’s functional, sleek and gets the core job done.
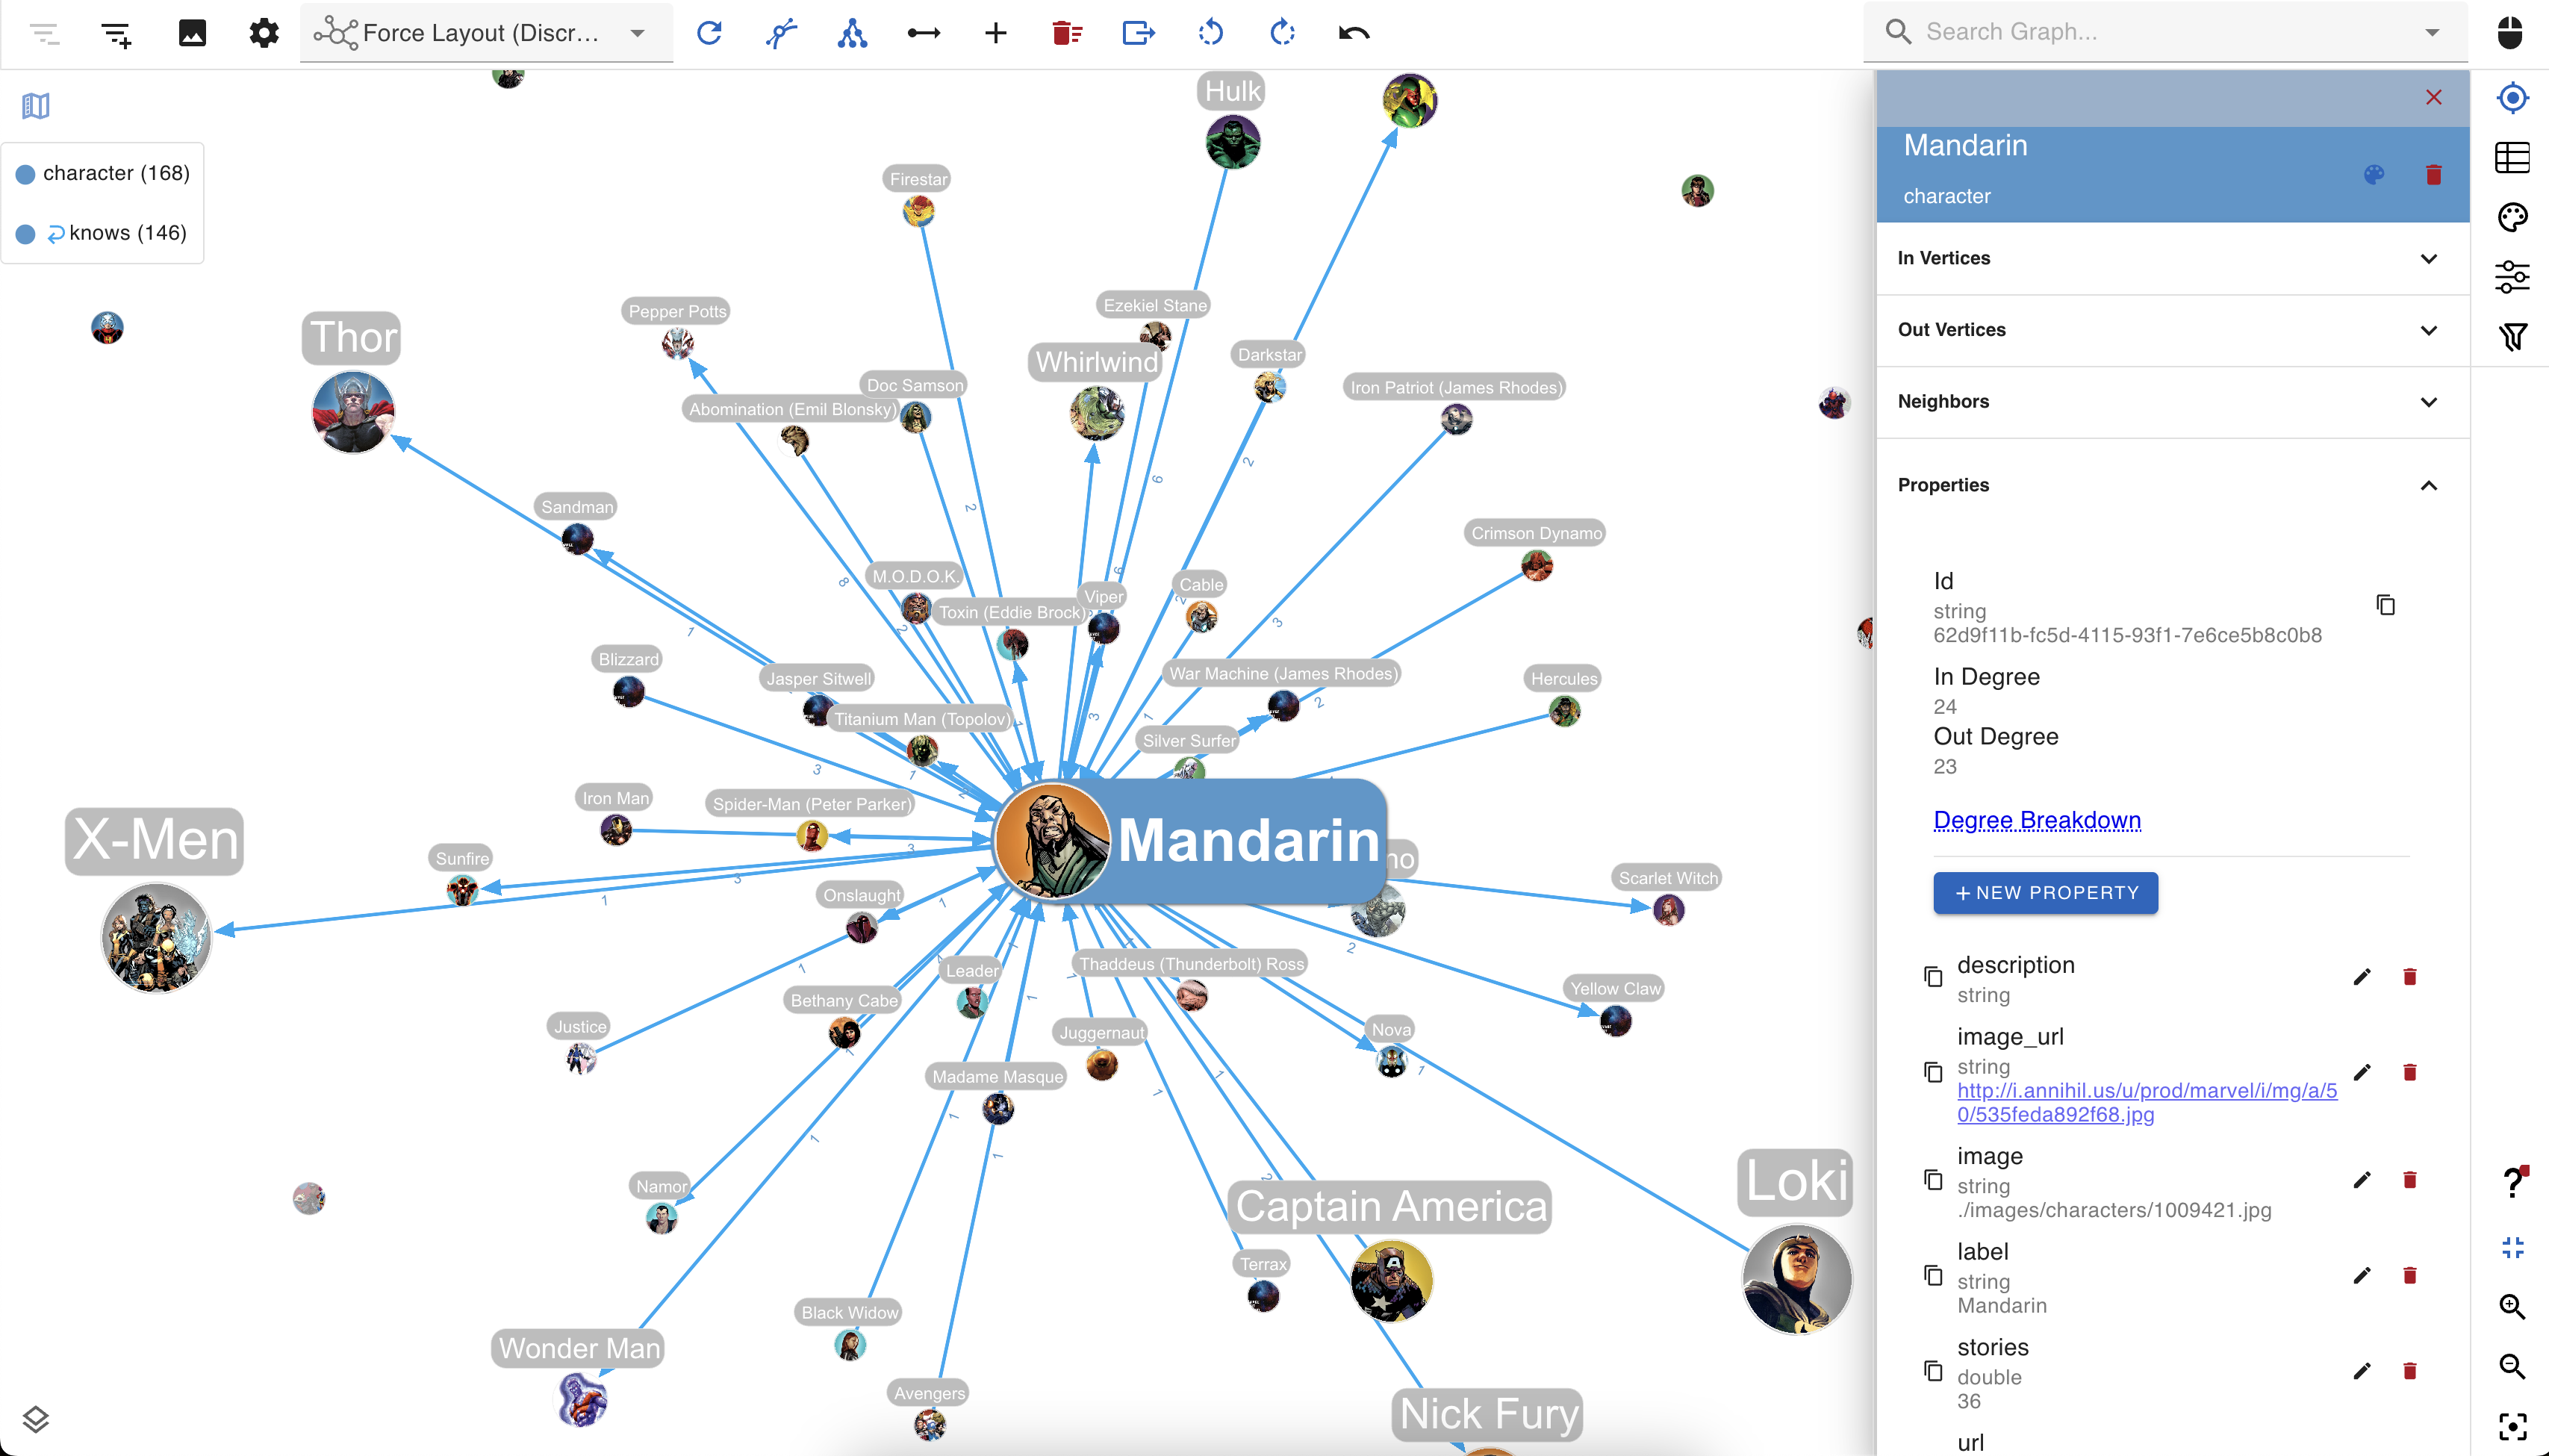
gdotv’s visualization brings this same core functionality, but also goes further. Layout options are more configurable, and the styling system lets you do things like size nodes based on their connectedness or property values, create custom label templates that combine property values with free text, and save multiple stylesheets to switch between.
Schema Visibility
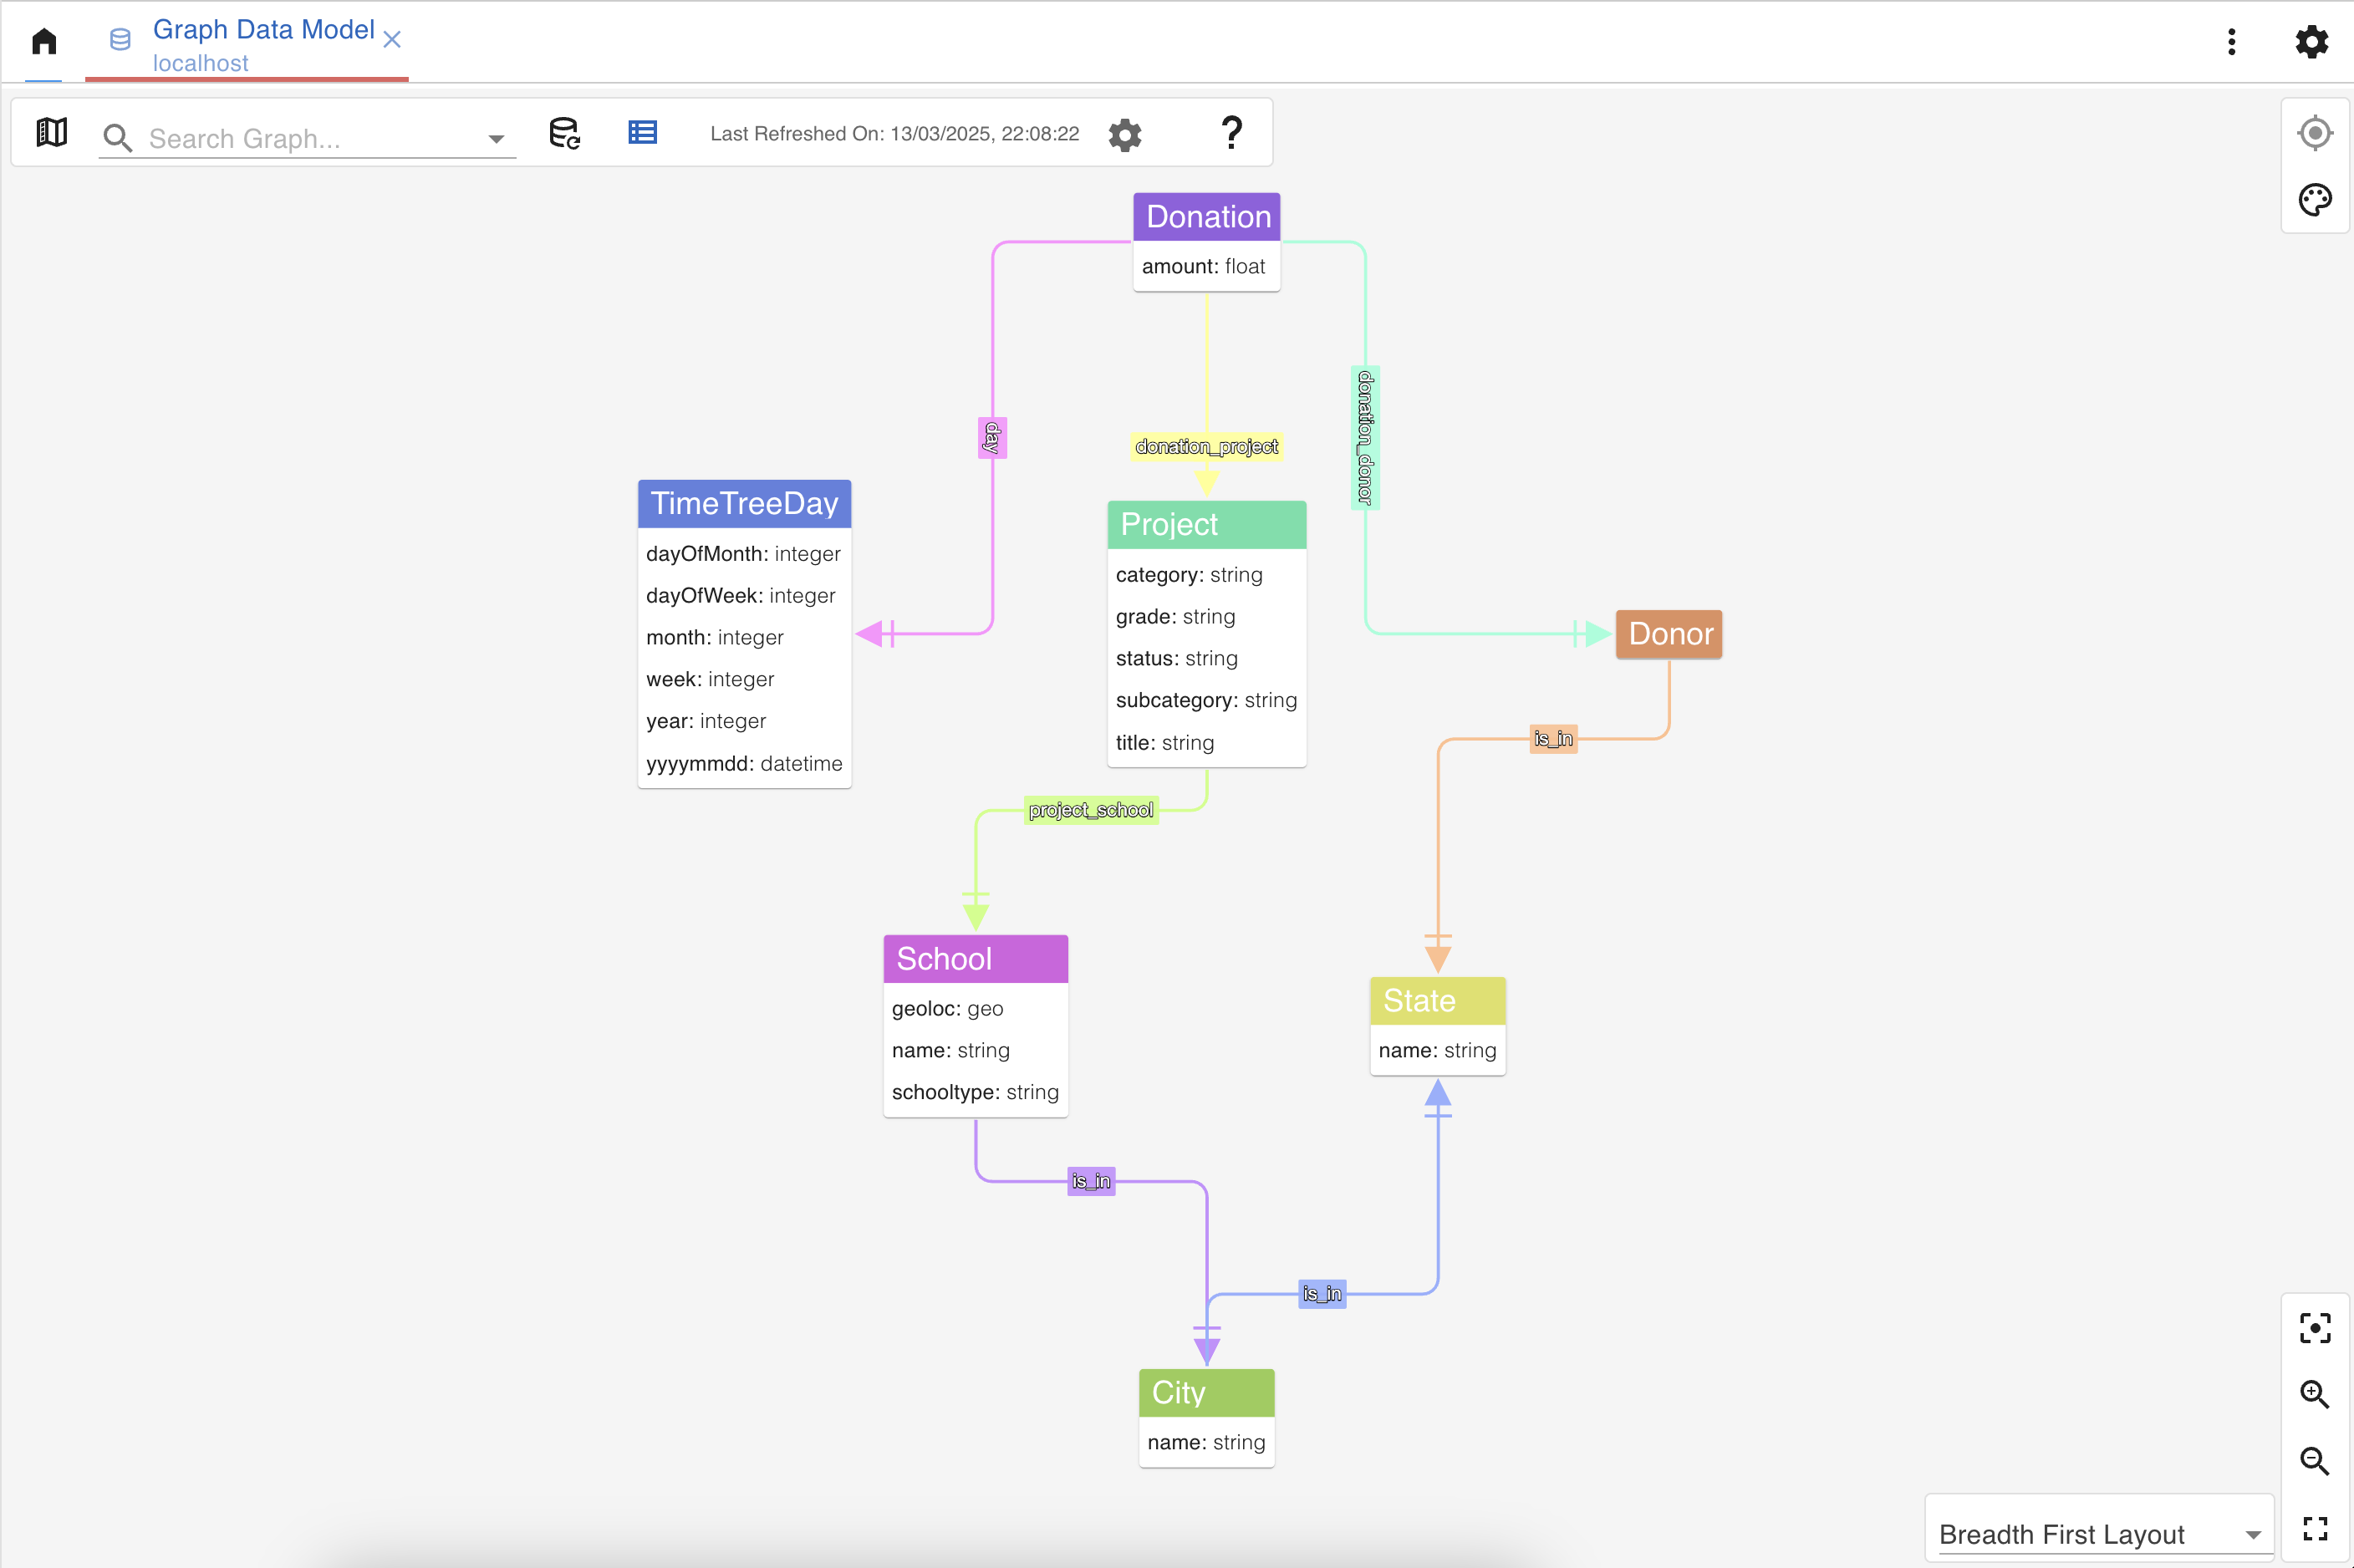
One of the most useful features in gdotv is its Graph Schema view, which automatically infers your vertex and edge labels and their properties directly from the database and presents them as an entity-relationship diagram. It’s available at a click, and there’s also a live version in the reference panel that reacts as you type queries.
JanusGraph Visualizer has no equivalent, as there’s no schema view or mechanism to browse the data model. If you need that information, you may wish to look to products like gdotv.
Data Editing
JanusGraph Visualizer is read-only. You can explore and visualize your data but can’t make any changes from within the tool.
gdotv supports creating, updating, and deleting vertices, edges, and properties directly from the application, assuming you have appropriate permissions. You can do this either through mutation queries in the editor, or through point-and-click editing on the graph visualization itself. For anyone managing data as well as querying it, gdotv is a self-contained working environment.
No-Code Exploration
JanusGraph Visualizer is fully query-driven, so you need to write Gremlin queries to get anything on screen. There’s no codeless path for browsing the data per se, but it does allow you to ‘walk the graph’ from a chosen vertex by traversing in and out edges. You’re able to see the query it runs to achieve this as well in the query history.
gdotv similarly allows graph walking, but also includes a unique Data Explorer feature. The Data Explorer lets you define path patterns, filter by label, direction, and property values, and explore your graph without writing a query. It covers the same general use case as tools like AWS Graph Explorer‘s visual search, if you’re familiar with that, but within a tool that also does everything else.
Who Should Use What?
JanusGraph Visualizer is a solid, no-cost option for developers who need a quick way to run Gremlin queries and see the results as a graph. If you’re prototyping, learning the data model on a new project, or just need occasional visual inspection of query output, it may fully cover your needs. Being part of the official JanusGraph project also means it’s maintained alongside the database itself.
gdotv may be better fit for developers and data professionals who work with JanusGraph regularly and need a proper day-to-day environment. The query editor, schema visibility, debugging tools, and data editing capabilities add up to a meaningfully more powerful stack. It’s a paid product, but there’s a three-week free trial, so it’s worth running both tools side by side and seeing which one suits your situation.
Conclusion
JanusGraph Visualizer and gdotv aren’t really competing for the same use case. The Visualizer is a lightweight, free, officially supported tool that does one thing well: letting you see query results as a graph. If that’s all you need, JanusGraph Visualizer can do the job. But if you’re spending significant time in JanusGraph and need to write complex queries, debug traversals, understand your schema, or manage your data, gdotv is built for that job in a way that JanusGraph Visualizer isn’t. Gdotv’s free trial makes it easy to try both products side by side and find out for yourself.

