Practical Advice on Graph Visualization: The Case of SigmaJS

At gdotv, we have evaluated a lot of graph visualization frameworks over the years, each with its own set of tradeoffs. We eventually settled on SigmaJS for its performance and its potential, and since 2023, it has powered our graph visualization.
Picking a graph visualization framework is a difficult task. There are many factors to account for, and two important tradeoffs need to be made:
– how much rendering performance do you trade for visual flexibility?
– should we use a commercial library (e.g. Keylines, Ogma, yWorks) or a free, open-source one (SigmaJS, Vis.js, CytoscapeJS, etc)?
Commercial libraries have achieved an excellent balance between performance and flexibility. Open-source ones, however, have historically been focusing on either criteria, not both at the same time.
But open-source is catching up. Today, we’re here to talk about SigmaJS v4 and the improvements it’s bringing to close the customization gap initially brought by its WebGL-based rendering.
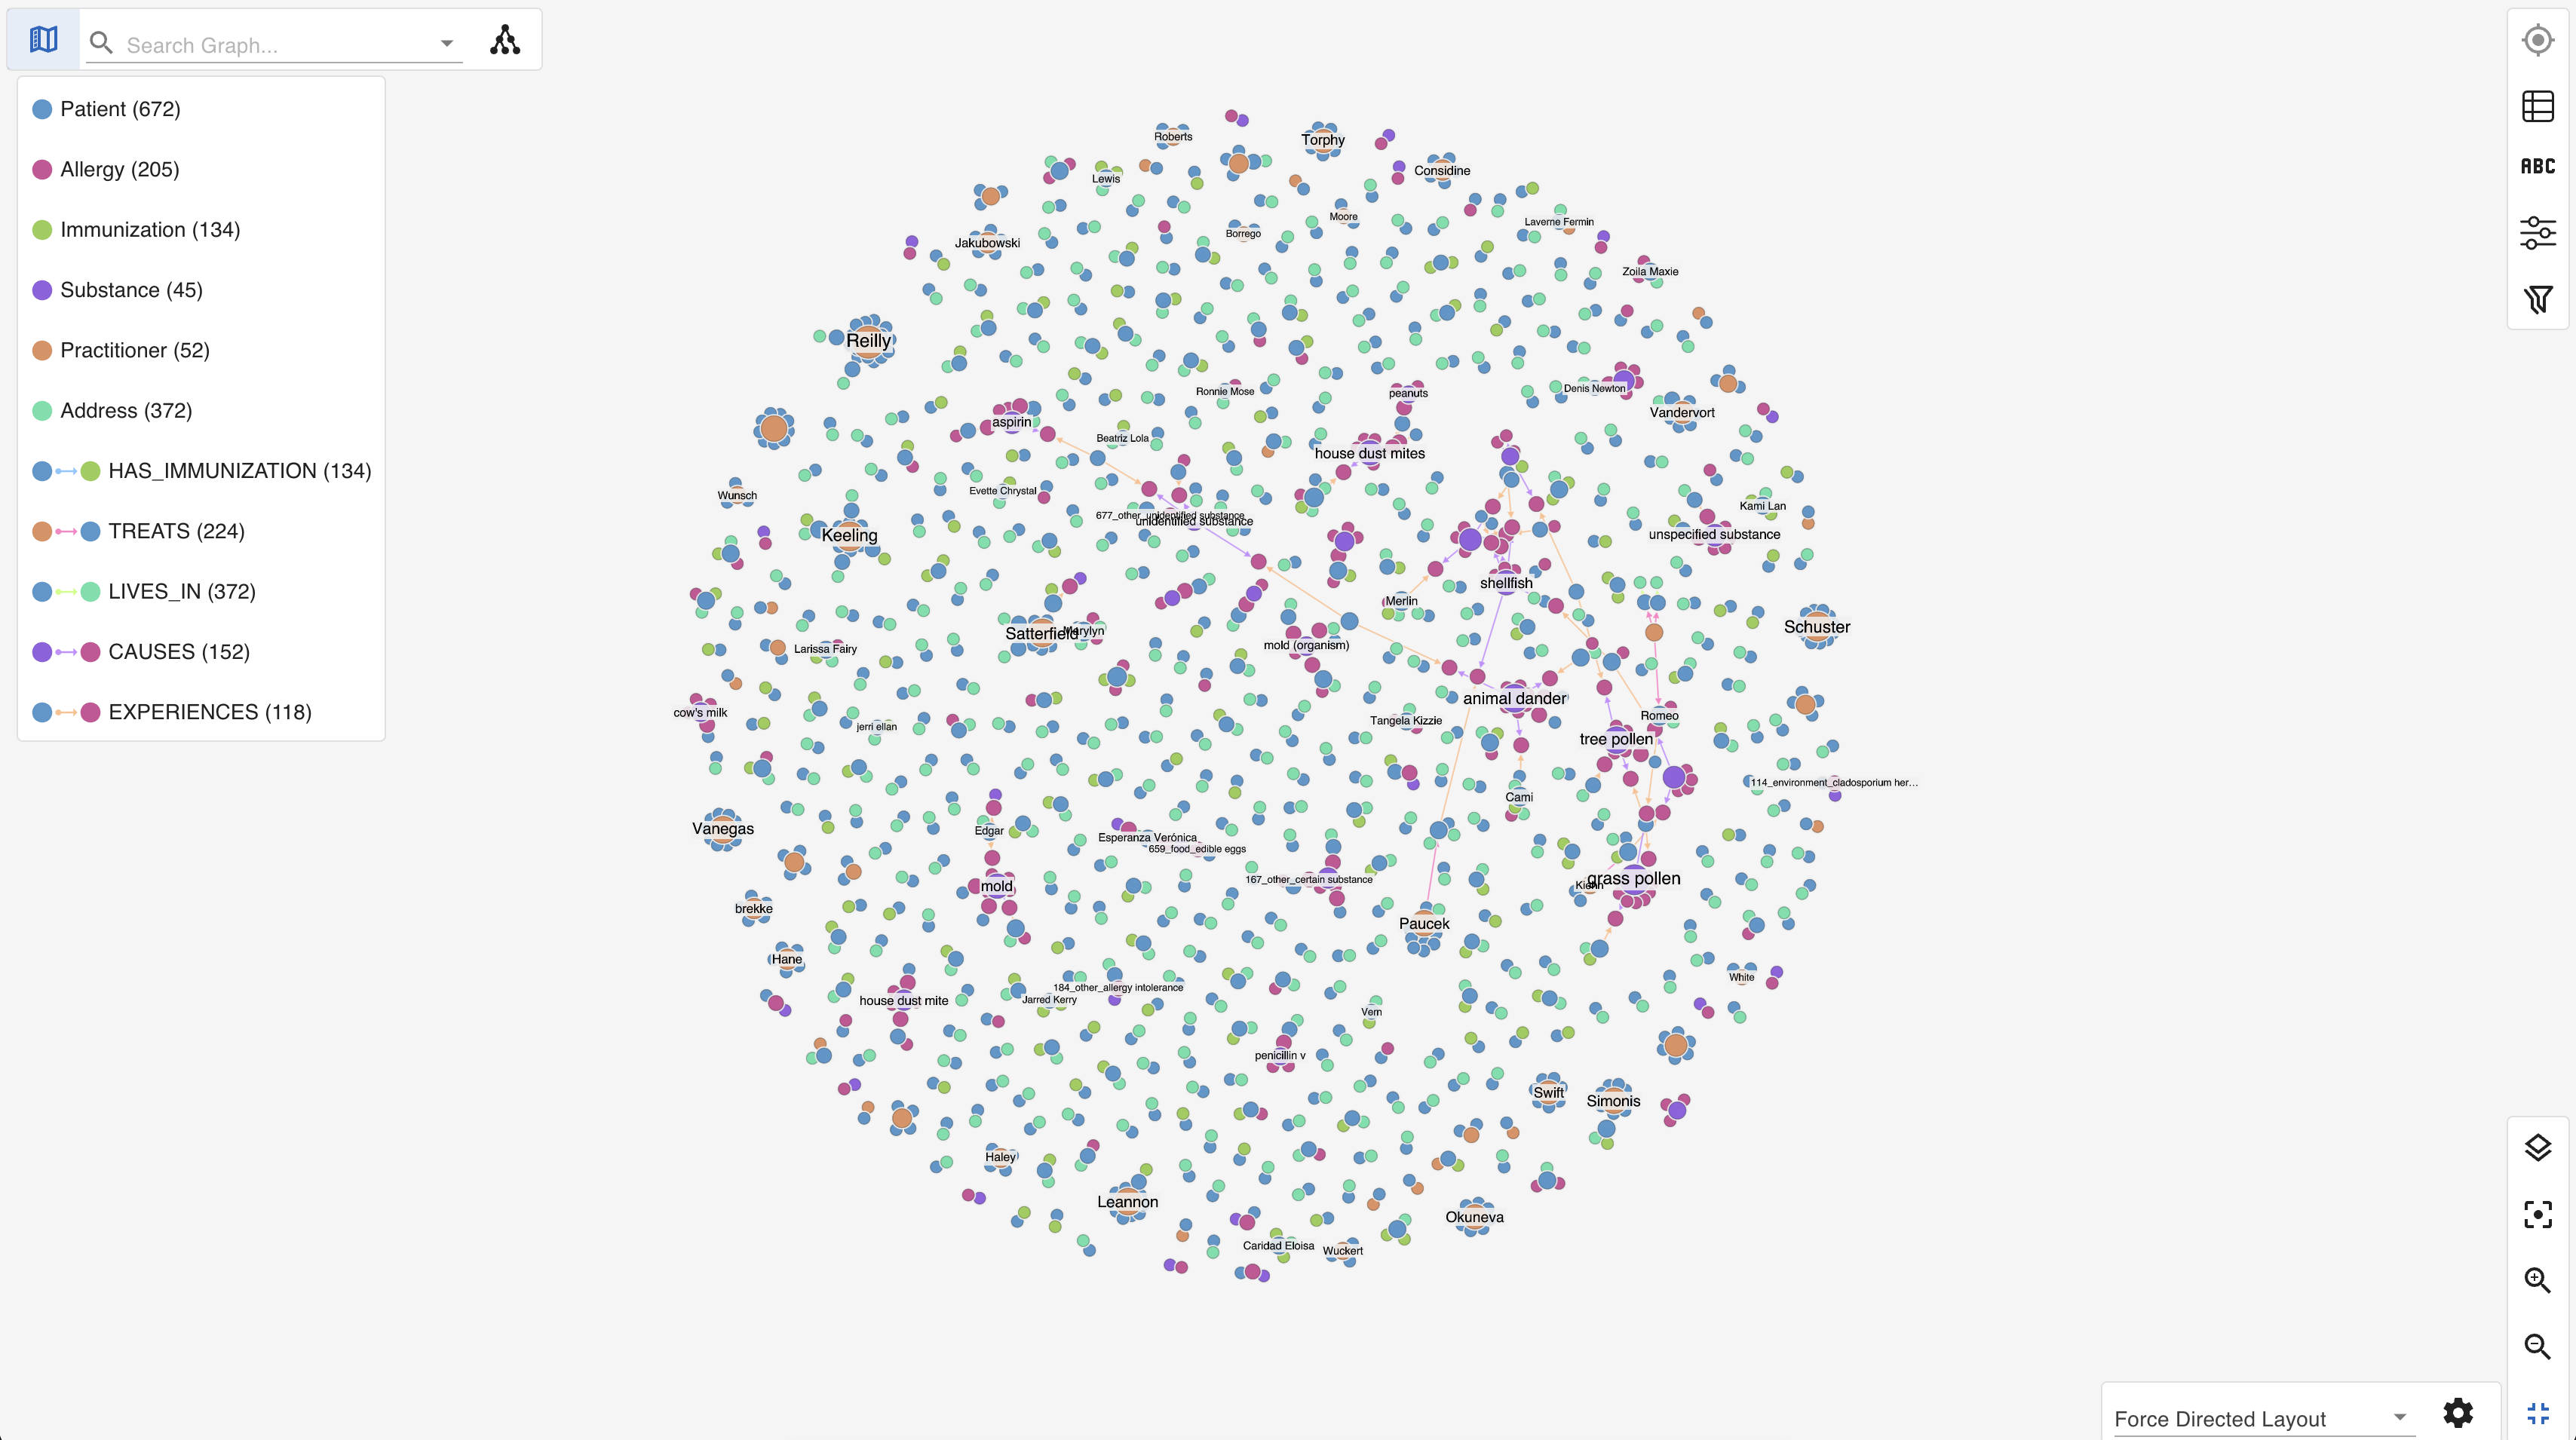
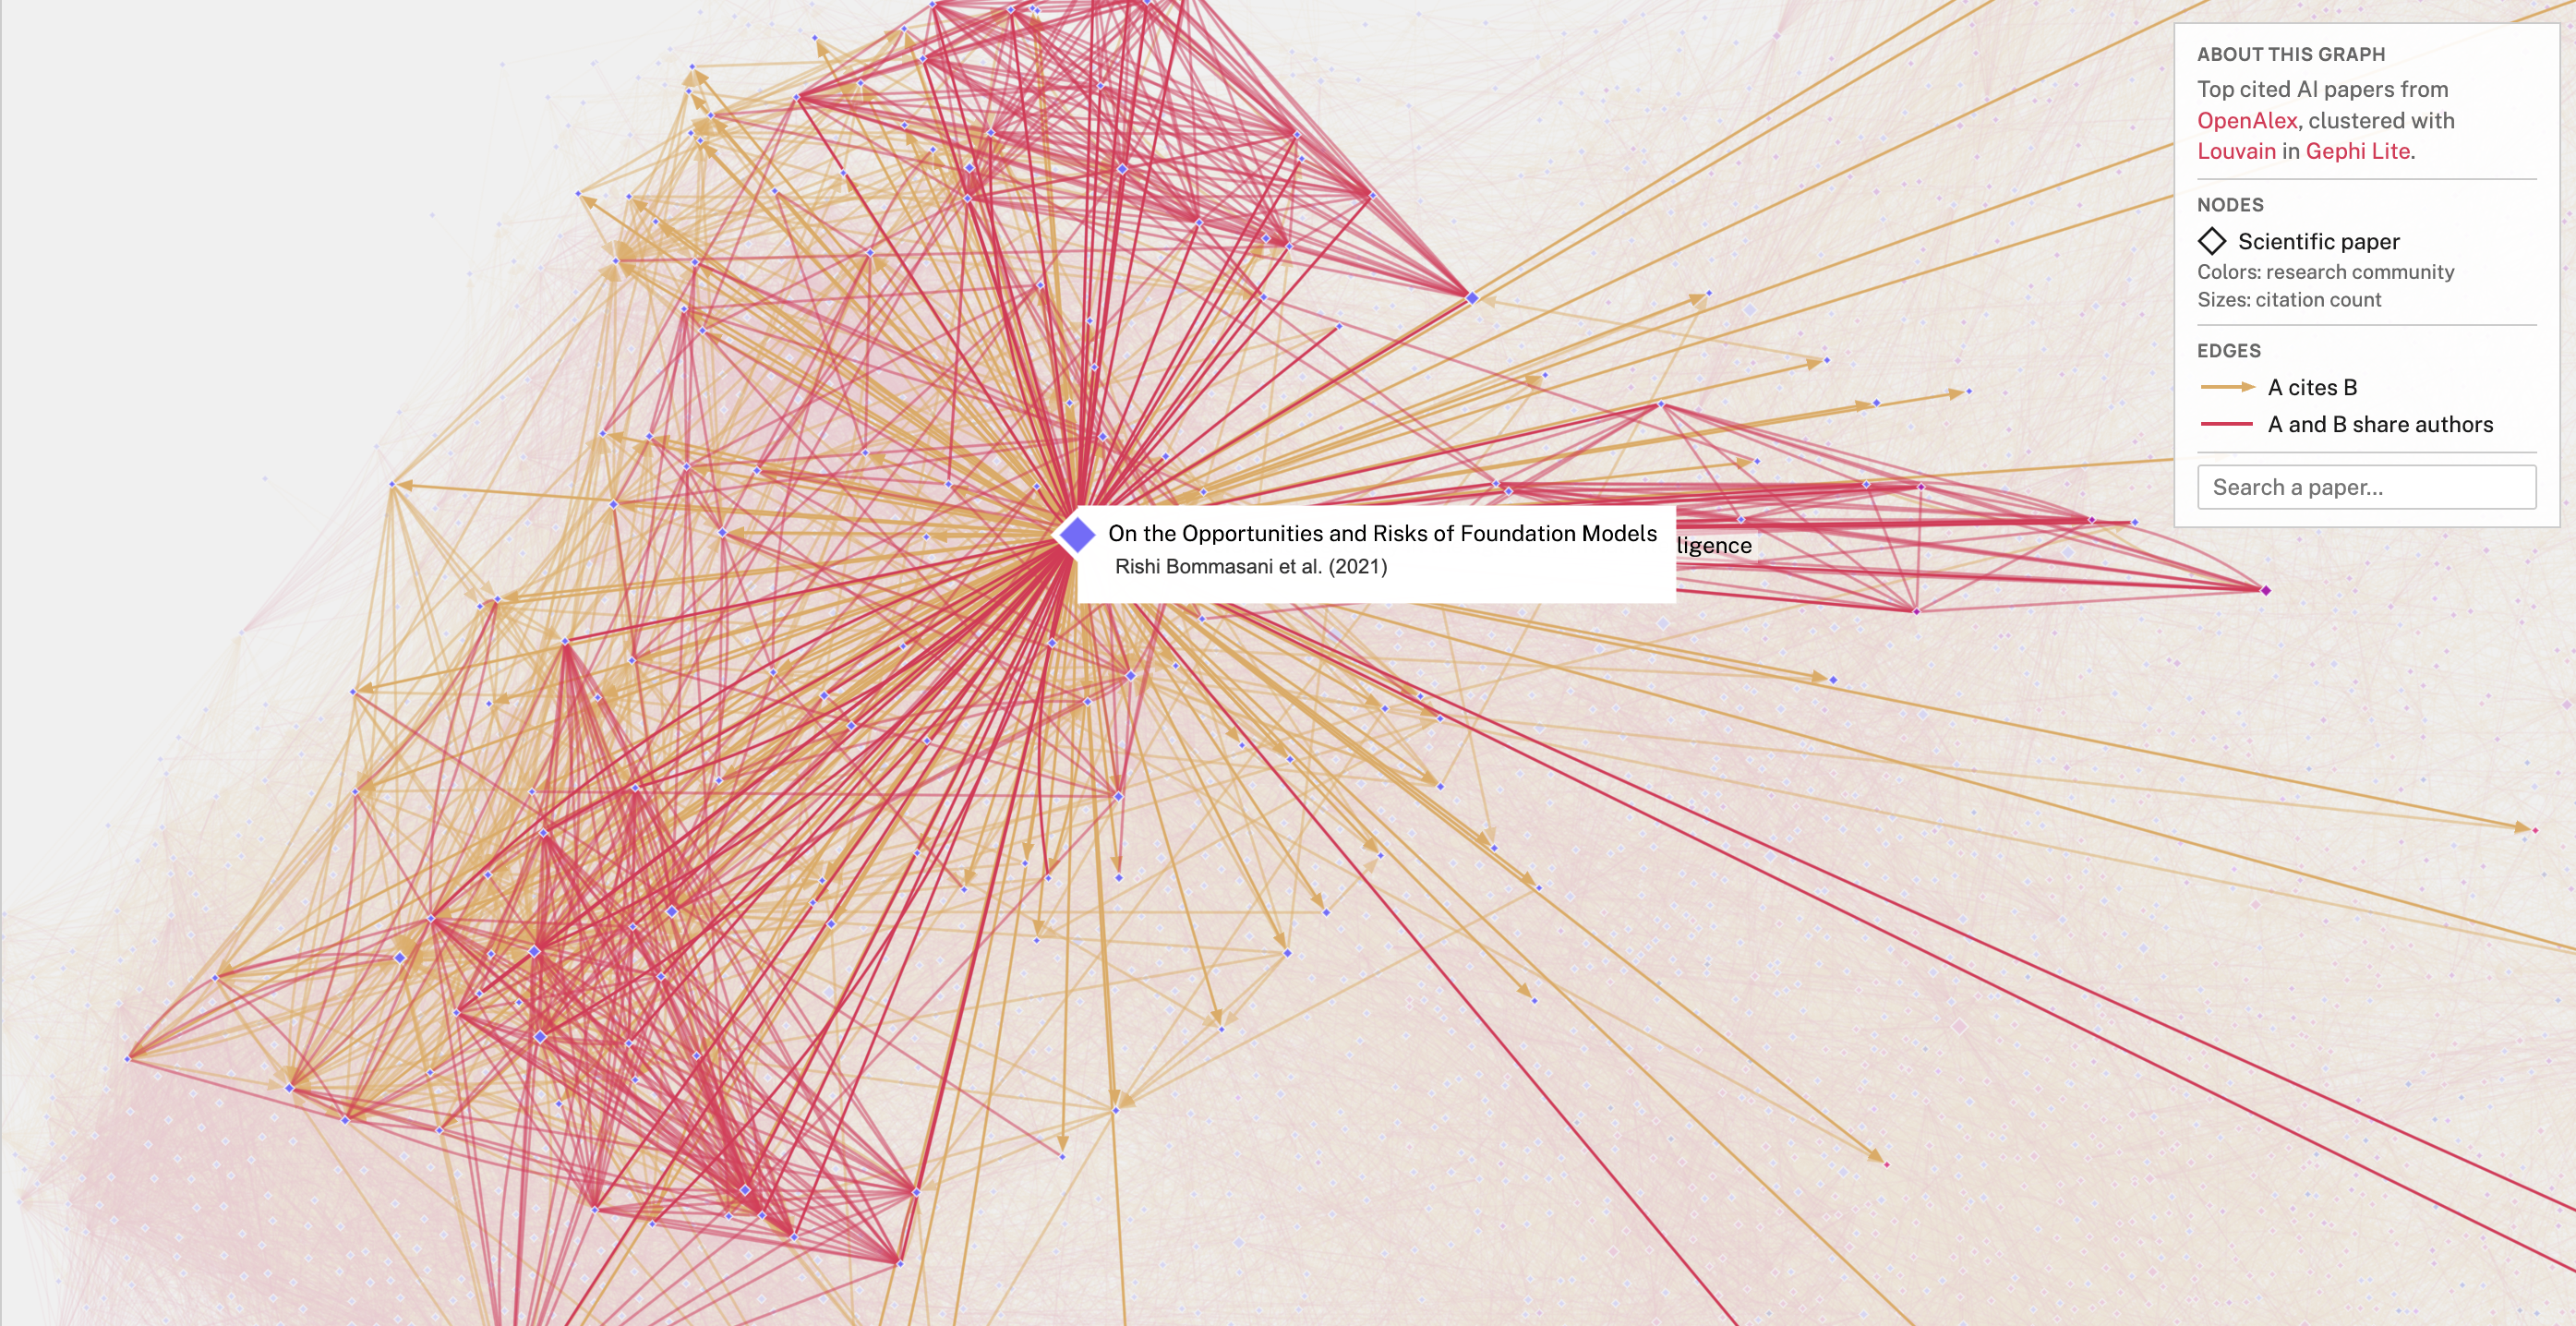
The gdotv Graph View, powered by SigmaJS, rendering a property graph with WebGL acceleration.
What Graph Visualization Is & Why It’s Going Mainstream
Graph visualization is the practice of drawing data as nodes and edges, providing a more visual interface than a table would, for instance. To put it simply, it’s a kind of diagram that shows connections – dots and lines.
Clusters, hubs, bridges, and the shortest path between two points are all but invisible in a result grid, and they jump out immediately in a well-laid-out network. It is a specific corner of data visualization with its own rules: force-directed layouts, edge bundling, community coloring, and the constant fight against displaying “hairballs” (very dense networks).
For a long time graph visualization was a specialist’s tool. That is changing fast, and three forces are driving it.
- Graph databases went mainstream. Once you store data as a graph in Neo4j, Amazon Neptune, Memgraph, or any of a dozen others, you eventually need to see it, and a table is a poor window onto connected data.
- Knowledge graphs and GraphRAG put graph structure in front of more engineers. Retrieval pipelines that walk a knowledge graph instead of a flat vector index need a way to inspect what they are walking.
- “Code as a graph” tooling arrived. A wave of projects now models a codebase as a graph of files, functions, and call relationships, and they all need to render it.
We have written before about where this is heading, that network visualization is on its way to becoming a commodity capability rather than a niche skill. The supply side of that story is the libraries doing the drawing. One of them is becoming the default for the web.
What Is SigmaJS & Where Did It Come From?
SigmaJS is an open-source JavaScript library for rendering large graphs in the browser with WebGL. It is published under the MIT license by the Sciences Po médialab and OuestWare. It also leans on a sister library, Graphology.
Graphology is the data layer. It plays much the same role in JavaScript that NetworkX plays in Python: an in-memory graph model paired with a broad library of algorithms for metrics, community detection, and even layout. And like NetworkX, it is built for breadth and convenience rather than very-large-scale crunching. The division of labor is clean: Graphology computes, SigmaJS draws.
SigmaJS has deep roots. Alexis Jacomy created it more than a decade ago at the médialab, the same research environment that produced Gephi. Gephi is the desktop application a generation of network researchers learned graph analysis on: open-source software for exploring and visualizing networks. It is still actively developed, with much of that work concentrated each year in Gephi Week, a focused community datathon whose 2025 edition was hosted by OuestWare in Nantes.
Around 2016, SigmaJS was rewritten to leverage WebGL for rendering, with the aim of handling large graphs with ease. Guillaume Plique led that effort, and built the companion Graphology library alongside it. Today OuestWare maintains SigmaJS together with the médialab, with Alexis Jacomy leading recent releases.
SigmaJS carries a long history and a lot of accumulated expertise. It was built by the same people, for the same audience as Gephi, but for Javacript. You can see that continuity in Gephi Lite, the browser version of Gephi, which the OuestWare team builds on SigmaJS. These are long-standing experts who have been building graph visualization tools for the better part of fifteen years.
SVG, Canvas & WebGL: The Tradeoff Every Renderer Makes
Every browser-based graph renderer has to pick how it paints the graph, and the choice sets a ceiling on everything else. There are three popular options that balance visual customizability versus scale in different ways, as you can see in the table below:
| Renderer | How it draws | Strength | Where it breaks down | Classic example |
|---|---|---|---|---|
| SVG | One DOM element per node and edge | Richest styling, full CSS, easy per-element interactivity | Slows down past a few thousand elements | D3.js |
| Canvas | Immediate-mode 2D raster | Good styling, far more headroom than SVG | CPU-bound in the tens of thousands | Cytoscape.js |
| WebGL | GPU shaders | Scales to hundreds of thousands of elements | Historically harder to customize visually | SigmaJS |
SVG gives you the most freedom because every element is a real DOM node you can style with CSS, attach handlers to, and fill with arbitrary markup. The cost is that the browser has to manage thousands of those nodes, and it falls over well before you reach the graph sizes that matter for real datasets.
Canvas trades some of that per-element freedom for a higher ceiling. You draw to a single raster surface instead of a tree of DOM nodes, which is why Cytoscape.js, which renders on HTML5 Canvas by default, handles bigger graphs than an SVG approach. It is still CPU-bound, though, so it too has a wall, just a further-out one.
WebGL pushes the drawing onto the GPU. That is why SigmaJS can render graphs in the tens and hundreds of thousands of elements while staying interactive. The historical catch is the one we ran into: when you are writing shaders instead of styling DOM, rich per-element customization like fancy labels, hover cards, and bespoke node shapes is harder to express. That is the exact tradeoff that pushed us off CytoscapeJS and onto SigmaJS: the scale ceiling mattered more to our users than the styling convenience.
Linkurious, who build a commercial library on the same WebGL foundation, frame this the same way.
SigmaJS In The Wild
As advocates (and sponsors) for SigmaJS, we’re always excited to see more organizations and products adopt this graph visualization framework. The gdotv team has been running into an increasing number of projects using SigmaJS, and you probably have too. Here are some interesting projects that use SigmaJS, some as of just this year.
First of all of course there’s gdotv – but you already knew that! We’ve been proud SigmaJS users since 2023.
The highest-authority sighting is Microsoft Fabric. The graph experience inside Microsoft’s flagship analytics platform renders with SigmaJS. There is no press release naming the library, but the rendering is unmistakable once you have spent time with it, with the node and edge drawing carrying SigmaJS’s distinctive visual signature.
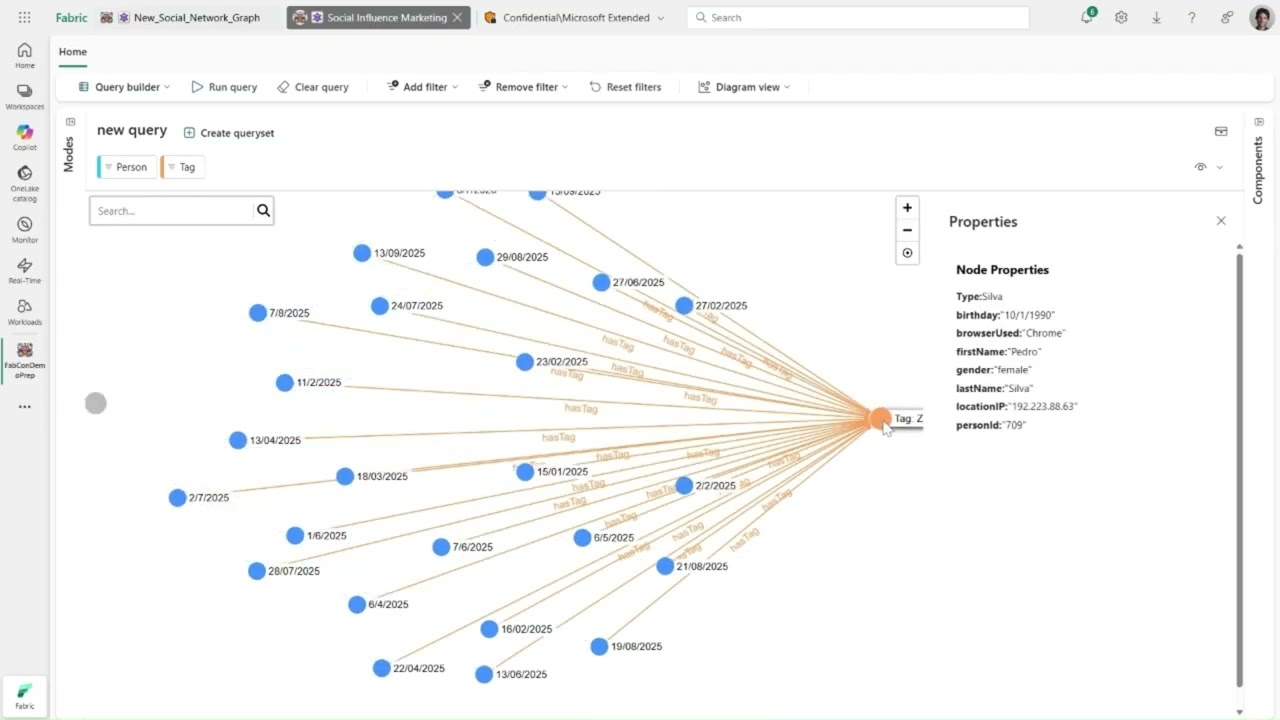
Graph visualization in Microsoft Fabric. The WebGL rendering is recognizably SigmaJS.
The fastest-growing trend we’ve witnessed is code knowledge graphs, where graph visualization is now a core component.
- GitLab Knowledge Graph indexes a repository’s files, classes, functions, and their relationships into a property graph. Its frontend depends on SigmaJS directly. The
package.jsondeclaressigma,graphology, andgraphology-layout-forceatlas2, the same stack we run on. - GitNexus builds an interactive code knowledge graph for any Git repository entirely in the browser, again on SigmaJS and Graphology.
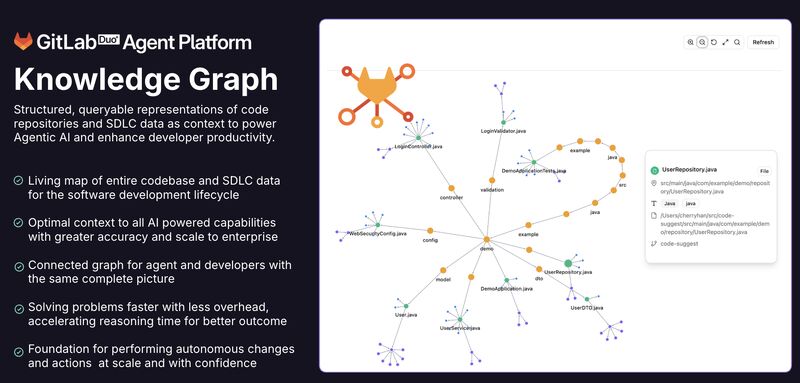
The GitLab Knowledge Graph renders a repository’s files and functions as a SigmaJS graph. Source: GitLab, used with attribution.
There are others too. Surrealist, the IDE for SurrealDB, adopted SigmaJS for its graph result mode, plotting query results into a force-directed view with full control over appearance. And BloodHound, the attack-path analysis tool that nearly every penetration tester has used to map Active Directory, renders its graphs on SigmaJS too.
These are not isolated sightings, and the numbers back it up. As of June 2026, SigmaJS pulls close to 250,000 downloads a week on npm. In June 2025, that number was just around 30,000 downloads, so that’s a near 10x increase in a year.
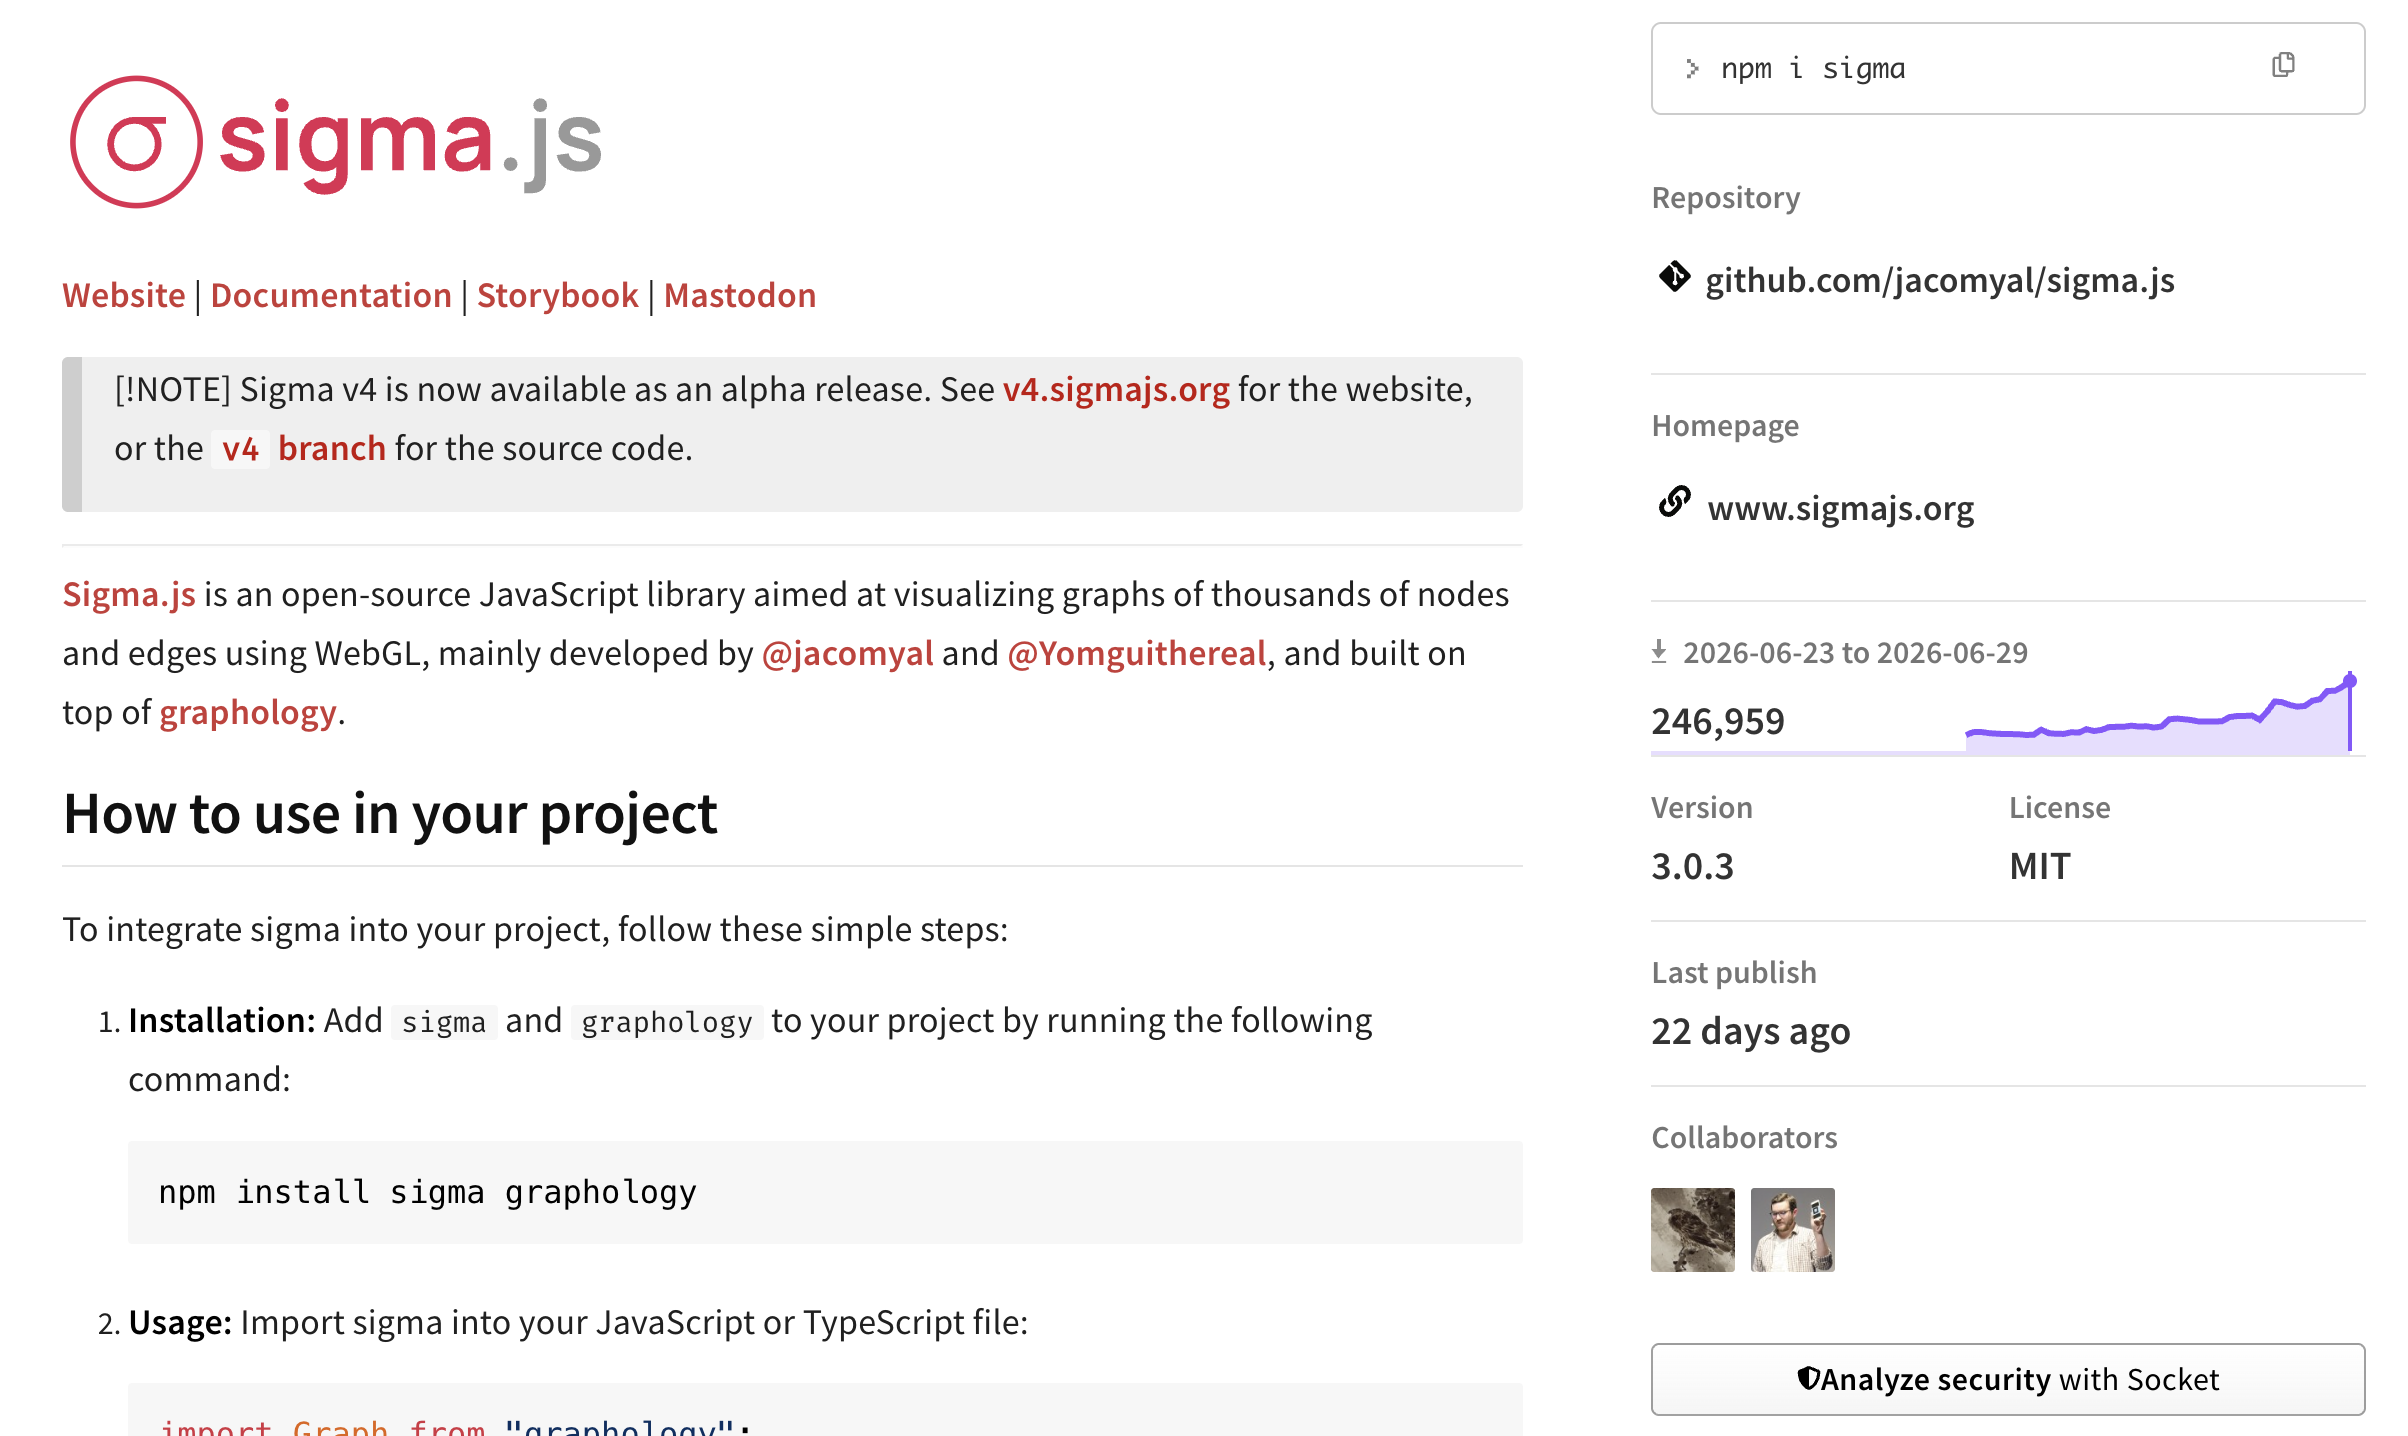
SigmaJS weekly downloads on npm, approaching 200,000 and trending up. Source: npm, June 2026.
Why We Sponsor SigmaJS: Funding v3 & v4
We don’t just use SigmaJS, we fund its development. gdotv has been a proud (and very happy) sponsor of SigmaJS since late 2023.
The first project was v3, which shipped in March 2024 and focused on performance: rendering larger and more complex graphs, and processing updates faster. It also collected the kind of incremental refinements that mark a maturing library, curved edges among them, which had simply not been possible in v2.
This post is the first time we are publicly mentioning the second project: we are sponsoring the development of SigmaJS v4, which is currently in alpha.
v4 is the release that closes the customization gap, and it does so from two directions at once. First, it improves what you can express in WebGL natively. Second, and this is the part that matters most for the tradeoff above, it introduces a hybrid approach. That approach brings DOM and CSS back into the picture for the things WebGL was always weakest at. Labels and hover cards, in particular, can now lean on SVG-style rendering for richer presentation, while the bulk of the graph stays on the GPU. In other words: you keep WebGL’s scale and buy back the visual flexibility you used to leave behind with Canvas or SVG. That is the tradeoff from the top of this post, resolved.
SigmaJS v4’s hybrid rendering brings DOM and CSS back for labels and hover cards, the customization WebGL alone made hard. Source: SigmaJS, used with attribution.
Our role in that is deliberately narrow. The SigmaJS team has the vision and the expertise; we provide funding and stay out of the way. We are not steering the roadmap or specifying features. We are backing people who have earned the right to decide where the library goes, and helping them get there faster.
What About Commercial Libraries?
There is a tier above the open-source libraries that deserves a mention. Ogma from Linkurious, yFiles from yWorks, and KeyLines from Cambridge Intelligence are incredibly powerful, commercial graph visualization SDKs, but come at a cost.
They are top of the line graph visualization libraries: sophisticated automatic layout engines, geospatial and timeline modes, polished interaction models, and a support relationship with a team whose entire business is making graphs legible. For a company whose value proposition is built around graph visuals and analytical workloads (e.g. fraud investigation, intelligence, network-management,etc) , they’re a long term investment worth considering.
Our investment in SigmaJS aims to narrow the gap with commercial libraries for everyone. There’s still plenty of work to do though and if you’re building in this space, you should consider sponsoring SigmaJS too. Alternatively since it’s open source, you can get involved in its development!
Build vs Buy: Where gdotv Fits
If you have graph data that you need to visualize, here’s a breakdown of your options:
| Path | What you get | What it costs | Best for |
|---|---|---|---|
| Build with SigmaJS | Full control of a free, open-source engine | Engineering time: layouts, interactions, theming, database connectors, ongoing maintenance | Teams where graph visualization is core to the product and they want to avoid vendor lock in or stay within budget |
| Build with a commercial SDK | Deep layout, geospatial and timeline analysis, vendor support | A significant license and integration development | Teams whose product itself is graph visualization at scale |
| Use gdotv | SigmaJS-grade visualization plus database connectors, query editing, and styling out of the box | A license | Graph database users who want results now, not a viz project |
Building on SigmaJS is a great choice, and we would be poor advocates for the library if we pretended otherwise. It’s free, feature rich and if visualization is the thing you are selling, you should consider it.
But most teams with a graph database do not want to build a visualization product. They want to connect, query, and see. Buying changes the math here. You could pay engineers to assemble layouts, interactions, theming, and database connectors, then maintain all of it indefinitely. Or: simply pick up gdotv.
You’ll be up and running in minutes and access a continuously evolving product that invests heavily in the field. That means faster time to delivery, and a lower total cost of ownership than a home-grown or commercial viz layer that keeps costing you long after the initial build.
And we have more on the way. We are building an enterprise edition of gdotv that will let you embed our graph visualizations directly into your own applications, with tight security controls, among many other capabilities. If that is on your roadmap, stay tuned.
In Conclusion: Open-Source Graph Visualization Just Keeps Getting Better
Web graph visualization has always been a balance between scale and flexibility. WebGL used to deliver scale at the expense of flexibility. That is the tradeoff we encountered when we moved gdotv off Cytoscape, and it is the one every team faces the moment their graphs get sizable. SigmaJS v4 is what the negotiation looks like when it finally goes your way: GPU performance and rich, customizable visuals, in the same renderer.
That is also why we put money behind it. As a graph technology company, the health of the open-source visualization commons is our health too, and SigmaJS is the best of that commons.
If you have a graph database and you would rather explore it than build a renderer for it, then gdotv is for you. Download it and point it at your graph, or spin it up from the AWS, GCP, or Azure marketplaces, the same SigmaJS-powered WebGL view, connected to your data, in a few minutes.

")