Dashboard
Introduction to Dashboards
Dashboards can be used to display multiple pieces of information in a variety of formats. A Dashboard is comprised of one or more Dashboard Panels which can be widely customised. In most cases, Dashboard Panels will be utilised to show the results of Queries, which you can read more about in the Query Editor section.
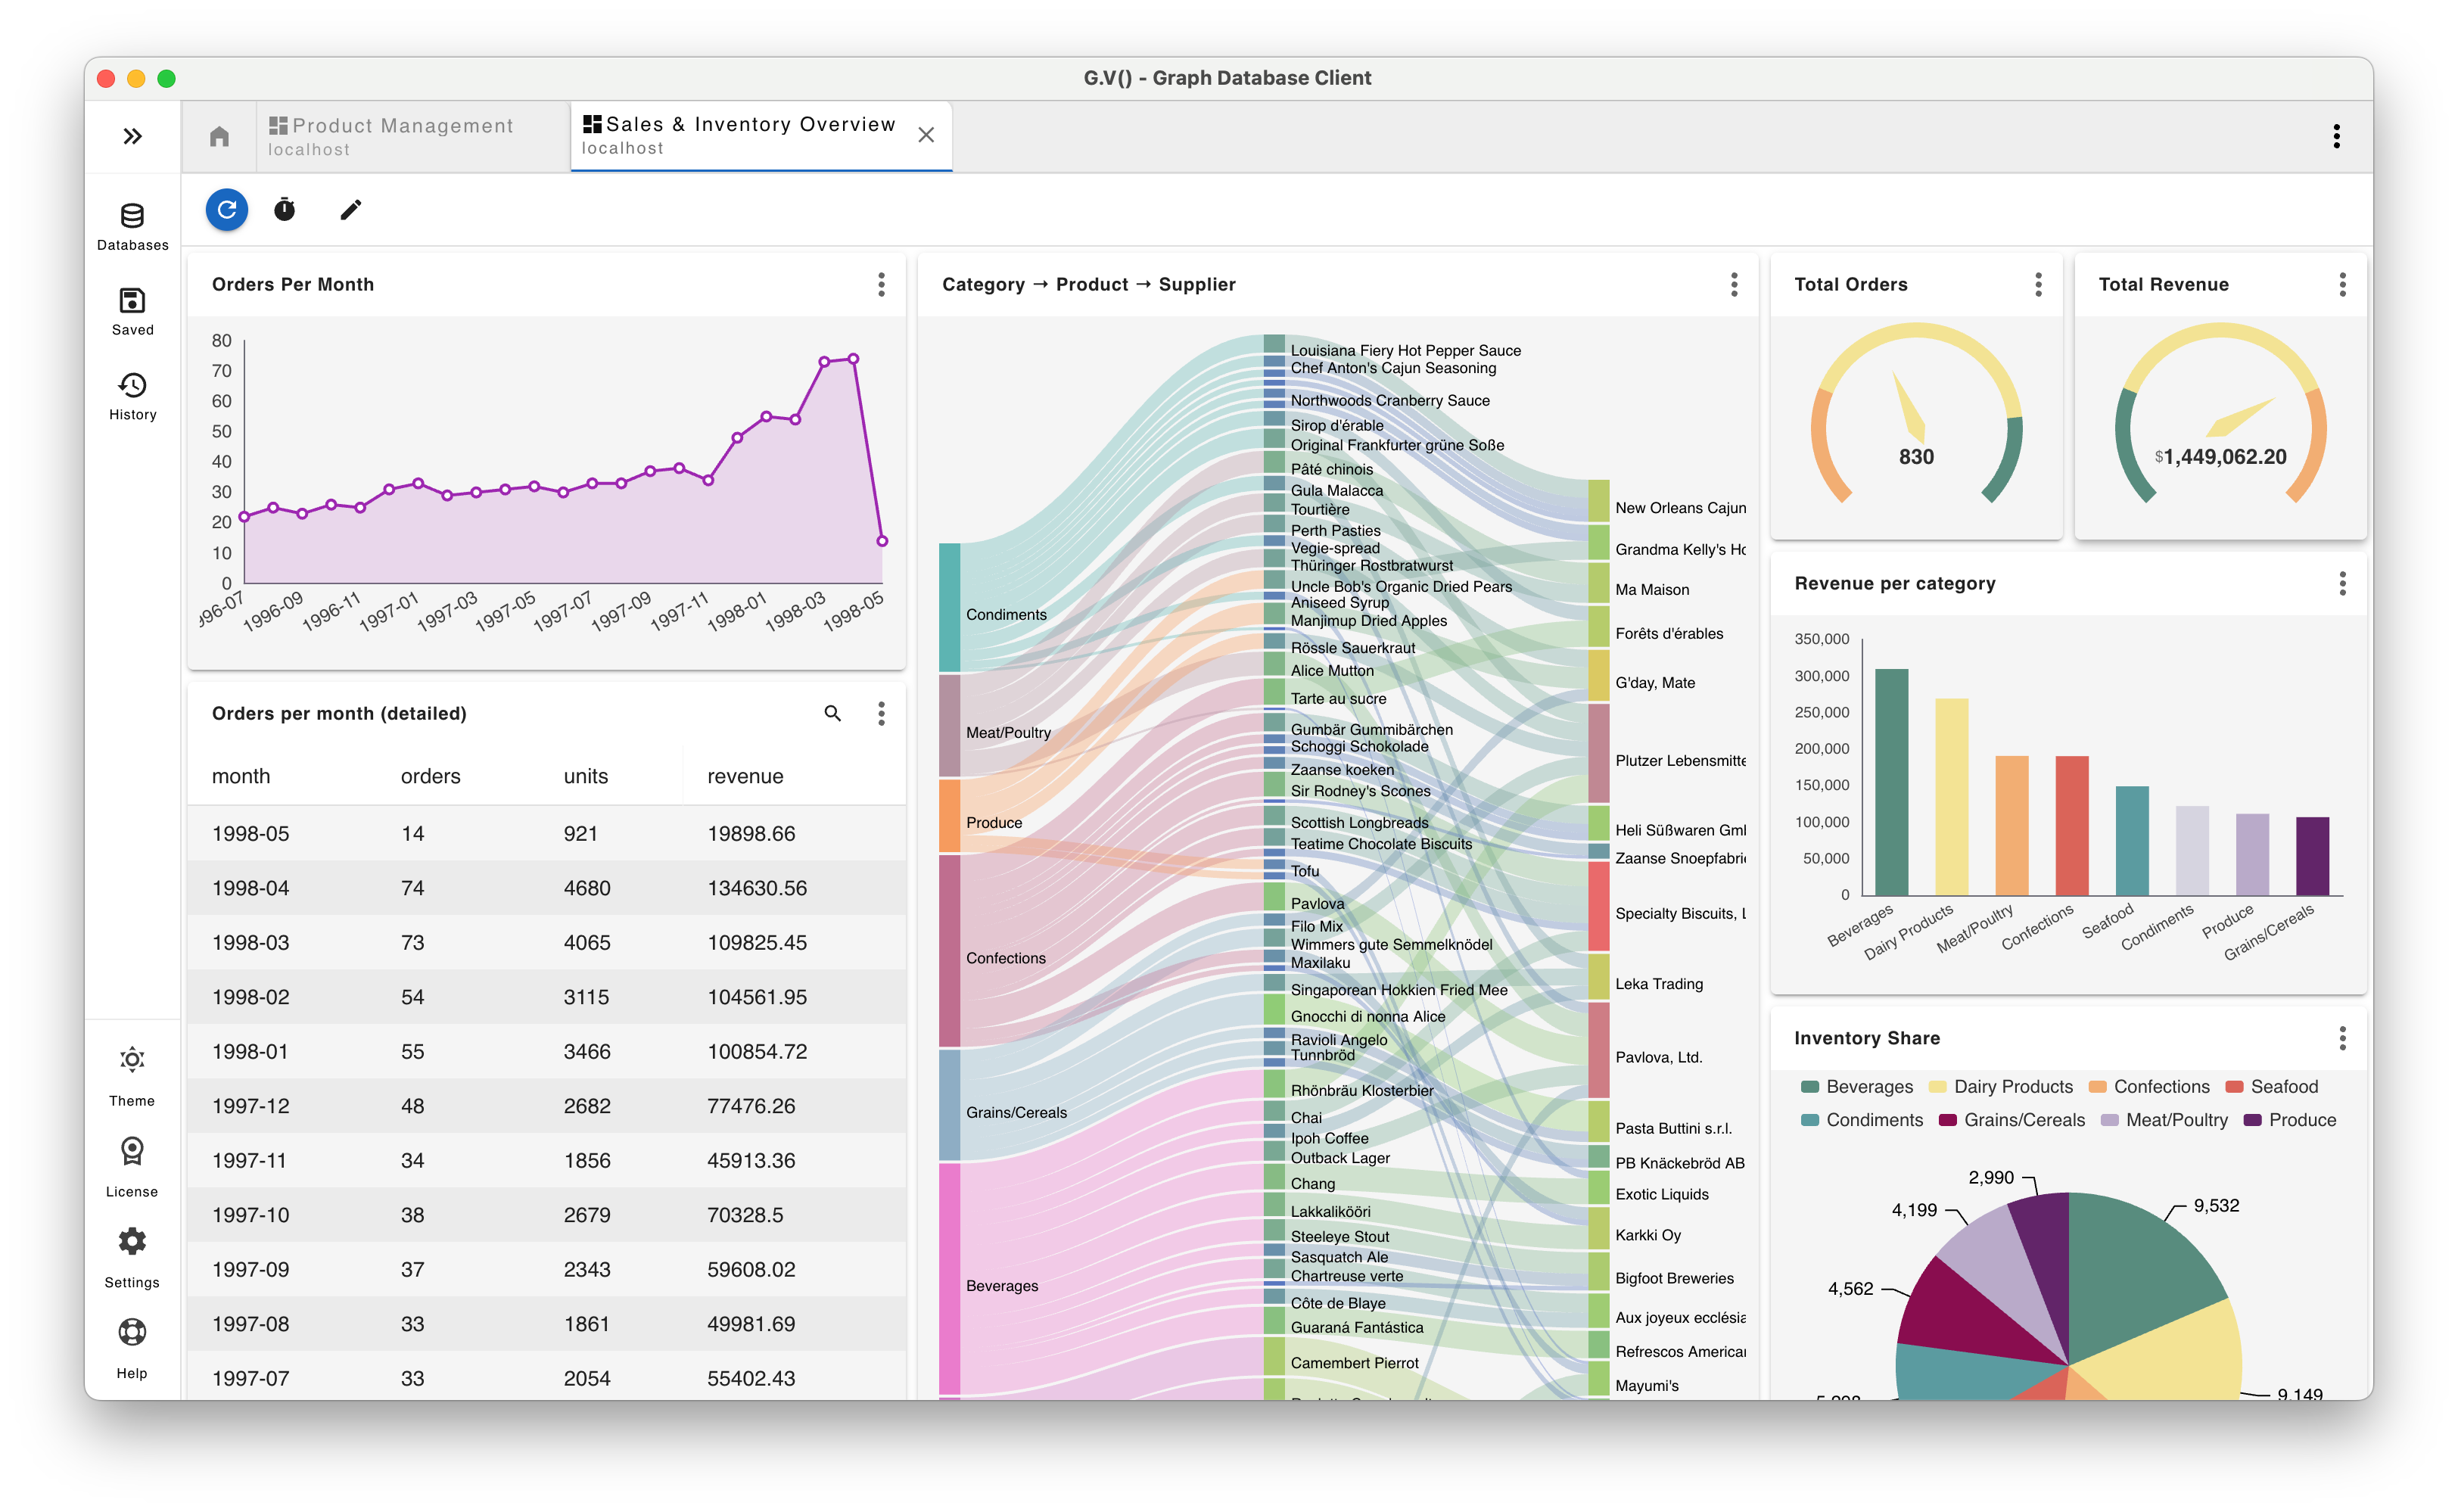
Below is an example of a dashboard in gdotv with various panels set up.
How to Create a Dashboard
To create a Dashboard, select a connection from the side menu and click on ' New Dashboard'. A new Dashboard is created as your draft, with the following screen:
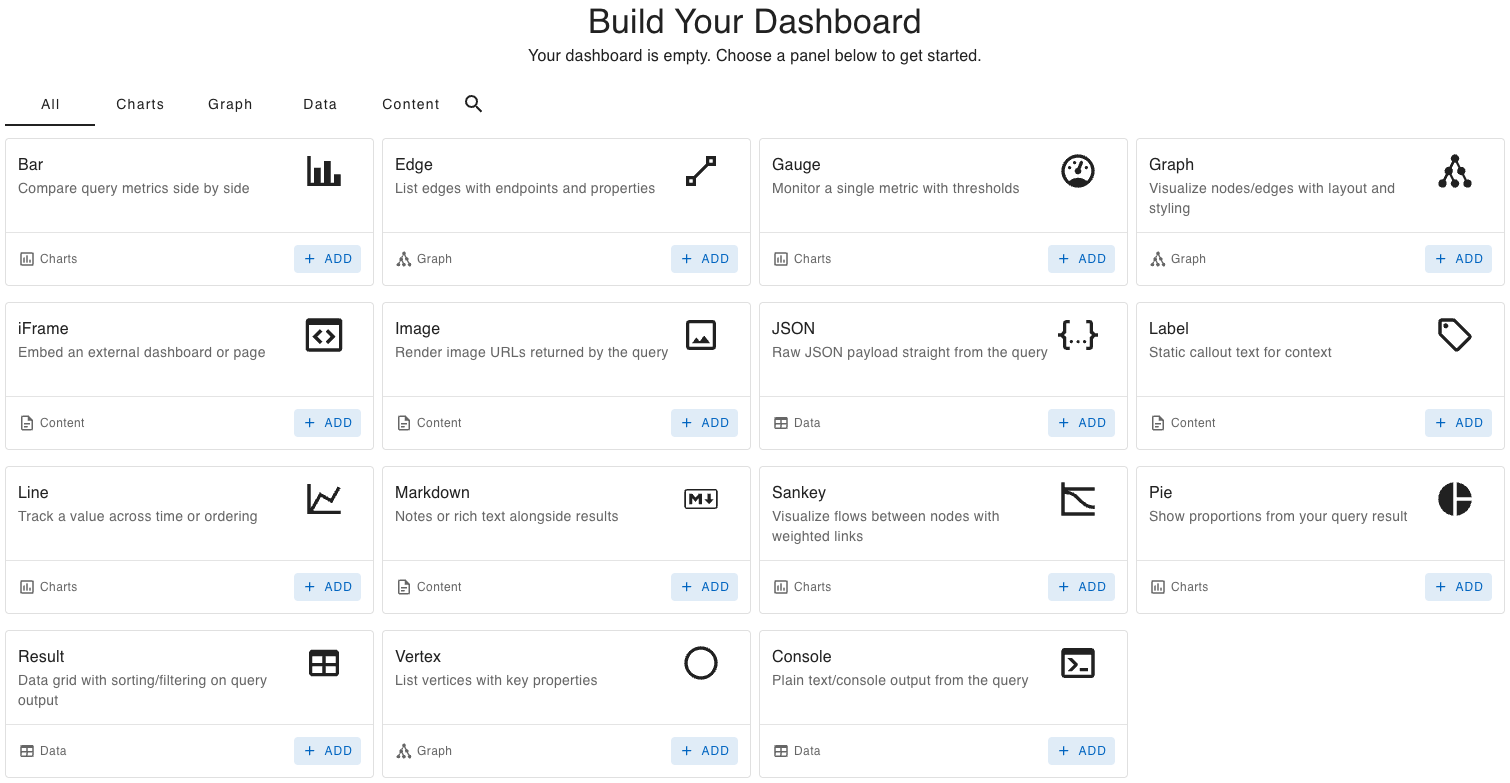
Select which type of Panel you'd like to add first, and an edit window will open for that Panel type.
Dashboard Panels
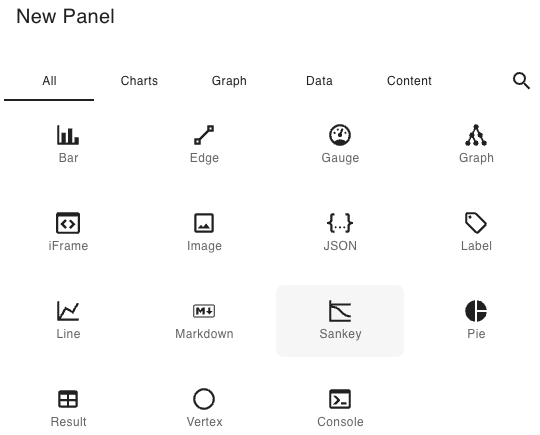
There is currently a range of 15 Panel types to choose from. These are organised into 4 groups: Charts, Graph, Data and Content. To add a Panel, click on Add › Panel… in the toolbar.
Most Panel types require a query that will retrieve the data to be turned into a chart or graph of some kind. The type of query or input required will vary depending on the Panel type, and is stated below the Panel title. A dropdown of Example Queries is available in the Query Editor toolbar for each Panel type.
To view the expanded query editor in fullscreen mode, click on 'Open in Query Editor' . You can also use this window to run your query and view the results as you would from a normal query tab. Here there is a 'Return to Dashboard Editor' button in the top right.
To resize a Panel, click and drag the resize icon in the bottom right of the Panel .
To move a Panel, simply click and drag while in Edit Mode.
Dashboard Panel Menu
At the top right of each Panel is a menu with the following options:
- View Serialized Result / Return To Chart : Toggles between displaying the query's serialized JSON result and the Panel's actual display.
- View / Exit Fullscreen / : Toggles fullscreen mode.
- Edit (Edit Mode only): Opens the panel's edit window.
- Refresh : Refreshes the results of the panel.
- Edit parameters (panels whose query uses variables): Sets this panel's own values for the dashboard's parameters. A panel using its own values shows a warning dot on its menu button.
- Use dashboard values (View Mode, when the panel uses its own values): Brings the panel back to the dashboard's parameter values.
- Copy Panel Share Link (View Mode, web): Copies a link that opens this panel on its own, with the parameter values it shows.
- Delete Panel (Edit Mode only): Deletes the panel. Discard changes brings it back until you save.
Dashboard Toolbar
The toolbar sits above the panels, with the Dashboard's name on the left.
When the Dashboard is in View Mode, the following controls are available:

- Refresh Dashboard : Re-runs all of the queries to provide up-to-date info.
- Auto-Refresh : Automatically refreshes every panel at a chosen interval (Off, 15s, 30s, 1m, 5m, 15m).
- Filters (dashboards with parameters): Shows or hides the filter bar. Default values are set in Parameters… (Edit Mode).
- Copy Share Link (web, published dashboards): Copies a link that opens the Dashboard with the filter values it shows.
- Edit : Opens your draft of the Dashboard in Edit Mode (see Drafts).
- Publish (drafts only): Makes the draft live.
In View Mode you can properly interact with all the panels - for example, hovering over a graph will show detailed information, and links on iFrame panels will be clickable.
When the Dashboard is in Edit Mode, the toolbar shows the editing controls instead:

- Add : Adds a panel (the New Panel dialog), a Markdown text panel or a tab.
- Layout : Optimize (compact) organises panels to use space efficiently without resizing them. Fixed layouts (full-width rows, 2, 3 or 4 columns) give a grid-style view.
- Undo / Redo : Undoes or redoes the last layout change (also Ctrl/Cmd+Z and Shift+Ctrl/Cmd+Z).
- Discard changes : Brings the Dashboard back to its last saved state, deleted panels included.
- Save : Save draft (Ctrl/Cmd+S) saves your changes to your draft. Save and publish (Shift+Ctrl/Cmd+S) saves them and makes the draft live for everyone on the connection. When there is nothing new to save but your draft holds saved changes that aren't live yet, the button reads Publish.
- Preview : Shows a live preview of the Dashboard before you publish it, without saving anything. An Unsaved changes label stays in the toolbar while you preview; Edit goes back to your changes.
- More : Rename…, Parameters…, Discard draft and, for a draft of a published dashboard, Delete dashboard.
You can also click the Dashboard's name to rename it.
Dashboard Tabs
A Dashboard can spread its panels over several tabs. In Edit Mode:
- Add › Tab adds a tab.
- Double-click a tab, or right-click it and choose Rename Tab, to rename it.
- Drag a tab to move it, or right-click it and choose Move Left or Move Right.
- Right-click a tab to close it, the others, the tabs to its left or right, or all of them. Closing tabs deletes their panels, so gdotv asks first; Discard changes brings them back until you save.
In View Mode the tabs show when there are two or more.
Drafts
You edit a Dashboard through a draft: a private working version that only you can see. The live Dashboard, the one everyone on the connection opens, doesn't change until you publish your draft.
- Edit on a published Dashboard opens your draft of it, and starts one if you have none. A draft you open and leave without changes is deleted again, so just looking leaves nothing behind.
- A new Dashboard, and a duplicate of one (Duplicate), starts as your draft.
- Save and publish, or Publish while viewing a draft, makes it live. If someone published the Dashboard again since your draft started, gdotv asks before replacing their version.
- Discard draft permanently deletes the draft. The published version stays as it is.
- Your drafts are listed under Drafts in the connection's Dashboards section. A published Dashboard you have a draft of shows a Your draft link next to its name.
- AI agents connected to gdotv over MCP edit Dashboards through the same drafts, so you and an agent working for you share one draft. If an agent publishes your draft while you have unsaved changes, your changes are kept in a new draft.
A draft can't be shared: copy the share link of the published Dashboard instead.
Dashboard Panel Types
Panels are arranged into four different sections: Charts, Graph, Data and Content.
Bar (Chart)
Compare query metrics side by side. Displays the query result as a bar chart.
Requires query results with at least two columns: one for categories (e.g., strings, numbers, dates) and one for numeric values (e.g., counts, sums, averages).
Return tabular records. Numeric columns become bar series; non-numeric columns define category axes.
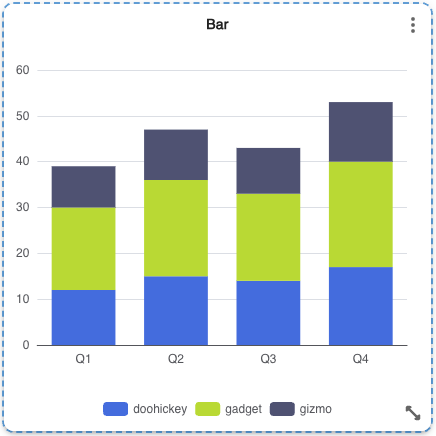
After successfully submitting your query, gdotv will select the first variable from your query to use for the x-axis, and will display all other variables as values. These can be all customised. The number of points on the x-axis will always equate to the number of items in that array, whether the lengths of the value arrays matches or not.
Below is an example of valid query output and the resulting Bar chart:
Gauge (Chart)
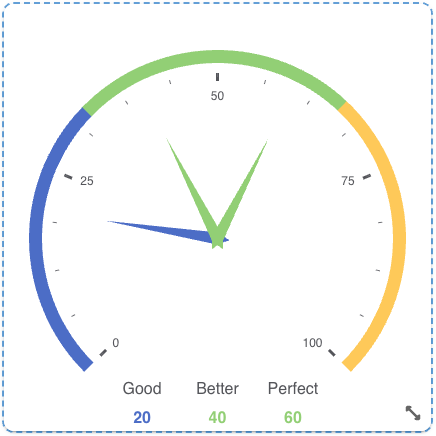
Gauge surfaces one or more key metrics as needles over a bounded range, with colored threshold bands for instant context. It’s built for “at‑a‑glance” health, capacity, and SLA tracking, and supports multiple values in a single panel.
Return one or more numeric values. Supported patterns include scalar values, name/value or label/value records, label + numeric field records, and numeric key/value maps. Optional fields: min, max.
Below is an example of valid query output and the resulting Gauge chart:
Line (Chart)
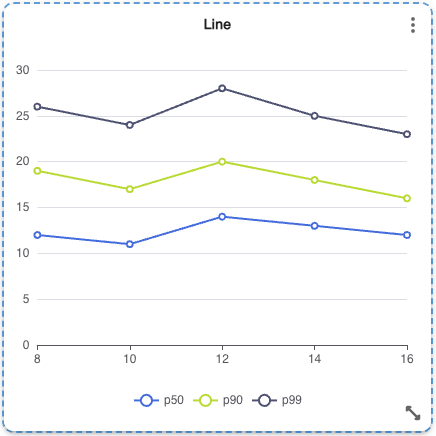
Track trends over time or ordered sequences with one or more series plotted on a single chart.
Requires query results with a sequence/time column and one or more numeric value columns.
Return tabular records. Numeric columns become line series; non-numeric columns define x-axis categories.
After successfully submitting your query, gdotv will select the first variable from your query to use for the x-axis, and will display all other variables as values. These can be customised from the menus at the top of the panel. The number of points on the x-axis will always be the number of items in that array, regardless of whether the arrays making up the values are the same length.
Below is an example of valid query output and the resulting Line chart:
Sankey (Chart)
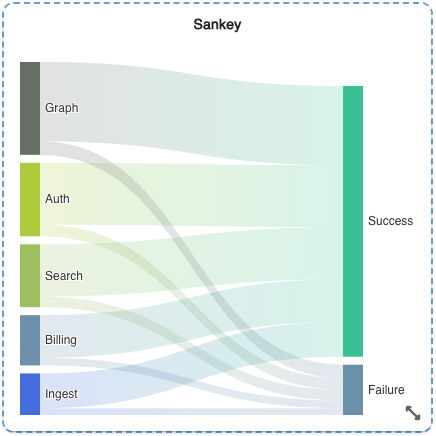
Show how values move from one step to the next. The thicker the link, the larger the flow. Use this to spot the biggest paths and where volume drops.
Requires query results with source, target, and numeric value columns for each flow.
Return flow records with source, target, and numeric value. You can return an array of links directly, or an object with links/edges/relationships plus optional nodes/data.
Below is an example of valid query output and the resulting Sankey chart:
Pie (Chart)
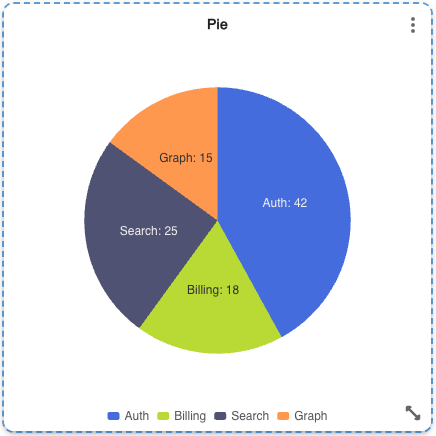
Show proportions from your query result. Displays the query results as a pie chart.
Requires query results with two columns: a category label and a numeric value.
Return numeric values with optional labels. Supported patterns include scalar values, name/value or label/value records, label + numeric field records, and numeric key/value maps.
Below is an example of valid query output and the resulting Pie chart:
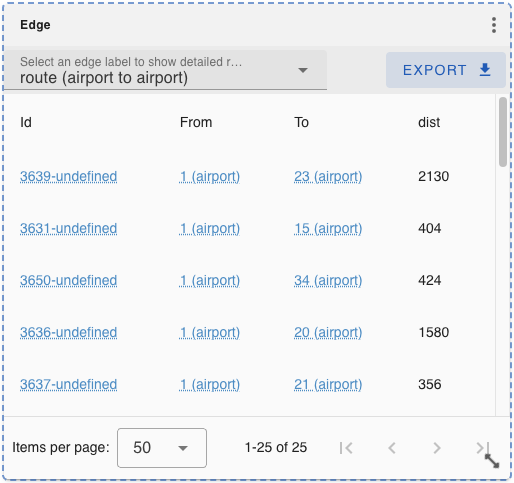
Edge (Graph)
List edges with endpoints and properties.
Requires edge results. Any edges in the query output will be displayed as a table using edge property names as columns.
In the results window you can filter between edge labels to show detailed results for, group results by different column headers, and filter the results in a variety of ways. By default, the results are grouped by Label.
For more details, refer to Edges View.
Below is an example of valid query output and the resulting Edge table:
Graph (Graph)
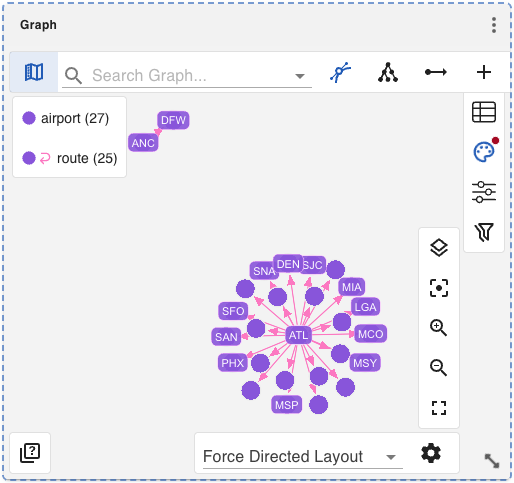
Visualize nodes/edges with layout and styling. Displays the results of your query as a graph view, allowing you to visualize your query output. For more details, refer to Graph View.
Requires graph results (vertices/edges).
Below is an example of valid query output and the resulting Graph view:
Vertex (Graph)
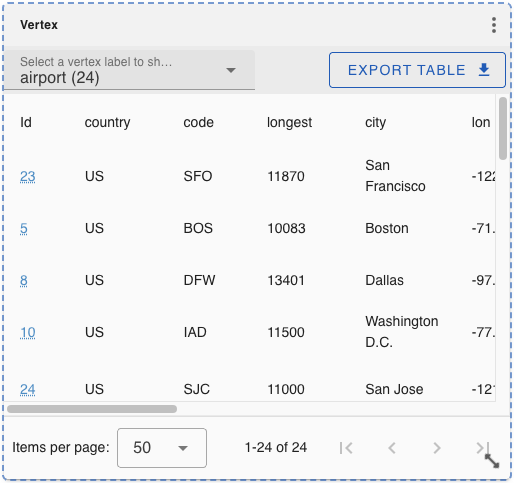
List vertices with key properties.
Requires vertex results. Any vertices in the query output will be displayed as a table using vertex property names as columns.
In the results window you can filter between vertex labels to show detailed results for, group results by different column headers, and filter the results in a variety of ways. By default, the results are grouped by Label.
For more details, refer to Vertices View.
Below is an example of valid query output and the resulting Vertex table:
JSON (Data)
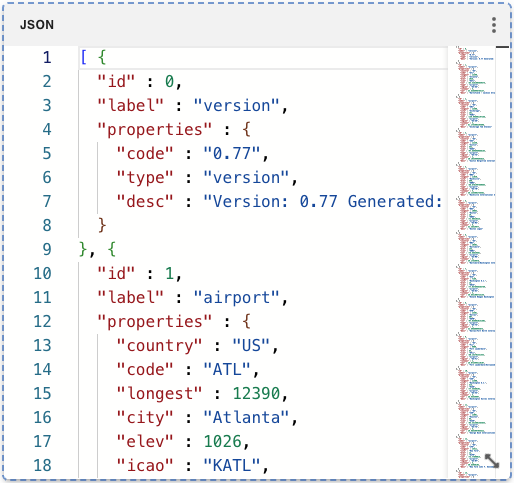
Raw JSON payload straight from the query. Displays a prettified version of the query's raw JSON result. For more details, refer to JSON Formatted Output.
Any query output; displayed as raw JSON for inspection.
Below is an example of valid query output and the resulting JSON output:
Result (Data)
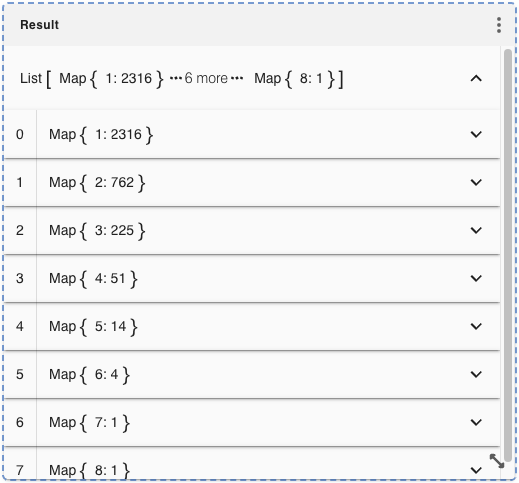
Data grid with sorting/filtering on query output. Displays the query's results as a hierarchical view that can be filtered and navigated easily.
Requires tabular rows.
Below is an example of valid query output and the resulting Result output:
Console (Data)
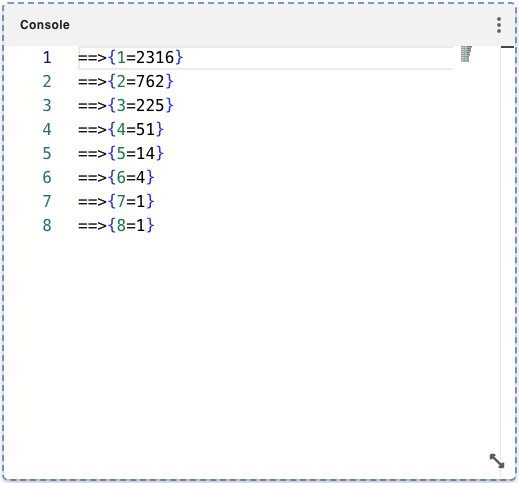
Plain text/console output from the query. Displays the raw output of your query as would be available on the Gremlin Console. For more details, refer to Gremlin Console Output.
Below is an example of valid query output and the resulting Console output:
Iframe (Content)
Embed an external dashboard or page. Displays a web page loaded from a URL.
Requires an embeddable URL as a direct value, first array item, or first object field.
Below is an example of valid query output and the resulting Iframe:
"https://status.github.com/"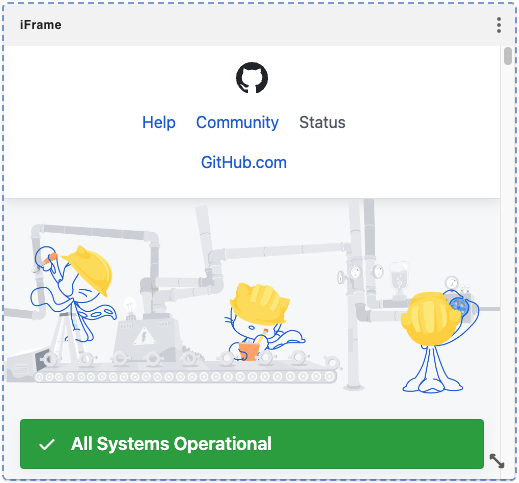
Image (Content)
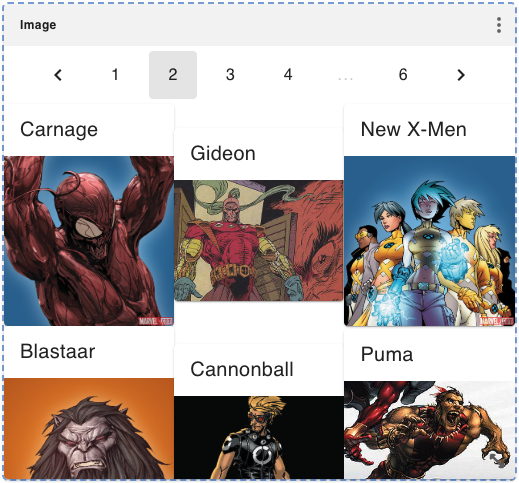
Render image URLs returned by the query. Displays one or more images loaded from image URL's in the database, optionally with a name and/or description. The name and description are dependent on the query.
Return image URLs as a single string, an image record, or a list of image strings/records.
Images are displayed in a gallery with up to 9 images per page, with names displayed above the image. Clicking on an image will open it full-size.
Below is an example of valid query output and the resulting Image view:
Label (Content)
Static callout text for context. Displays the results of your query as a label.
Requires a single string value (first row/column) to display as a label.
Return a label value directly, as the first array item, or from label/text/value/entry fields. Segmented labels are also supported.
Below is an example of valid query output and the resulting Label view:
2316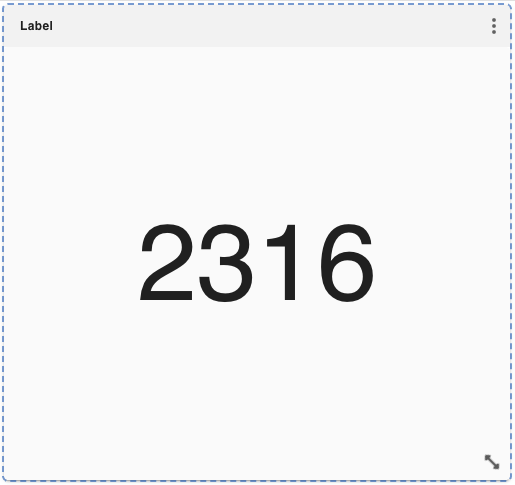
Markdown (Content)
Notes or rich text alongside results. Displays what you have entered in Markdown.
Write notes directly in the editor; no query required.
https://markdown-it.github.io/
Below is some example input and the resulting Markdown output window:
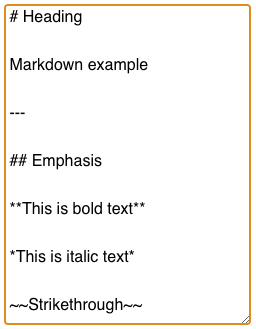
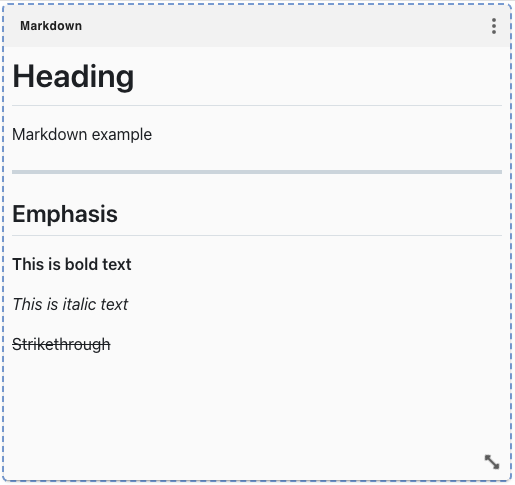
Validation of query output for a dashboard panel
If the query you create for a Dashboard type does not meet the results specification of the type, there will be warnings displayed to indicate what parts of the records returned by the query don’t comply with the requirements of the Dashboard type. A green warning icon indicates that the query is partially incorrect, but it still runs. A red warning icon indicates that the query has failed to run. Click on the warning icon to view detailed information, or to toggle the serialized result.
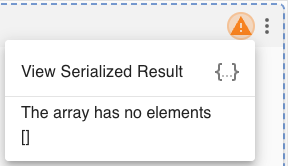
Using Query Variables in Your Dashboard
Panel queries can use variables ($name in Cypher, GQL, SPARQL and SQL, a bare name in Gremlin). Each variable name is a dashboard parameter: the filter bar above the panels shows one filter per parameter, and changing a filter re-runs every panel that uses it. A parameter with a default value applies as soon as the dashboard opens; a required parameter without one shows a field on the panels that need it.
By making use of gdotv's split tabs feature, you can even have two of the same Dashboard open side by side with different parameter values.
Dashboard Parameters
The dashboard keeps its own settings for each parameter, and they win over the settings in the panel queries. In Edit Mode, open Parameters… from the filter bar's settings or the toolbar's menu to:
- Reorder the filters of the filter bar.
- Edit a parameter's settings (type, default value, input widget, choices, bounds, label). The change applies to every panel that uses the parameter. Changing a variable's settings in a panel's editor changes the dashboard's parameter in the same way.
- Hide a parameter, making it a constant: it has no filter, a link cannot change it, and every panel runs with its default value.
A warning icon marks a parameter that one of the panels reads with another type than the dashboard's; edit the parameter to give every panel the same type.
Panel Values and Links
A panel can use its own value for a parameter (Edit parameters in its menu) until the dashboard's value changes or you choose Use dashboard values. The address of a dashboard and its share links carry the parameter values that differ from their defaults, as p.<name>=<value>, so a link opens the dashboard with the same filters. A panel's share link carries the values that panel shows.
More information can be found in the Query Parameters and Variables section.
How to Save and Run a Dashboard
To save your changes, use Save in the toolbar: Save draft keeps them in your draft, Save and publish makes them live. A saved Dashboard asks for a name first if it still has the default one. Once published, the Dashboard appears under Dashboards for the current connection, and the queries inside its panels are saved with it.
To run a saved Dashboard, find it in the connections side menu and click on it. This will open the Dashboard in View Mode.
A Dashboard whose queries use parameters opens in a new tab each time you click it, so you can have it open several times with different parameter values.
How to Edit an Existing Dashboard
Click Edit in the toolbar of an open Dashboard, or find the Dashboard in the connections side menu under Dashboards, click on the options icon and click Edit Dashboard . Either way your draft of it opens (see Drafts).
The options menu also has Duplicate, which copies the Dashboard into a new draft of yours, and Rename, which renames the published Dashboard.
How to Delete a Dashboard
To delete a Dashboard, find it in the connections side menu, click on the options icon and click Delete Dashboard. While you edit a draft of a published Dashboard, Delete dashboard in the toolbar's More menu deletes the published Dashboard. Deleting a Dashboard also deletes every draft of it.