Graph Data Science
Introduction
Graph Data Science allows you to score or group the elements of a result set from a range of algorithms, then see those results directly on gdotv's graph visualizer. Algorithms run for the graph currently being displayed, not the entire database.
Note that analytics do not currently persist between sessions.
To open the Graph Data Science side window, click on the graph sidebar.
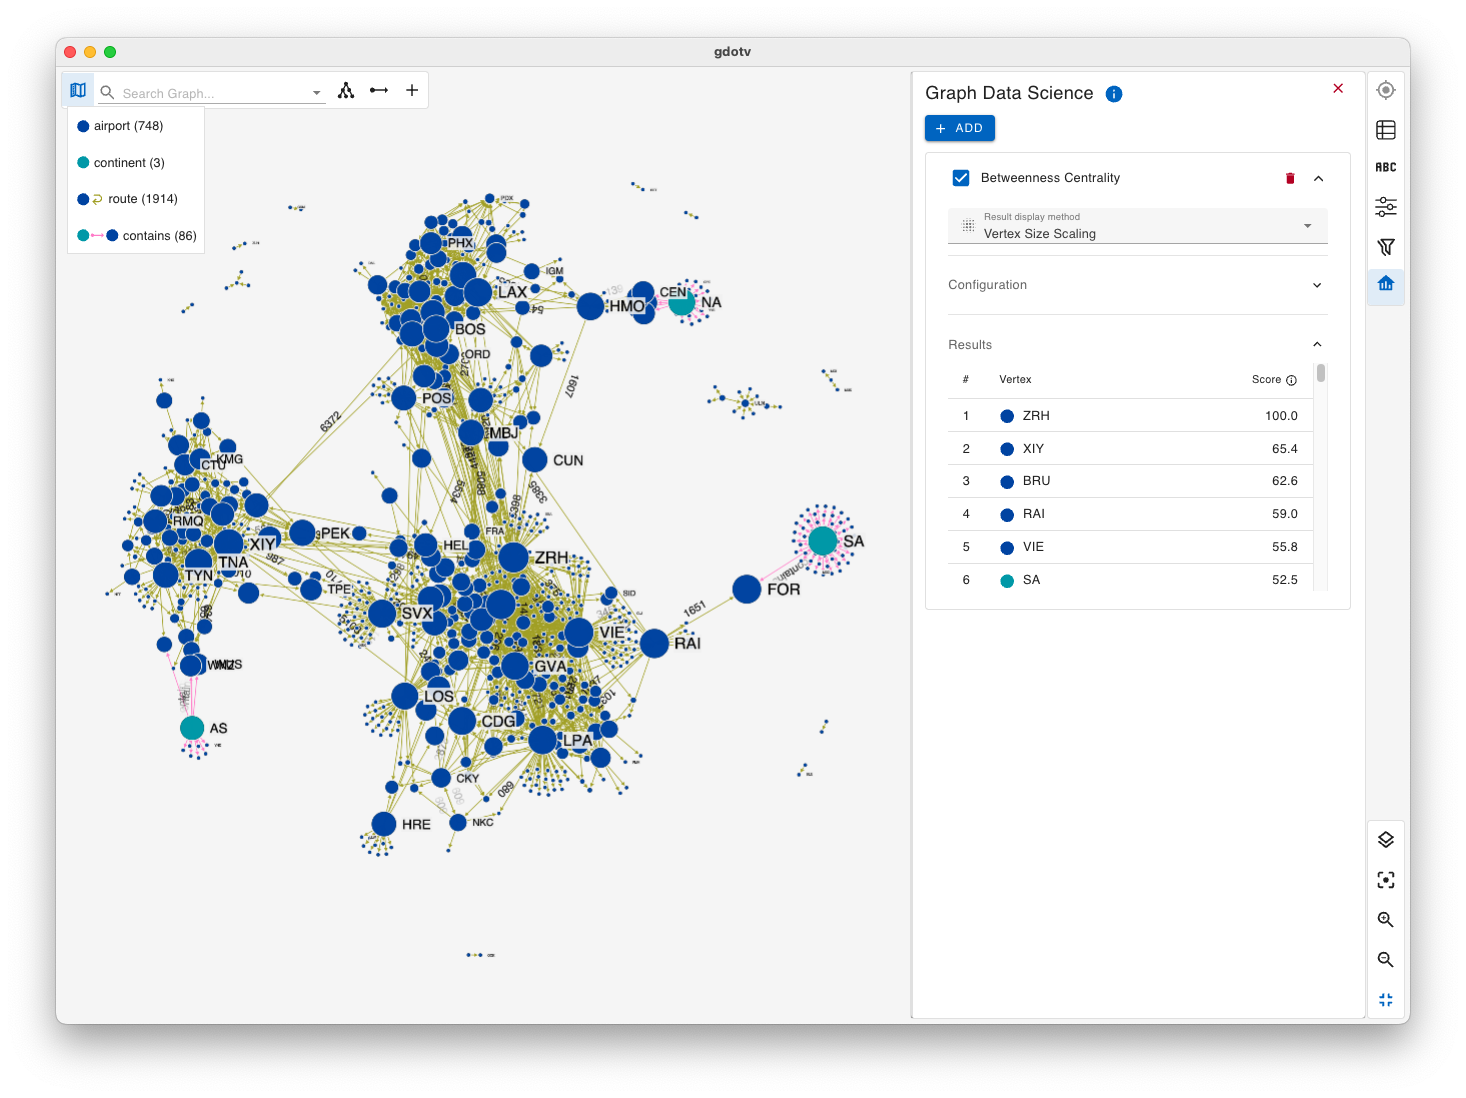
Adding an Analysis
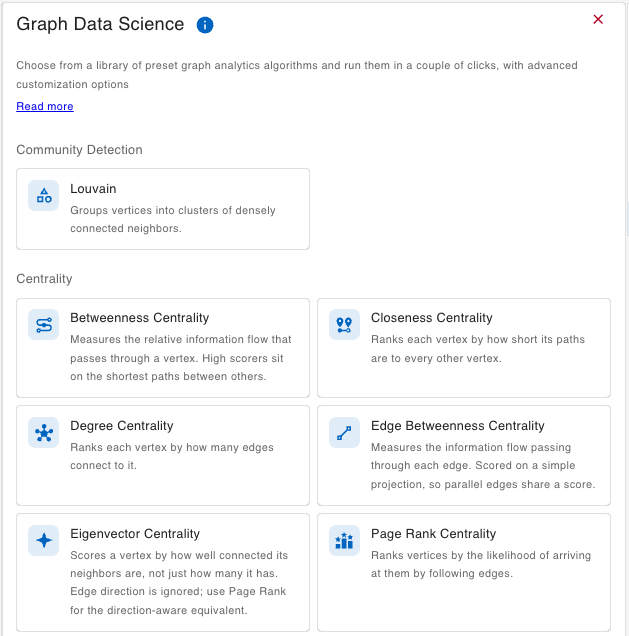
To add an analysis, select one from the list. To add further analyses, click on the 'add' button and the same list will open in a dialog. Any number of analysis cards can be added, including more than one of the same algorithm. One styling rule can be applied from each card.
Choosing an Algorithm
Algorithms
Community detection
- Louvain: Groups nodes into clusters of densely connected neighbors.
Centrality
- Betweenness Centrality: Measures the relative information flow that passes through a node. High scorers sit on the shortest paths between others. Orientation defaults to Undirected.
- Closeness Centrality: Ranks each node by how short its paths are to every other node. Orientation defaults to Undirected.
- Degree Centrality: Ranks each node by how many relationships connect to it.
- Edge Betweenness Centrality: Measures the information flow passing through each relationship. Scored on a simple projection, so parallel relationships share a score. Orientation defaults to Undirected.
- Eigenvector Centrality: Scores a node by how well connected its neighbors are, not just how many it has. Relationship direction is ignored; use Page Rank for the direction-aware equivalent.
- Page Rank Centrality: Ranks nodes by the likelihood of arriving at them by following relationships.
Result Display Methods
The heart of the Graph Data Science feature is how each algorithm styles your graph. Each analysis card can have only one method selected at a time, but different methods can be combined between multiple cards. These displays will override your Stylesheet, but are never saved to it.
Available Display Methods
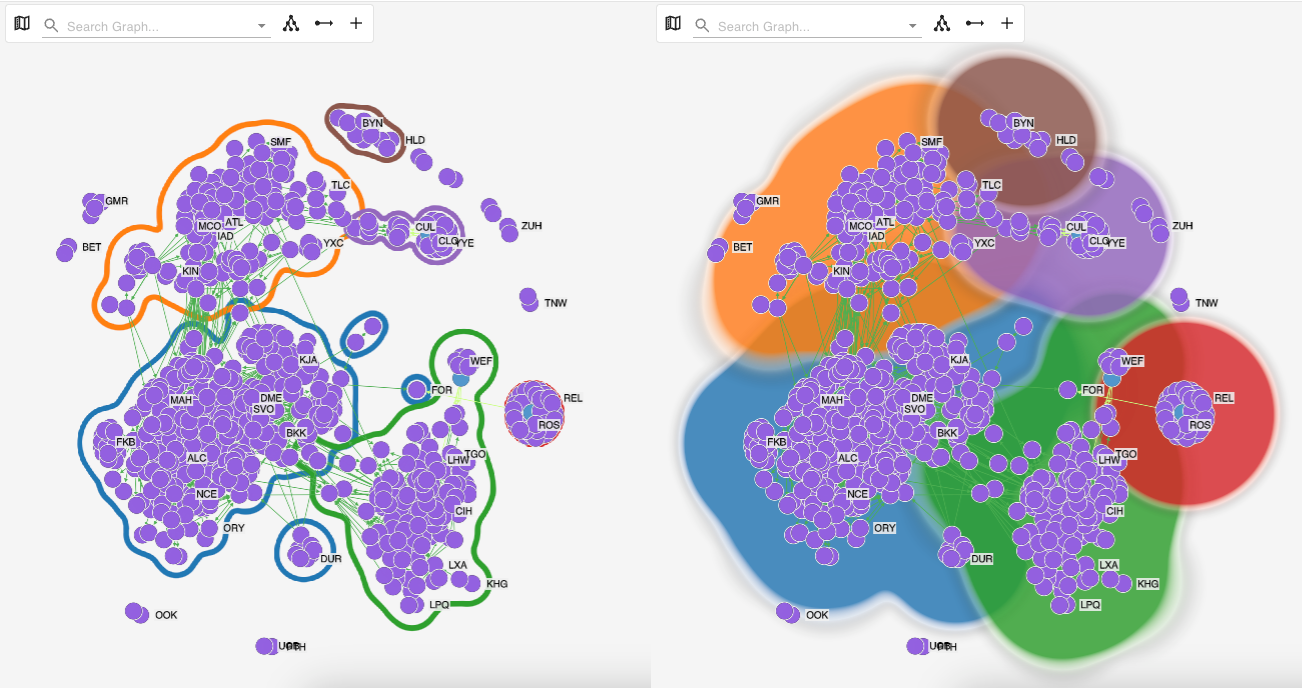
- Community Highlight - Heatmap: Draws a separate heatmap layer for each community in its own color. Colors are stronger when a community's nodes sit closer together. Louvain only.
- Community Highlight - Outlines: Draws smooth shapes around groups of nodes to visualize clusters. Louvain only.
- Layout: Arranges and separates nodes based on clusters. Louvain only.
- Node/Edge Size Scaling: The higher the score of the vertex or edge, the larger it will appear on the graph. Not available for Louvain.
- Node/Edge Color Gradient: The higher the score of the vertex or edge, the darker it will appear on the graph. Not available for Louvain.
- Heatmap: Displays a density-based heatmap layer that visualizes node concentration. Not available for Edge Betweenness or Louvain.
Heatmap and both Community Highlights cover the whole canvas, so only one can be applied at a time.
Both Community Highlight styles skip communities of four nodes or fewer, which are too small to form a meaningful shape.
Configuration
Each analysis is configurable in a number of ways. Configuration settings can be cleared by pressing 'reset'.
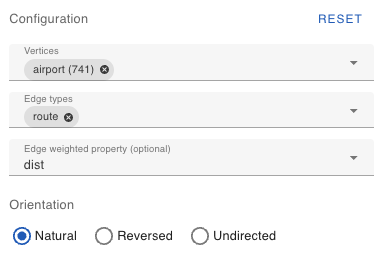
- Vertices / Edge Types: Scope the algorithm to specific parts of the graph. Empty by default (i.e. everything from the current graph is included).
- Edge Weighted Property: Use a numeric relationship property in the calculation, rather than treating every relationship as equal. Its meaning depends on the algorithm; a distance for Betweenness, a strength for Page Rank and Eigenvector. Unavailable for Closeness and Degree.
- Orientation (Natural / Reversed / Undirected): Choose which way relationships are read: as stored, flipped, or with direction ignored. Unavailable for Eigenvector, which always ignores direction.
These settings affect the algorithm scores rather than filtering what appears, and as such, they are applied BEFORE the algorithm runs. Changing any of these settings will unexecute the current algorithm to avoid the risk of any mismatches, so the algorithm needs to be run again after configuration.
Running an Analysis
To run an analysis, click on 'run algorithm'. The selected algorithm's default display method will be applied to the graph, as long as another algorithm card isn't already styling the graph with the same method (see Result Display Methods for more). A check box will appear next to the card title to toggle whether or not the results are applied to the graph.
Results
Results are also available as a table view once the algorithm has been run.
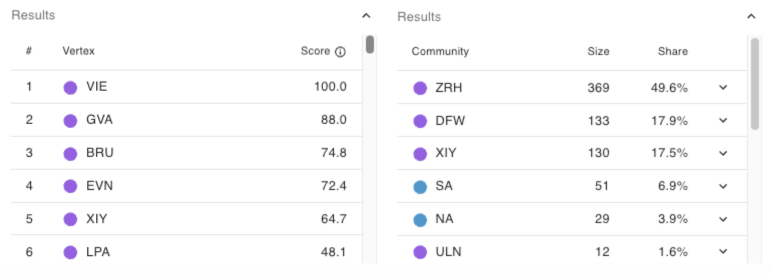
The # column is rank; rows are sorted by score. Scores are normalized and shown relative to the highest in the run, which will always be 100 (unless the graph is too small or disconnected in which case it will be 0). Hovering over a score will show the true raw value. The numbers are comparable within one run/card only, not between different analyses or graphs.
Hovering over a vertex row will highlight that vertex and its connections/community. Clicking will open the vertex in the element sideview (replacing the Graph Data Science sideview).
Louvain works slightly differently. A row represents a community (named after its "hub"), and can be expanded to view its members. Louvain also uses a share % instead of a score.
Using Multiple Analyses Together
Several analysis cards can be used together to style the graph in a variety of ways, but two cards driving the same display methods cannot stack. For example, you can't use Node Size Scaling on both Betweenness and Closeness, as they would attempt to style nodes in a conflicting way. Applying it on one will simply turn it off on the other, while displaying a message to let you know.

Keeping Results Up to Date
If the results of your graph change, your analyses will remain, but will not automatically re-run. This is deliberate, since the displayed scores describe the graph that was just replaced. You will be informed of this, and a refresh button will appear at the top of the Graph Data Science side window.
The refresh button re-runs every algorithm against the graph as it now stands, and re-applies each one's styling over the new results. Analyses can also be re-run individually.
There are three main ways results can go out of date:
- Running a new query will load a new graph without any analysis styling on top of it.
- Adding elements (such as loading neighbors) will load in the new elements without any analysis styling, while leaving styled elements as they are.
- Deleting elements will not change the existing analysis styling, but you will still be informed that the results are out of date.
If you're unsure whether your results are out of date, there are three ways to tell:
- A message will appear in the top right of the main app window as soon as it happens.
- A blue dot will appear next to the Graph Data Science icon in the graph side panel.
- The refresh button will appear at the top of the Graph Data Science side window (it only appears when results are out of date).
Removing an Analysis
To remove an analysis, along with any styles it might be applying to your graph, click on in the card header.