Hey! I'm Arthur Bigeard, the founder of gdotv Ltd.
I'm a former Identity & Access Management developer with a heavy background in cyber security.
I've developed a passion for Graph Databases and the Apache TinkerPop ecosystem in particular over the last few years which I've channeled into the making of our flagship product, G.V().
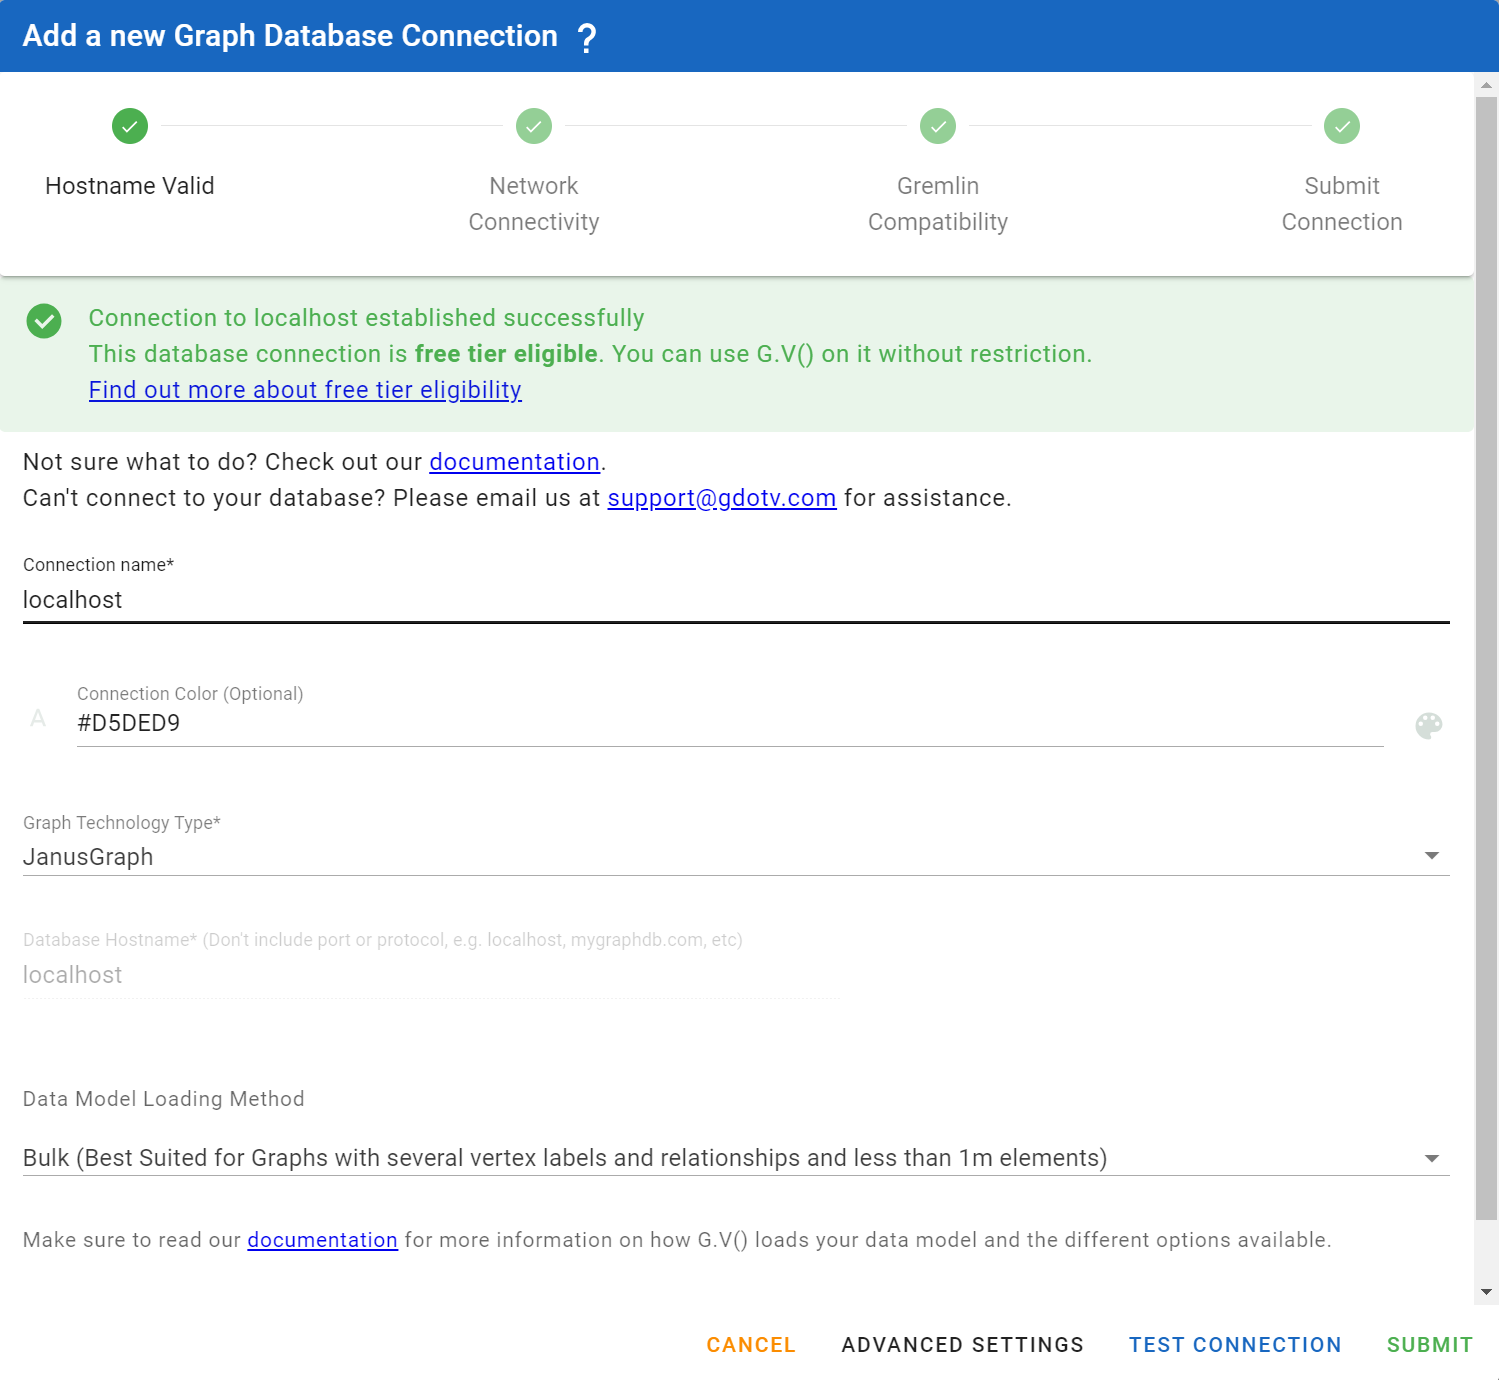
G.V() Basic was removed on February 5th 2024. We’ve since introduced a new free tier for G.V() that once again allows unrestricted use of our software for any graph database meeting our size threshold of 500 vertices and 500 edges. To find out more, head over to this blog post.
What will change with G.V() Basic going away?
G.V() Basic is our free tier. It allows you to use most of our software’s functionality without restrictions for the following Apache TinkerPop Graph Systems:
Gremlin Server
JanusGraph
ArcadeDB
Azure Cosmos DB Emulator
On February 5th 2024, this tier will be removed and all G.V() Basic Licenses that have been issued will expire. Continuing to use G.V() with the above Graph Systems will require a paid G.V() Pro license.
A new free tier, G.V() Lite, has already been introduced for new users and allows (mostly) unrestricted use of G.V() with our in-memory graph, G.V() Playground.
Continuing to support the developer experience with G.V() Lite
This free tier is designed to support users learning graph databases or Gremlin and will receive new specific functionality before G.V() Basic’s expiry allowing for in-memory graphs to be exposed over a network to connect your development environment (or any other application).
Initially G.V() Playground will be restricted to running TinkerGraph (Apache TinkerPop’s own in-memory graph) but we plant to extend this to support JanusGraph’s as well.
As part of this, we’re also opening up access to our Gremlin Query Debugging functionality and our OpenAI Text To Gremlin feature to all users of G.V() Basic and G.V() Lite.
Our goal is to give everyone a free to use software that allows them to stand up and manage Apache TinkerPop in-memory graphs effortlessly, and to expose them over a local network so that they can be accessed from their development environment.
This will allow developers and engineers to continue to develop their graph project locally using G.V() without the burden of having to stand up and manage Apache TinkerPop graph systems by themselves. When the time comes for these graphs to be deployed in production using one of the many Apache TinkerPop systems G.V() support, they can then choose to start using G.V() Pro to continue supporting their graph use cases.
Why is this happening?
G.V() is a passion project that I’ve now embarked on three years ago at time of writing. G.V() saw it’s first beta release after a year of work and remained 100% free to use until January 2023, when we’ve introduced G.V() Pro for Amazon Neptune and Azure Cosmos DB. We’ve received a lot of great feedback that helped us improve the software over the years.
To continue delivering quality updates at a monthly cadence we need financial support from our user base. With your support we can work on more ambitious features that keep pushing the boundaries of tooling in the Apache TinkerPop ecosystem.
We hope that you will understand and support this decision – it’s essential to sustaining the growth of our software.
Will there be exemptions/exceptions?
We offer a 30% discount on G.V() Pro for small companies like us that you can apply for here.
If you are a student or an academic looking to use G.V() for learning or educational purposes, contact us at support@gdotv.com via your academic email address and we’ll provide you with a G.V() Pro license free of charge.
If you’re a committer to one of the open source Apache TinkerPop systems listed above, we’ll also be happy to send you a free G.V() Pro license. Just contact us at support@gdotv.com from an email address that can be tied back to any of your contributions in the last 12 months.
So I’ll (likely) need a G.V() Pro license – where do I start?
To purchase a G.V() Pro license, head on over to our Pricing page. We’ve included a whole lot of FAQs to help you through the process. If you need to raise a Purchase order with us simply get in touch at support@gdotv.com and we’ll get this all over to you in no time – same goes if you have vendor onboarding questionnaires or any similar due diligence.
What’s next for G.V()?
G.V() is going to continue receiving monthly feature updates – and with all your support it will just keep getting better and better, so stay tuned!
Are you new to Apache TinkerPop or Graph Databases in general? Are you looking for directions on how to get started with graph data and the Gremlin query language?
Then look no further than Kelvin Lawrence’s Practical Gremlin: An Apache TinkerPop Tutorial. It’s a free ebook that you can read right here from your browser. It covers the Apache TinkerPop framework and its querying language, Gremlin in great depth. Or as Kelvin describes it:
This book introduces the Apache TinkerPop 3 Gremlin graph query and traversal language via real examples featuring real-world graph data. That data along with sample code and example applications is available for download from the GitHub project as well as many other items. The graph, air-routes, is a model of the world airline route network between 3,373 airports including 43,400 routes
Practical Gremlin is packed full of example queries that will give you a comprehensive overview of the capabilities of the framework. It also discusses very concept behind graph databases and their advantages over traditional relational databases such as SQL. Each query presented in the book corresponds to a genuine use case The query description shows what the data is needed for, its format, and how it is written using Gremlin.
The Air Routes dataset is simple to understand and intuitive. It contains the relationship between Airports, Countries and Continents. A continent contains countries which contain airports which have air routes allowing travel between cities and countries across the world.
For reference, this is the structure of the Air Routes dataset represented as an Entity Relationship diagram using G.V()’s Data Model Explorer tool:
The graph use case is clear too, especially over the use of relational data. In order to calculate possible itineraries based on existing routes between Airports in different countries, a lot of joining operations are required. For instance when calculating all routes from Austin, Texas, USA to Paris, France, all relationships going out of Austin, into Paris, and potentially in between have to be evaluated as well. This approach would scale very poorly in SQL due to the immense amount of joining operations required. Additionally, the more hops are required in the data, the worse performance (and query structure) would get!
This works in graph because the relationships between entities are first-class entities too, the same way vertices are – you can query entities in a relational database, but you can’t directly query relationships without having to go through its entities (tables in this case, where relationships are the foreign keys).
We’ve covered the basics of our favorite Gremlin learning resource – now let’s use the best available tool (G.V() of course :D) to practice the contents of the book!
Getting started with G.V()
The entire Air Routes Dataset display in G.V()’s Graph View – Now is it just me or does this look a bit like our world map?
Let’s get to work! First things first, you need to download and install G.V() – and don’t worry, this is all 100% free.
Once you’ve got G.V() installed, you’ll be presented with a Welcome Screen. We love Kelvin’s work so much that we’ve put it front and center on our application. Scroll down (if you’re on a small screen) and you’ll notice a Learn Gremlin With Kelvin Lawrence’s PRACTICAL GREMLIN section. Click on Open Practical Gremlin to open the book, if you haven’t already, and click on Create Air Routes Graph to create an in-memory TinkerGraph instance on G.V() with the air routes data set pre-loaded.
Quick editor’s note: you’ll be prompted to sign up for a G.V() Basic License – it’s free and permanent. We’re just asking for some basic details and we’ll not bother you unless you agree to be contacted by us!
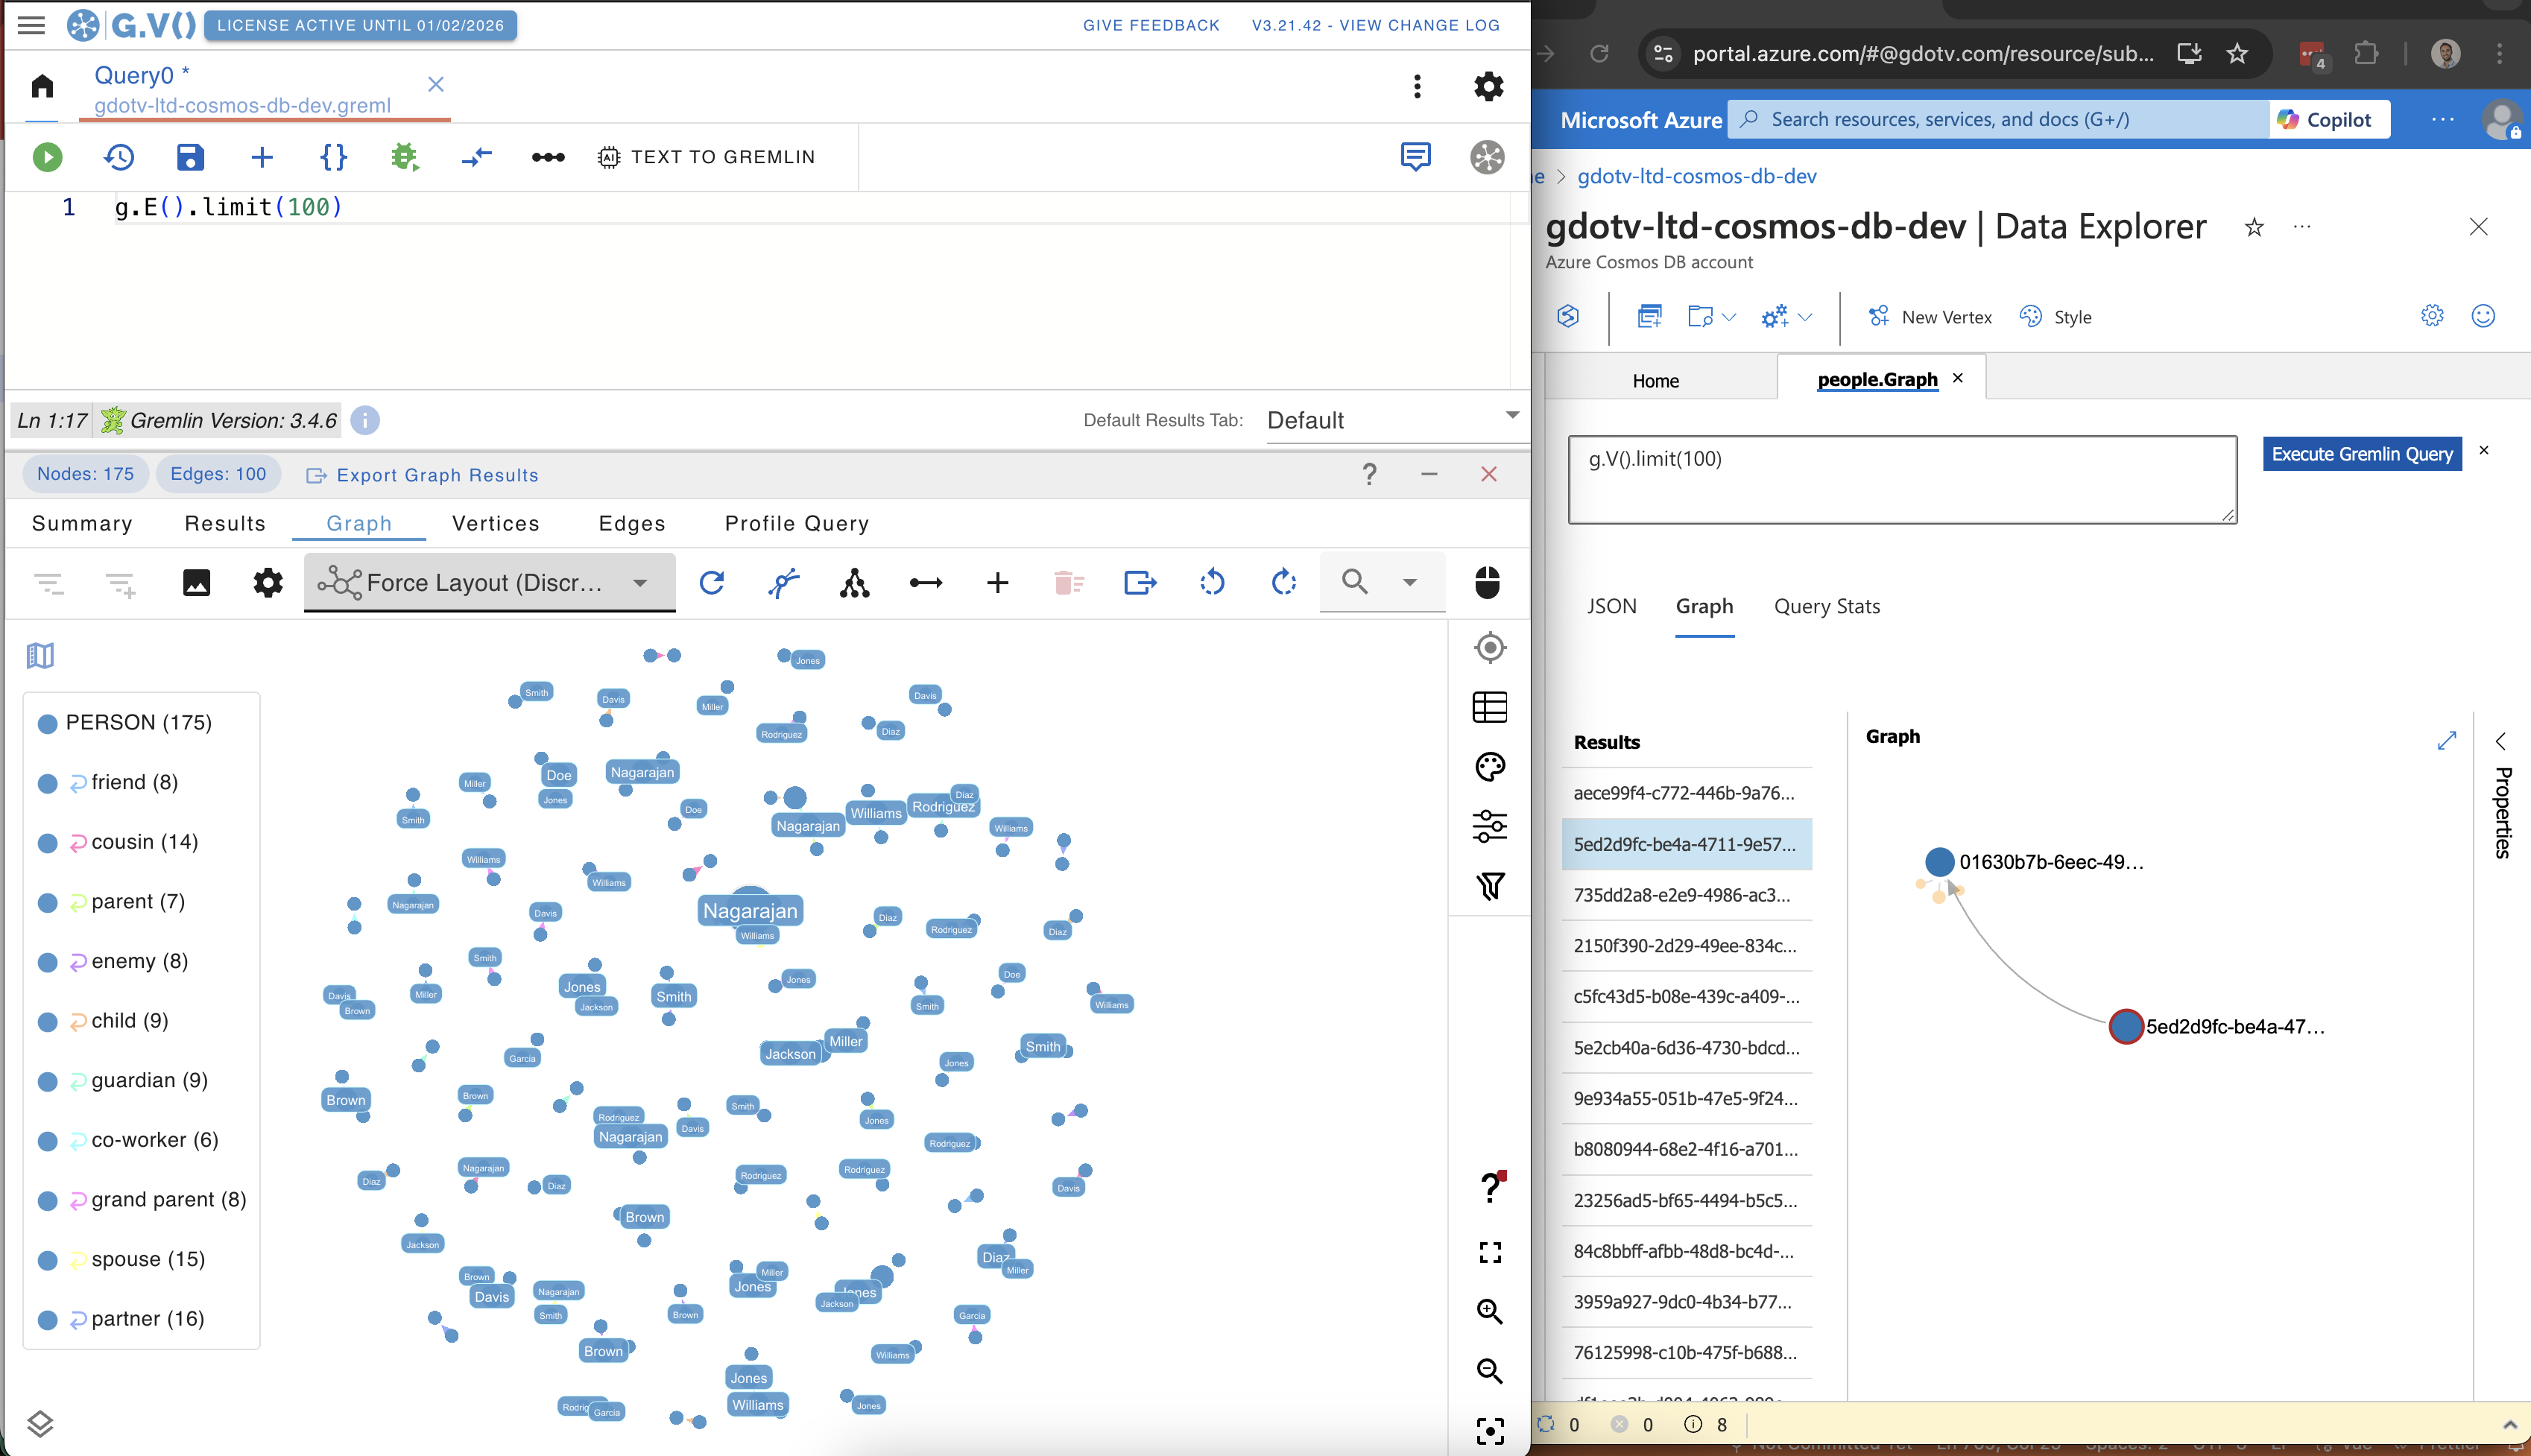
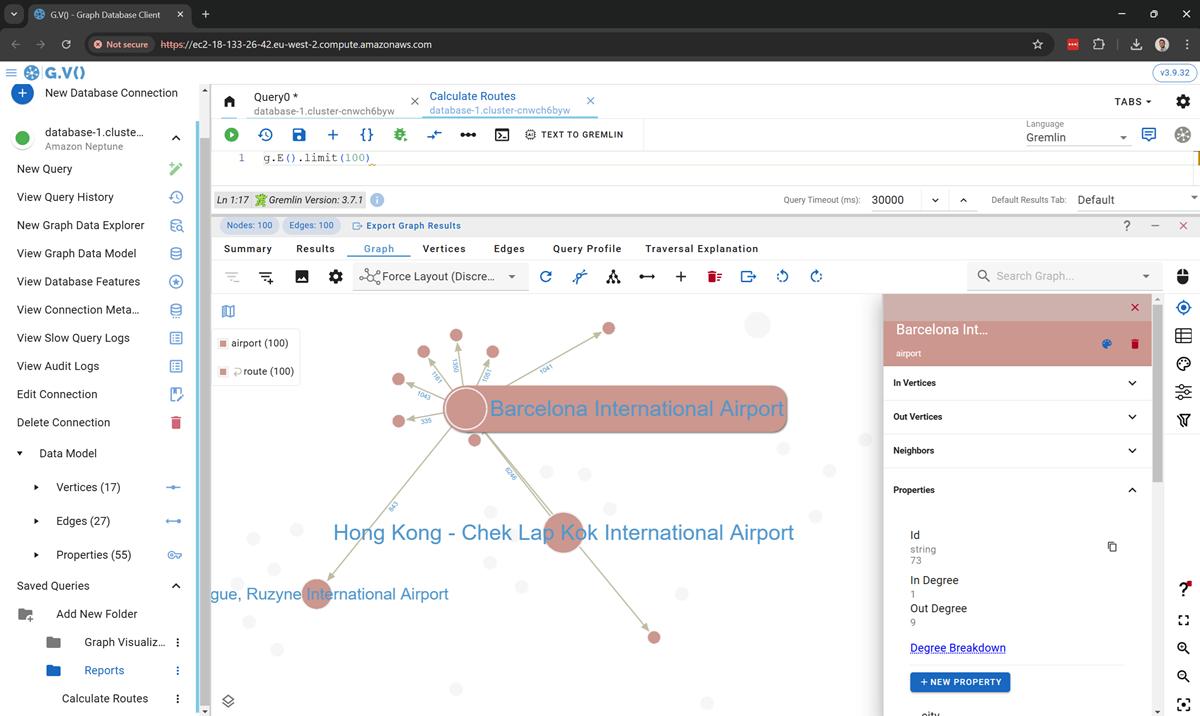
Once you’ve created your air routes graph and signed up for a free G.V() Basic License, you’ll be presented with a query screen with the following query run for you:
g.E().limit(100)
This is a simple query that simply says “fetch me the first 100 edges in the database” – this allows G.V() to produce a nice little initial graph visualisation for you.
G.V() is a Gremlin IDE – long story short, it can do a lot. For the purposes of this blog post you can mostly just stick to this newly opened query tab to run queries from the book. Have a little click around the various result tabs showing (Query Output, Vertices, Edges) to get a better idea of what’s being displayed. You can also click on elements in the graph to view their details, modify their properties, etc.
Additionally, you can view your database’s graph schema by clicking “Open Data Model Explorer” on the left navigation pane. If you just want to explore the data in free form or query it without writing any actual query, you can also open a Graph Data Explorer, also in the left pane. Finally, you can open as many queries as you like, so you can easily compare them. Go ahead and click “New Query” on the left navigation pane under your Air Routes connection to create another query tab.
There’s a lot more functionality available but as far as this follow along with the book exercise is concerned, this should about do you! Feel free to have a play around though.
We’re all setup to follow along with the book now. Note that since we’ve already loaded Air Routes in a G.V() in-memory graph, you can just go ahead and skip section 2.6 and 2.7, but we recommend you have a read and give them a try at some point anyway! There’ll be plenty queries for you try from section 3 through to 5. Further sections of the book will give you a great start on developing a graph application, deploying a graph database, and what your options are!
Get reading, pop those queries in G.V() and give them a whirl! Try and type them manually in G.V() too so you can see our smart autocomplete feature in action!
Graph Visualization Options
Here’s a few advanced configurations you can do in G.V() to improve your graph visualization. Open a graph data explorer for your Air Routes connection, as explained before, and click on Graph Styles as shown below:
You can change the styles of your graph visualization. For instance, you can select what text to display on the vertex and edge labels. This is really useful to get quick and effective visual of your graph data. For your vertices, set the Label Display Rule value to “desc” (the name of the property in the graph containing the object’s name, e.g. country name or airport name) and click on “Save All”:
You can also set styles for your edges. Click on Edges, and for the “route” edge, select “dist” as the label display rule to display the route’s length (in miles) on the graph visualization.
Change the label display rule and hit Save Changes again. The graph visualization will update in real time as you change these configurations. You can also create multiple stylesheets and swap between them. There’s a lot of options available which we’ll not list here, but have a play. You can even set images for your vertex backgrounds!
You can also change the graph layout algorithm displaying your data. This can be useful to de-clutter the visual and is typically highly dependent on the volume of the data on your graph as well as how interconnected it is, check it out:
Generating Gremlin queries on your dataset with OpenAI
If you’re not much in the mood for writing queries today, guess what? You can just ask an OpenAI Model to do it for you. Open a new query editor and click on “Text To Gremlin” in the toolbar. First off, you’ll need to configure your OpenAI key – check out the documentation linked in the popup on your screen for more information.
Once you’ve got your OpenAI API Key configured within G.V(), you’re ready to go. Note that you can also choose with GPT model to use – GPT3.5 Turbo , GPT3.5 Turbo 16k (useful for more complex data schemas) or GPT4.
Let’s pop some prompts in and let OpenAI work its magic:
We’ll start with the following prompt, using GPT4:
find all the routes between airports in London, Munich and Paris
Editor's note: taking out the by('code') from the query to allow it to output a graph visualization rather than
plaintext Airport codes
And we get the following visual:
It’s the same result! Uncanny….G.V() does a little bit of magic behind the scenes to ensure that the GPT prompt submitted to OpenAI contains the essential information it needs to generate a Gremlin query that is aligned to your graph data schema. Give it a try! It’s a great way to query your data without ever having to write a Gremlin query.
Everything else
G.V() is the most feature rich Gremlin IDE available – so we’re not covering everything it can do here. But have a look at our documentation to find out more and make sure to check our Blog regularly too for new content demonstrating the capabilities we have in store. We have monthly new feature releases so you can be sure there’ll always be more for you to do on G.V()!
Conclusion time
Graph databases are great – they’re still relatively new compared to titans such as SQL and that means it can be hard to unlearn years or relational data reflexes. Kelvin Lawrence’s Practical Gremlin: An Apache TinkerPop Tutorial is a great way to learn more about Graph Databases, Apache TinkerPop and the Gremlin query language. With G.V(), you can enhance your learning experience and start seeing the concrete benefits of using a graph database with cool visuals and features to match with your data, at no cost.
There are other learning resources available too of course – many of them just as great, for instance, Apache TinkerPop’s own Getting Started guide!
Who knows, with a bit of practice and learning you might find yourself developing and deploying your graph database to one of our many supported graph systems (Aerospike Graph, Amazon Neptune, Azure Cosmos DB, JanusGraph, and more)!
Did you like this post? Share it around and tell us your thoughts below!
Hey! We’re starting a new tradition of releasing blog posts to quickly show case new features of G.V() whenever a feature update is released. To kick this off, let’s have a look at what’s in store for this update!
Improved Query Editor User Experience
G.V()’s query editor is an essential part of the software and one that hasn’t seen too much change since it was first released. So we thought now’s a good time for a fresh coat of paint and a little rework of the user experience.
First of all, we’ve redesigned all the popups to match the overall style of the application better.
We’ve also reworked the sidebar popup to be permanent but easily toggled – it now contains some useful shortcuts such as a view of your data model as you type your query and it will continue to display context- aware information as you type your query (e.g. Gremlin documentation, data model documentation, etc). Moreover, when highlighting a specific step in your query, this assistant feature will also display the corresponding documentation.
We’ve also added a never seen before (in the Apache TinkerPop world!) syntax highlighting feature that will really improve readability, especially on complex queries. Check it out:
This is a first phase of improvements that will soon be followed by more – our focus will be on additional highlighting and query writing assistance scenarios (e.g. project/select key highlights, labels and property keys documentation display on highlight, etc).
Apache TinkerPop 3.7.0 Official Support and G.V() Playground upgrade
G.V() now officially supports Apache TinkerPop 3.7.0! Thanks to the addition of Properties on Elements in this new version, all users using Gremlin Server 3.7.0 will benefit from considerable performance improvements when fetching large amounts of vertices and/or edges through G.V().
We’ve also upgraded our own in-memory graph, G.V() Playground, to 3.7.0 meaning that it will also benefit from the same performance improvements.
We’ve added GoLang as a translation target to G.V(), as has been introduced in this new release of Apache TinkerPop.
There are further performance improvements that were made to the result serialization aspects of G.V() which all Apache TinkerPop graph systems and versions will benefit from in this new release.
New Amazon Neptune Audit Logs View
There’s a new Amazon Neptune log view in G.V() to complement the previously released Slow Query Logs view. Much like the former, it is designed to allow users to quickly profile and debug Gremlin queries running on their Amazon Neptune database. We’ve also added some additional controls on both tables to select the columns to display.
The addition of this Audit Log View makes it easier than ever to identify queries running against your database and re-run them if necessary. Once again, GIF demo time!
Everything else…
There’s a few bug fixes and other minor improvements in this release, for reference, see the full release notes below:
G.V() is a continuously evolving software – we have monthly feature releases and monthly maintenance releases running in tandem to ensure both that new features regularly hit the shelves and any defects/bugs are promptly squashed. We’ll post about every feature release to give you a better idea of what’s changing (and why you should update!).
If you have already, make sure to also subscribe to our newsletter to keep up with all things G.V(). See you next month!
What do Neo4j, MySQL, Microsoft SQL, and many other databases have that Apache TinkerPop doesn’t?
You probably read the title – an Integrated Development Environment (IDE)!
SQL in particular has a lot of options available – MySQL Workbench, Microsoft SQL Server, DBeaver, the list goes on. Neo4j has an entire suite of tools to cover the various aspects of data management (Neo4j Bloom, Neo4j Desktop).
It’s an essential part of a database’s toolkit in helping developers, data designers and analysts work with their data day to day as well as presenting it to stakeholders.
So what does Apache TinkerPop have to offer users out of the box? Why of course, the Gremlin Console!
Gremlin Console is an interactive terminal that ships with all releases of Apache TinkerPop and allows users to quickly run queries against their database without the need for writing any code.
It’s a command line interface – that means it’s somewhat limited in what it can display but it has a number of customisable options called “Console Preferences” which can improve the quality of the display. For instance, they allow introducing intuitive color schemes to visually disseminate the different types of results output when running a query.
There’s been a lot of effort put behind the Gremlin Console and there’s no better way to learn about what it is and what it can do than to check out its main tutorial.
Now we’re not here to bad mouth the Gremlin Console by any means – it’s a great tool to get started with Gremlin. In fact the best and most popular Gremlin learning resource (in my humble opinion), Kelvin Lawrence’s Practical Gremlin – An Apache TinkerPop Tutorial, uses the Gremlin Console to demonstrate the many querying use cases of Gremlin.
But if you want to get serious with Apache TinkerPop Graph databases, you’ll need a Gremlin IDE. You need G.V().
Meet G.V(), your Gremlin IDE
Let’s jump right into it – G.V() (pronounced g dot v) is the answer to all your Gremlin headaches. To put it shortly:
G.V() is an all-in-one Gremlin IDE to write, debug, test and analyze results for your Gremlin graph database. It offers a rich UI with smart autocomplete, graph visualization, editing and connection management.
Okay, cool. But what does that look like? Well, G.V() has a lot to offer, but in keeping with our Gremlin Console comparison, let’s see what running the same query on the same data looks like in G.V() versus on the Gremlin Console:
Can you spot the 7 differences?
There’s a lot to look at on the above but let’s just summarize on what we’re seeing:
– On the top of the screen is your query editor, with our query, in this case, “g.V()”.
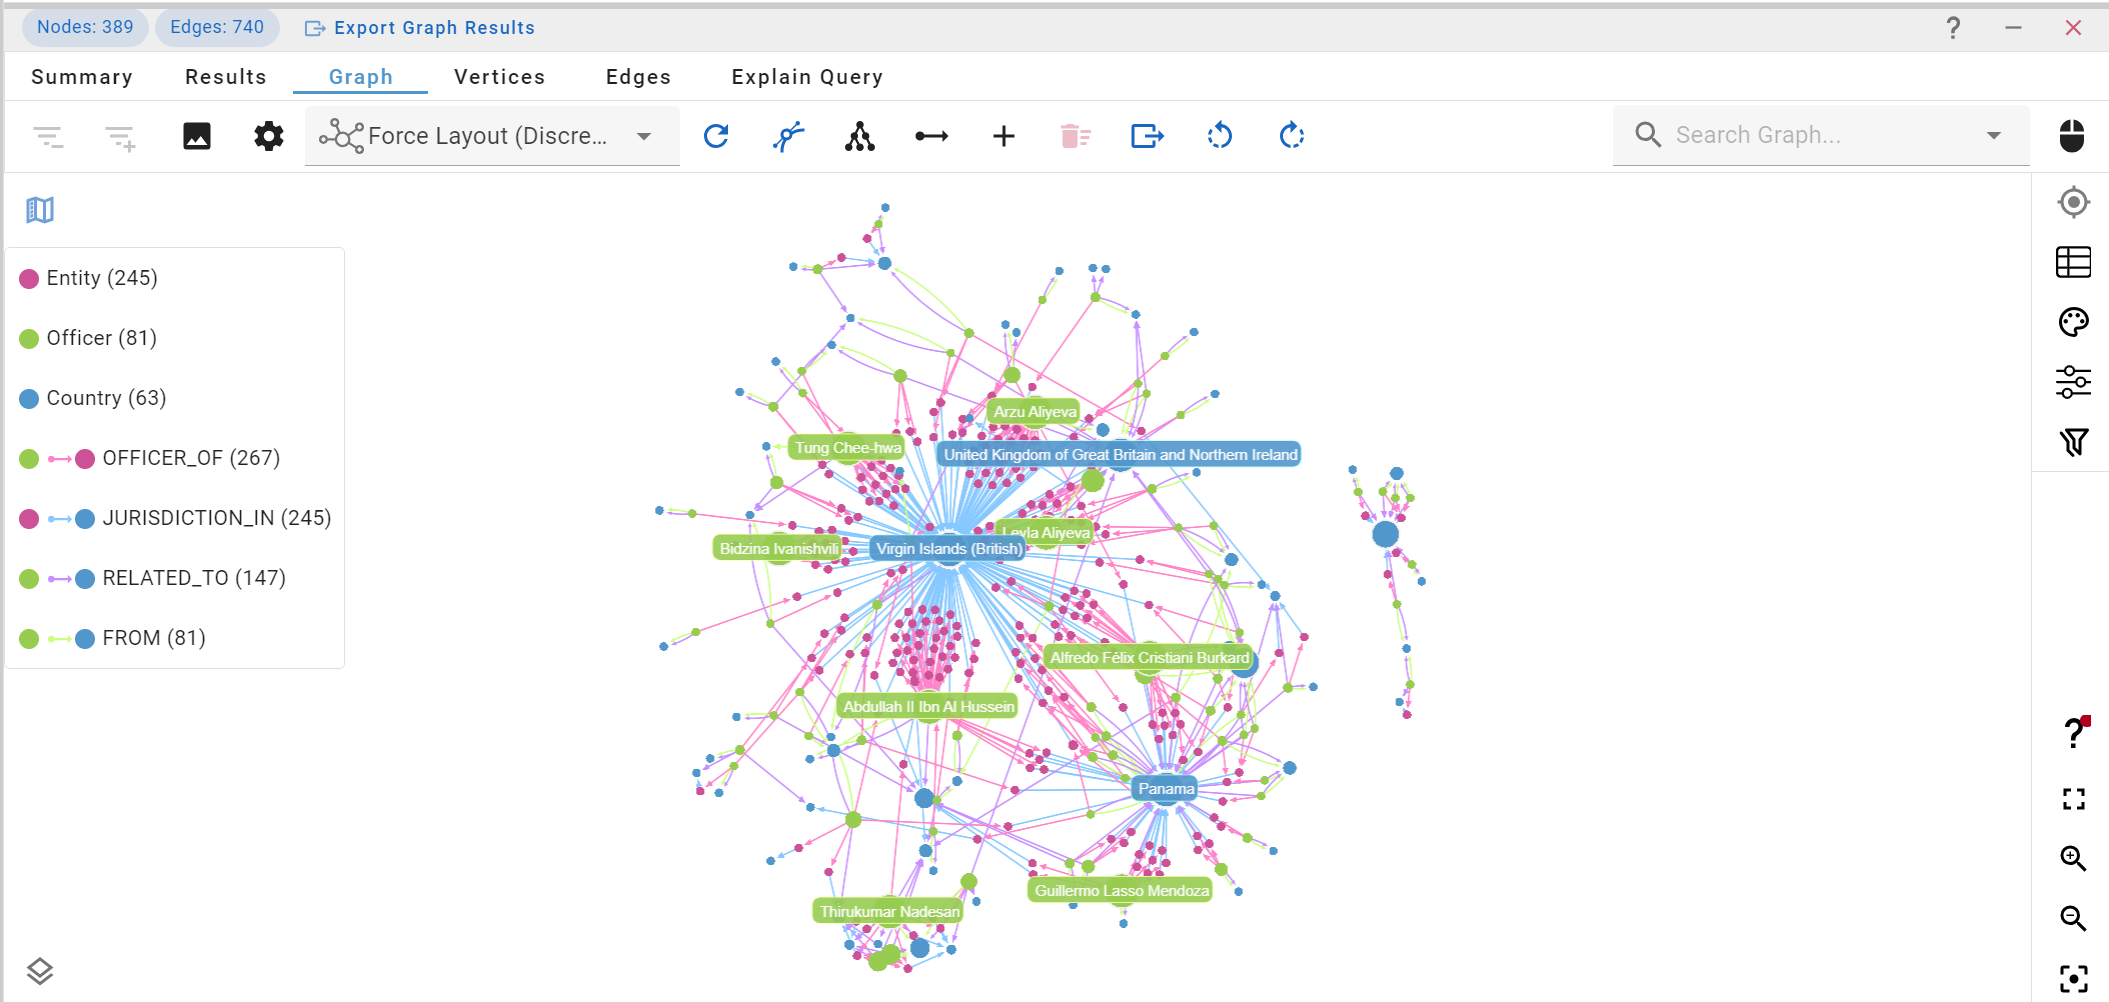
– On the rest of the screen is our results view, which shows a graph visualization of the data returned by the query.
– Everywhere else on the screen is many tools and controls around editing the query and viewing its results – but we’ll come back to these later.
So we’ve gone from g.V() returning this on the Gremlin Console:
==>v[1] ==>v[2] ==>v[3] ==>v[4] ==>v[5] ==>v[6]
To this on G.V():
How does the above map with our graph? Where did the edges come from?
Well, v[1] in the Gremlin Console really means “vertex with id 1” – a vertex in a graph is essentially the dot, and edges are the lines that connect them.
So in our graph representation, each of the dot corresponds to a vertex in the database – and they’re annotated with information that best describes what they are. In this case, our graph contains “person” and “software” vertices, all of which have a “name” property.
Much better!
As for the edges, they strictly speaking don’t belong there – after all, the query we’ve run was g.V(), not g.E(). What G.V() does by default is attempt to include meaningful relationships between any vertices run in a query – this allows producing a more useful representation of your data, and can easily be opted out of.
Even though a graph is a useful representation, particularly in the context of graph databases, sometimes, you may want to rely on more traditional formats inherited from the likes of SQL. Not to worry – G.V() has you covered! In a property graph, it can be convenient to visualize the data as tables too. After all, a vertex label can be thought of as a table name, and it’s properties as its columns. We can also apply a similar logic to edge labels.
For that reason, G.V() offers various results views tailored to your needs:
Vertex View
Edge View
Query Output View
Now that we’ve done a quick comparison of G.V() and the Gremlin Console, let’s look at some of the common features other database IDEs offer, and how G.V() compares.
Gremlin IDE Wishlist
This is by no means exhaustive but here are some of the features commonly found in other database IDEs, such as Neo4J Bloom or Oracle’s MySQL Workbench:
Ability to add, remove and update connection configurations to different database endpoints potentially using slightly different implementations and version of the Apache TinkerPop framework
Ability to query the database and benefit from code completion during the writing of queries
Ability to visualize, compare and modify data interactively on the database
Data analysis and reporting
Database schema management and visualisation
Debugging, profiling, and other optimisation tooling to get the best performance out of our queries
Easy and secure to install/deploy
These features are essential to the ecosystem of any database, and Apache TinkerPop should be no exception – and this is exactly why G.V() was created in the first place. So how does G.V() currently measure against these requirements? Quite well actually! Let’s have a closer look:
Connection Management
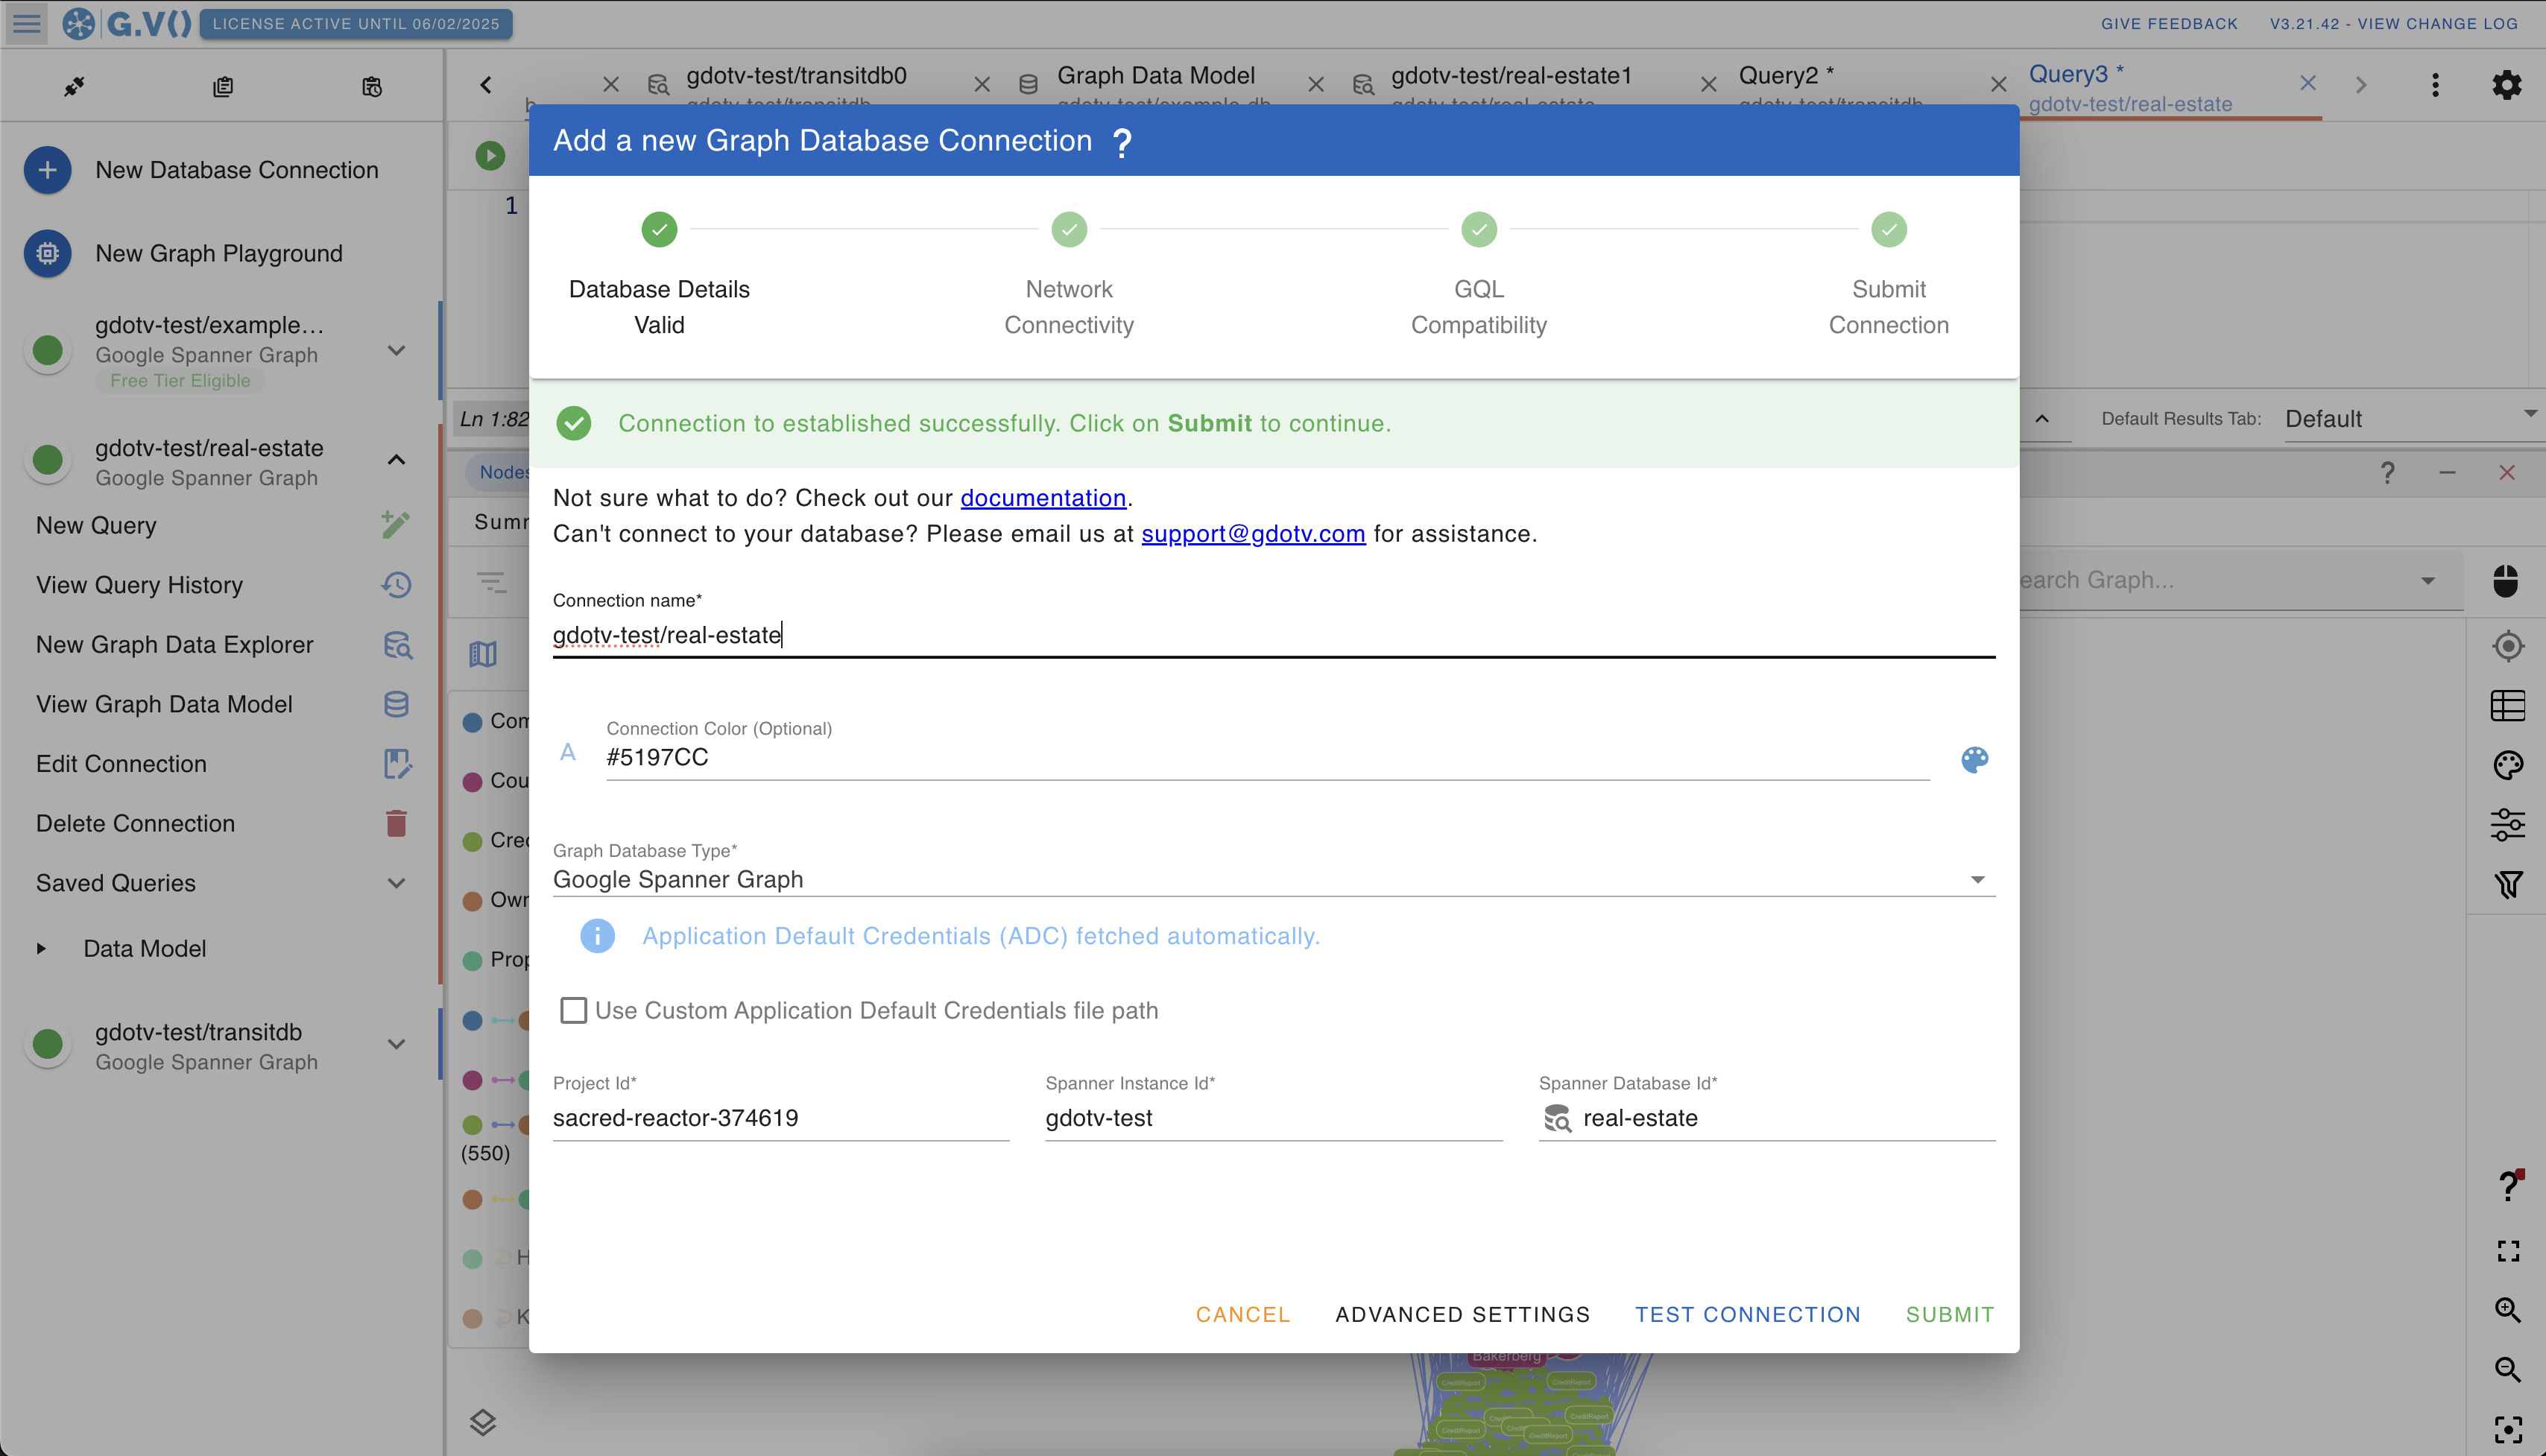
G.V() is officially compatible with a wide variety of Apache TinkerPop implementations. Generally speaking, any implementation of the framework that runs over a websocket channel has a fairly high chance of working out of the box with G.V(). Where official support from us is important however is that we can also implement additional functionality based on the “extras” that each of these implementation support – for instance, G.V() has official built-in support for Amazon Neptune’s IAM authentication mechanism, its Profile and Explain API endpoints, as well as many other Amazon Neptune specific features.
We also provide the ability to quickly spin up in-memory graph’s using G.V()’s Playground feature, which uses TinkerGraph instances behind the scenes. Perfect to get a quick start!
You can have as many connections to each and any of these graph systems stored in G.V() concurrently and used in parallel unlike the Gremlin Console for instance that would require one per database instance. We have a simple connection setup wizard that guides you through the steps to connecting to your database based on the requirements it returns to us (e.g. credentials required, graph traversal source name required, authentication key, etc) and an advanced setup mode where you can fine tune how you want to connect to your database, down to which serializer to use.
Querying the database
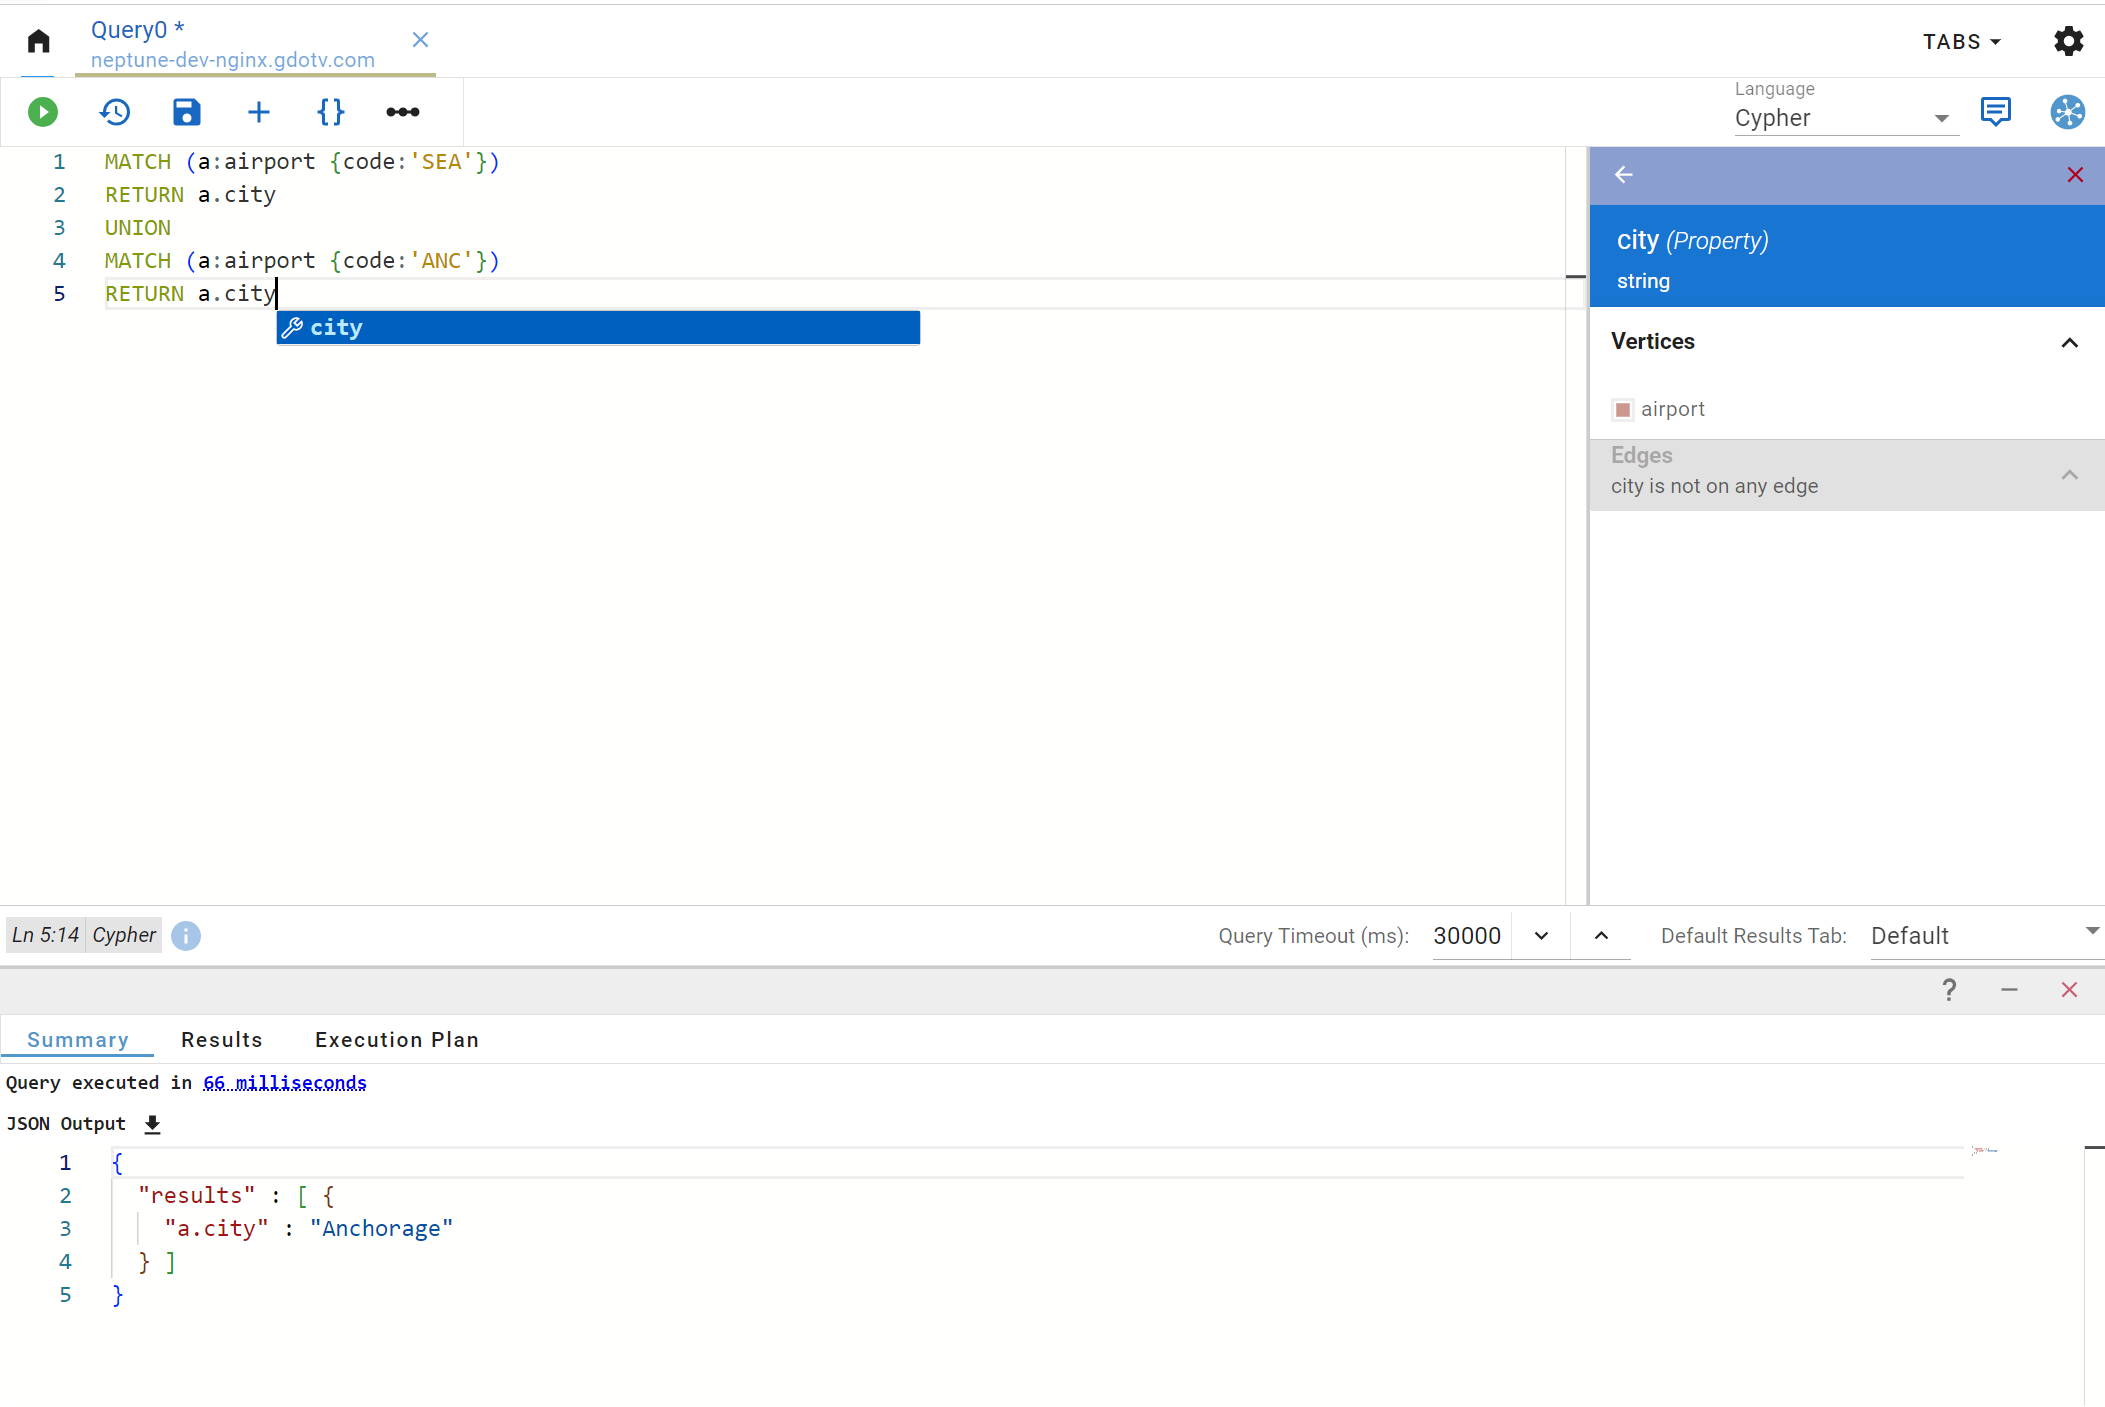
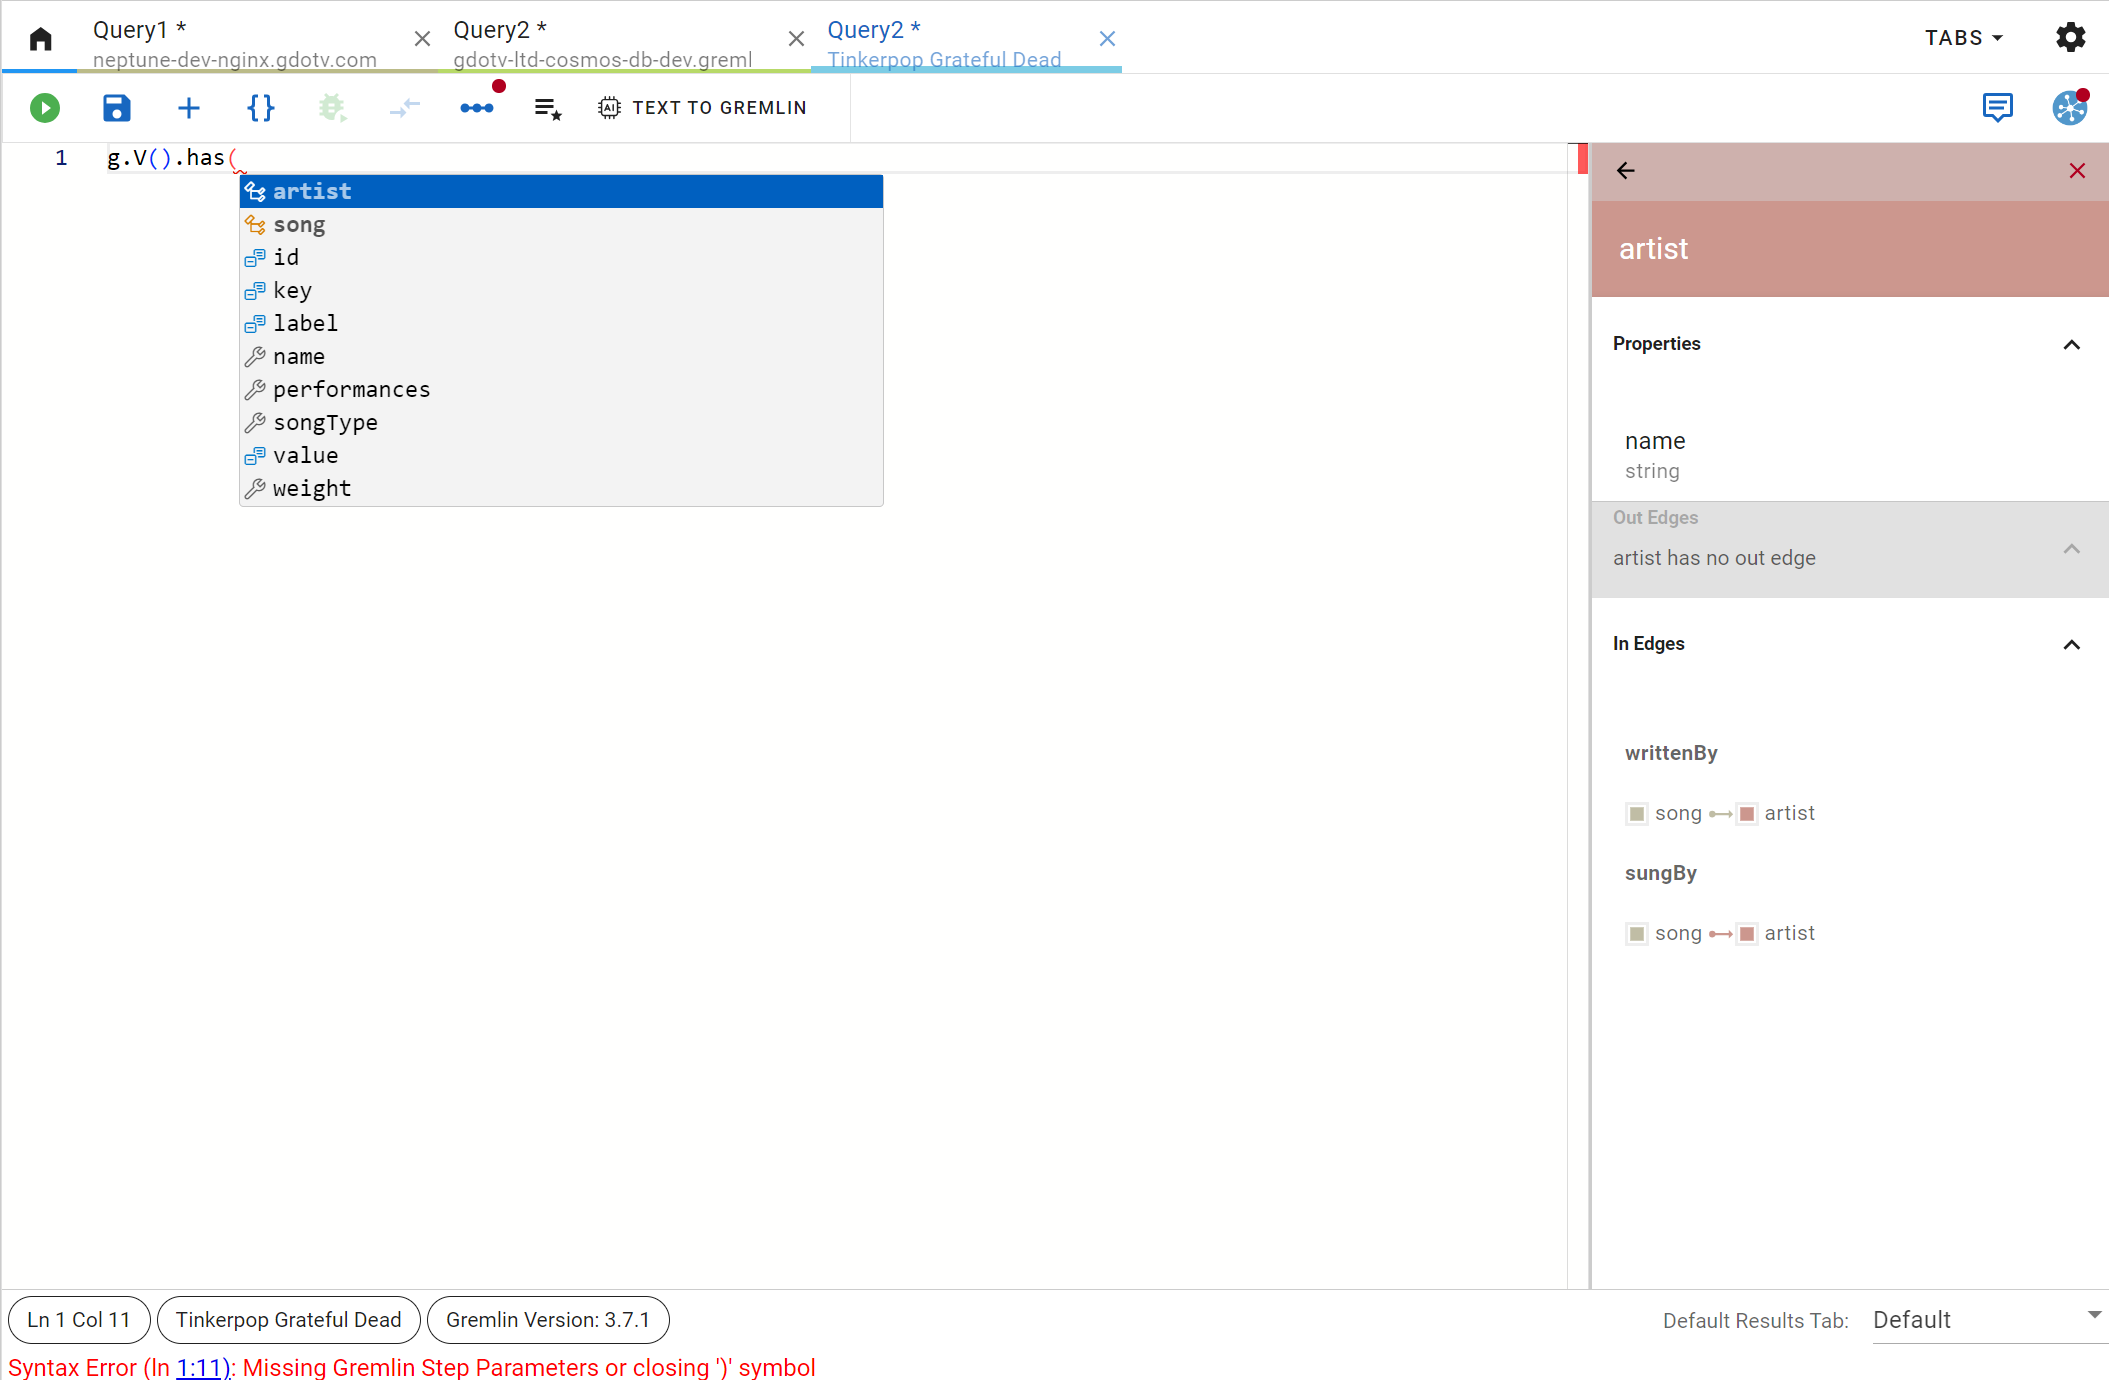
This is a lot of our users’ favourite feature of G.V() – our query editor. It is quite simply the most advanced and feature complete code editor for Gremlin you’ll find out there. It comes bundled with an advanced autocompletion engine that provides suggestions based not just on steps and predicates of the language but also vertex labels, edge labels and property keys of your database, as inferred from its data model.
It also offers syntax error reporting and highlighting, query formatting using Gremlint, Gremlin Language Variant translation (e.g. Java, Python, Go, Javascript) based on the official implementation of the framework, embedded Gremlin reference documentation, and much more! Just have a look for yourself:
Visualizing and Editing data interactively
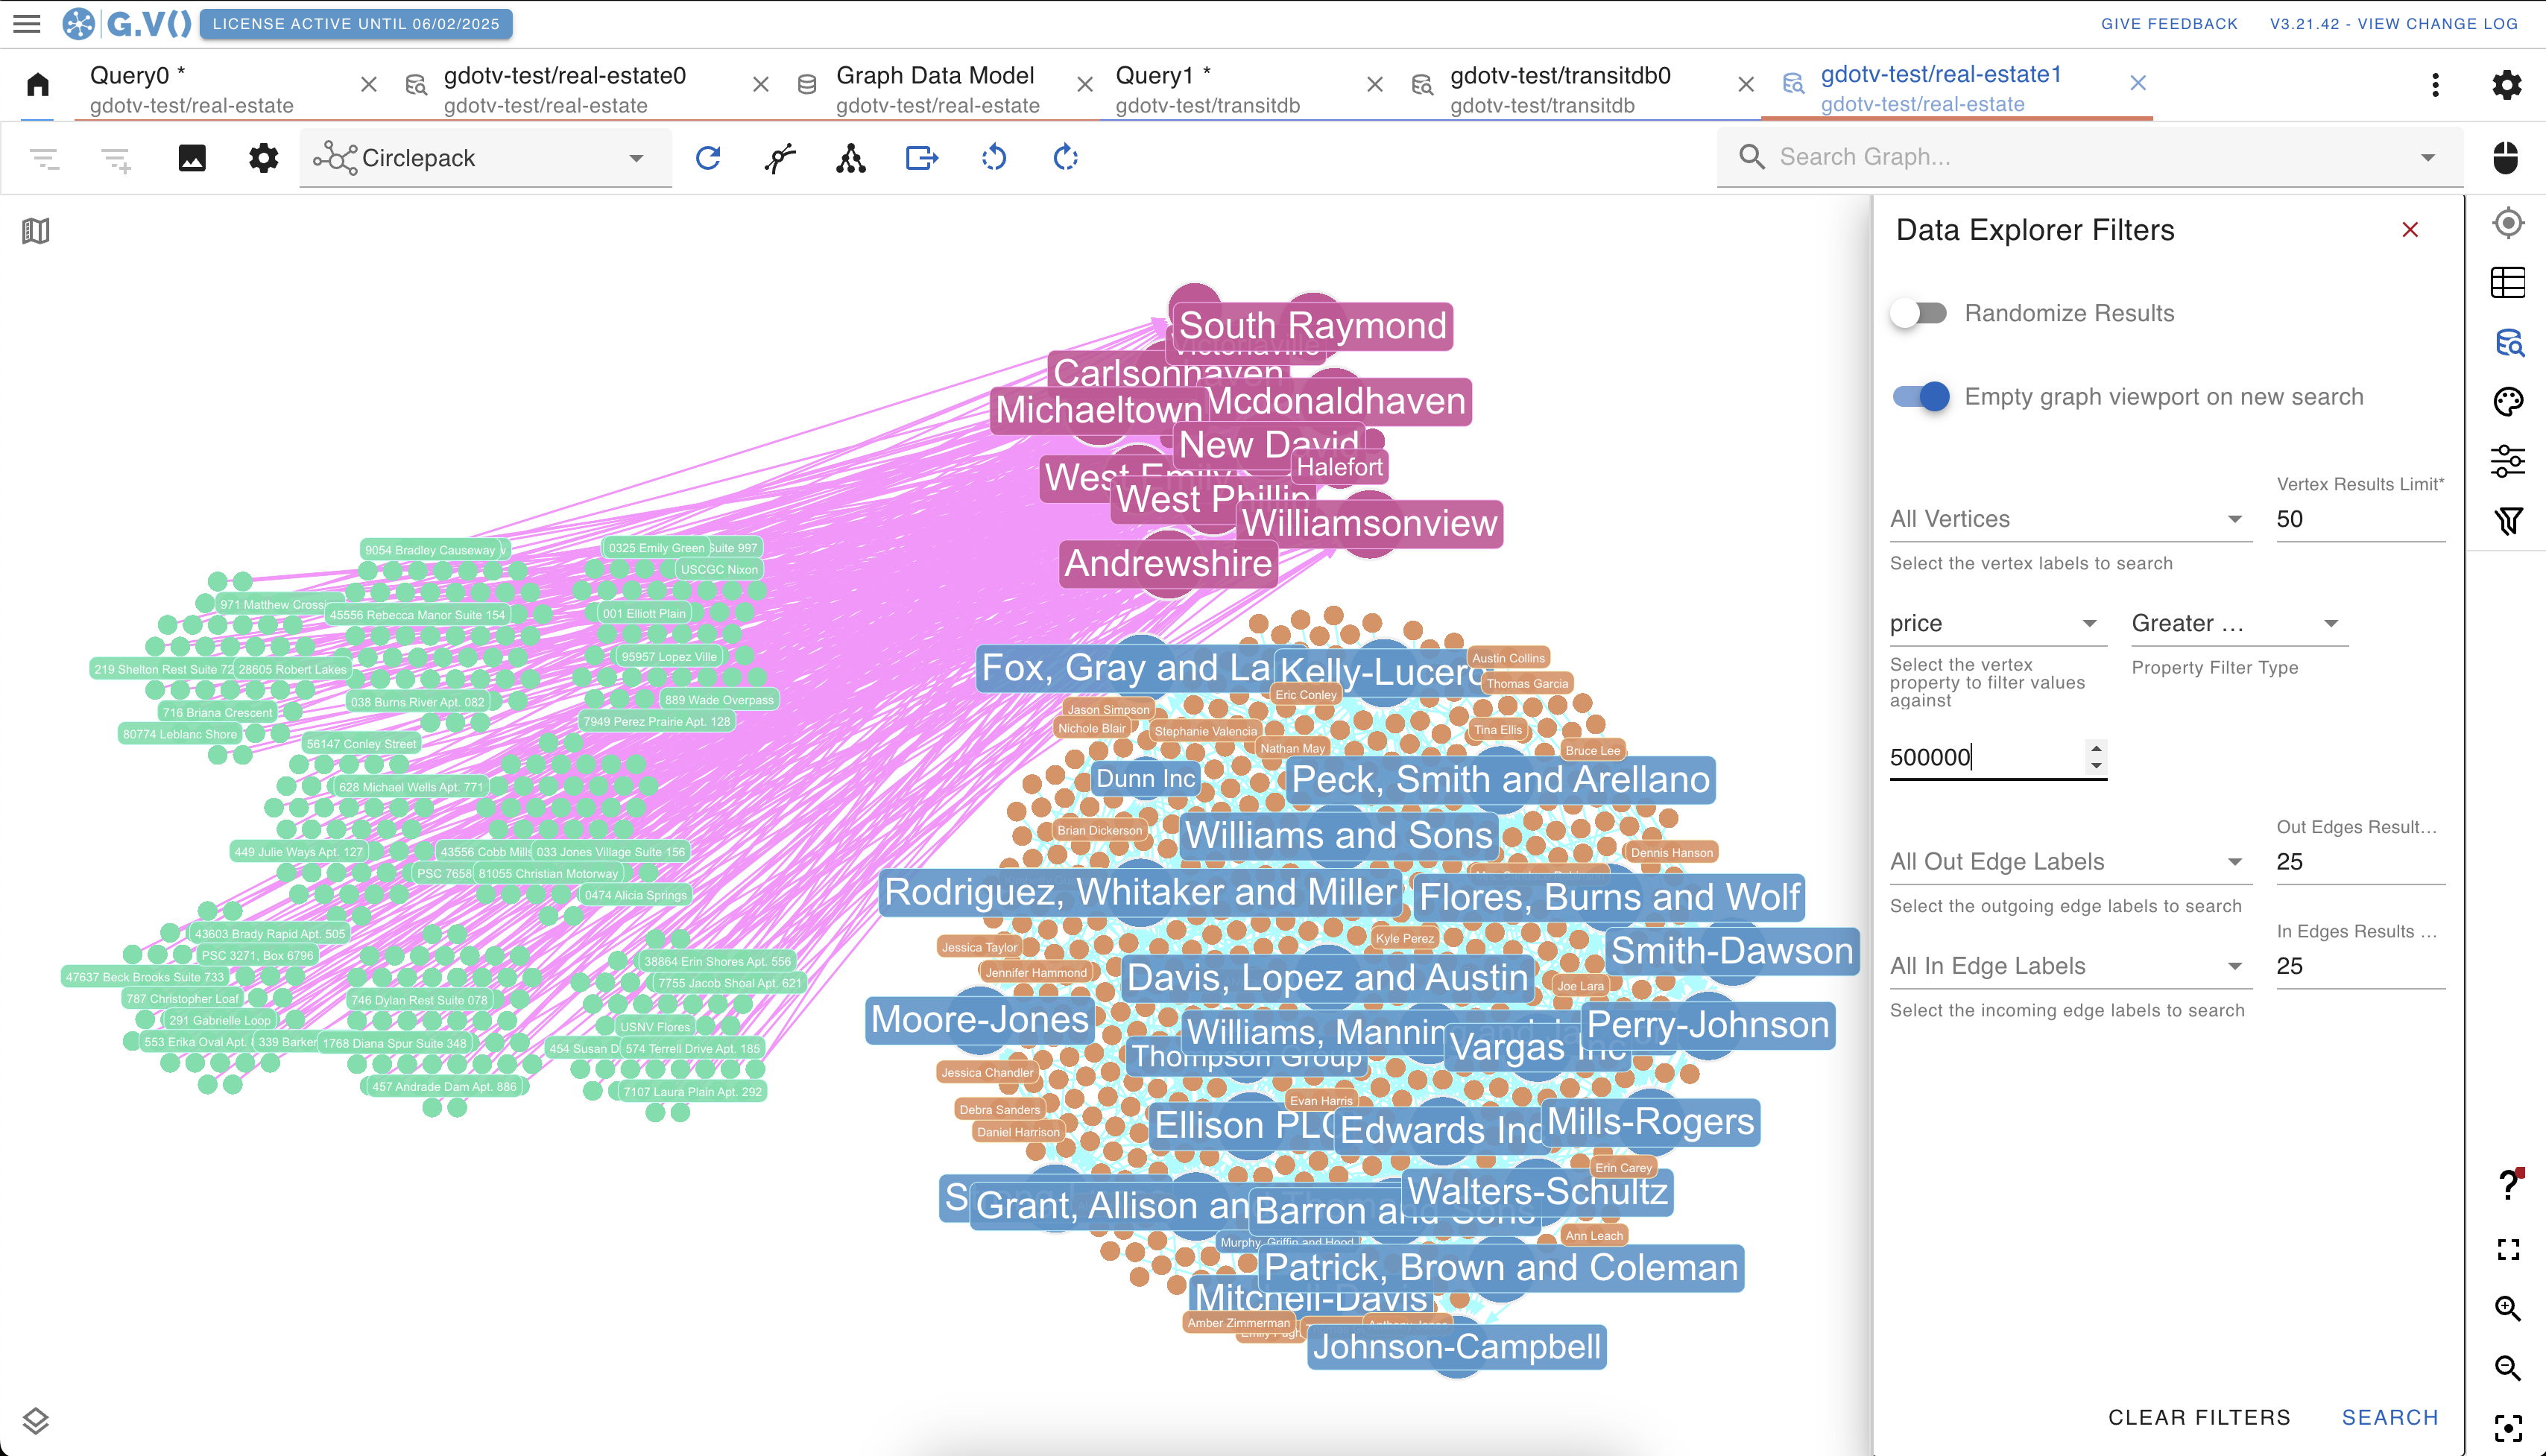
There’s a lot to cover here as far as G.V() is concerned and this deserves a separate article to really delve into the various options available and all the customization that can be configured directly. A couple small visualization examples were shown earlier that should give you a good idea of what to expect when starting to use our software.
One really important feature in G.V() that can sometimes be missing in other database IDEs is the ability to create, update and delete vertices and edges interactively. It’s a huge time saver to be able to maintain individual records without having to rely on writing entire queries. Despite most Apache TinkerPop Graph Systems having no data-schema constraints, G.V() will once again use its knowledge of your data to accelerate this operation. A picture (actually a GIF) speak a thousand words so once again, check out this quick demo:
Visually exploring graph data and modifying it interactively
Data Analysis and Reporting
G.V() bundles a number of features to help with Data Analysis, particularly leveraging our graph visualization engine. At time of writing we don’t have general reporting and graph analytics functionality to offer other than those you can run directly on your graph database. We do however have an upcoming graph analytics feature coming up before the end of the year providing access to various useful algorithms that can be run directly within the user interface – so keep an eye out on this space!
Graph Data Schema visualization and modelling
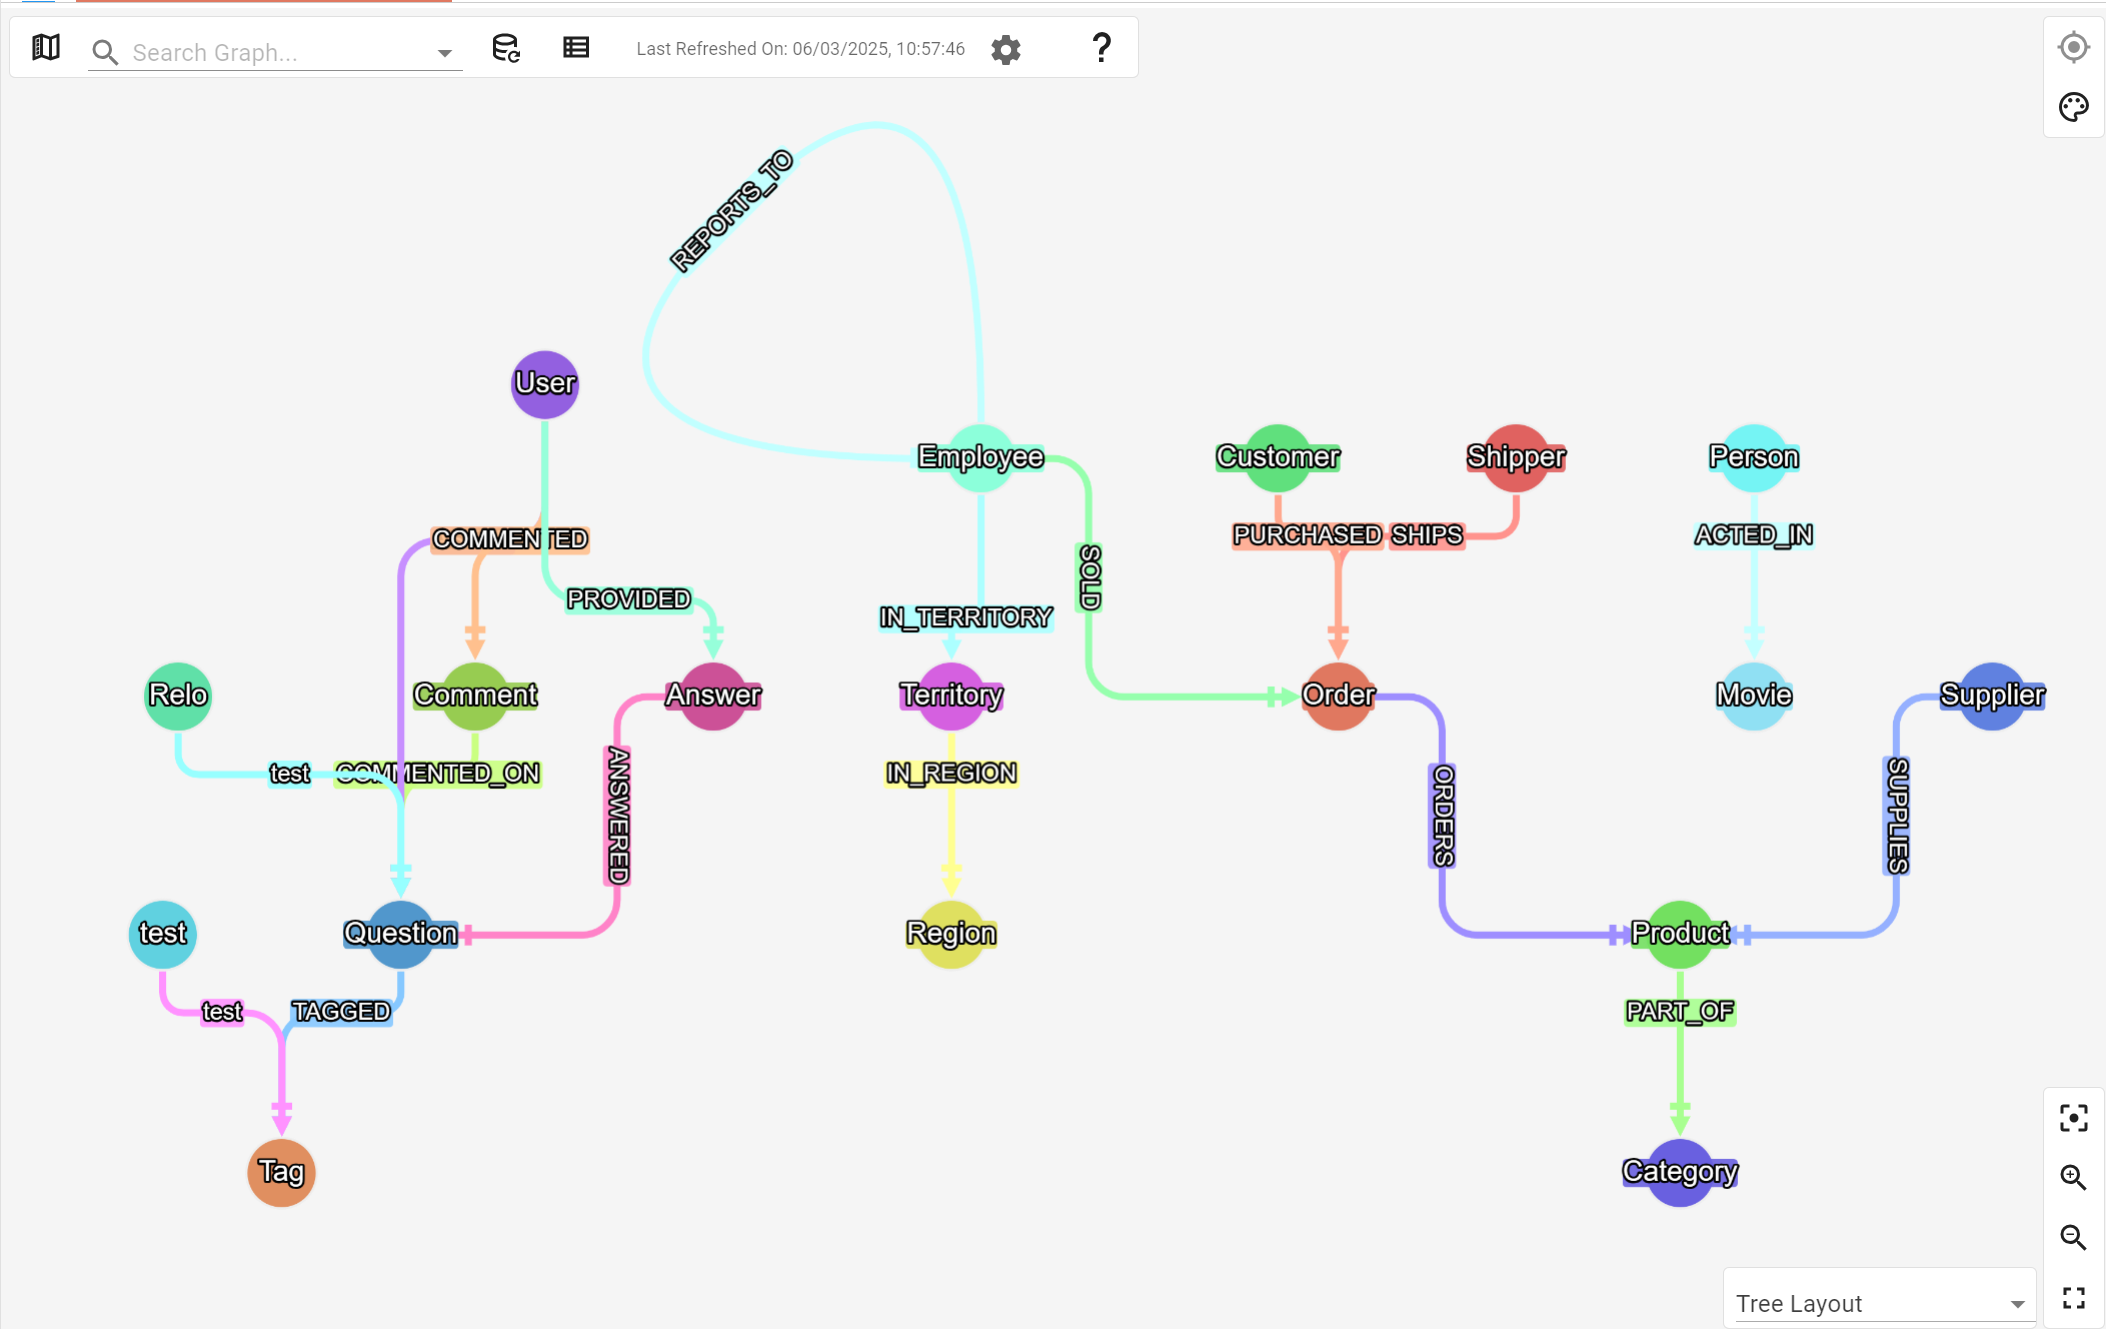
A core aspect of the G.V() software is how it builds an internal representation of your data schema that is then leveraged to power a number of UI features. Being able to quickly see the structure of your data is essential to understanding it and presenting it to others. That’s why we also offer a number of handy views to visualize your data model directly, such as our Data Model Editor, shown below:
An Entity Relationship visualization of one our graph database’s data schema
At time of writing most Apache TinkerPop Graph systems are schema-less, meaning that there is no form of data schema enforcement available (except for a rare few such as JanusGraph and DataStax Enterprise Graph). We’re keeping our eyes peeled for more and we’ll be keen to introduce more data model management functionalities in the future to support existing APIs such as JanusGraph’s as well as potential new ones!
Query Debugging and Profiling
Okay, now we’re getting to some truly unique functionality in G.V(). Typically when we think about debugging database queries, we mostly refer to profiling and query planning – not so much ACTUALLY debugging the query step by step and thread by thread.
So first of all and before anything else, G.V() does offer a lot of convenience features for Gremlin Query Profiling and Traversal Explanation generation, allowing you to get this information about your query in just one click. Additionally, we fully support provider specific functionality in that area such as Amazon Neptune’s Explain and Profile APIs.
But this is where things get really interesting – and you’ll not find this anywhere else – we provide real debugging tooling to simulate individual Gremlin traversals at any step of the query.
This feature deserves its own little deep dive post and we’ll not cover it here in too much detail but here’s a visual of it just to give you an idea of what it provides:
Stepping through a query with G.V()’s debugger and inspecting individual traversals step by step
We believe it is a feature unique to the Gremlin language itself and its ability to be broken down into clear steps, both within the query and for each traversal in the query. To put it short, you can’t break down a SQL statement such as:
SELECT * from person GROUP BY age
in SQL into multiple steps but looking at the Gremlin equivalent,
g.V().hasLabel(“person”).group().by(“age”)
you can clearly see the distinct steps of the query leading to its final result (person records grouped by age).
This allows to really dig deep into how Gremlin traversal works as well as troubleshoot queries that aren’t behaving as expected, say for instance due to a missing edge or property.
Secure and easy to install
G.V() is not a SaaS (Software as a Service) or PaaS (Platform as a Service) solution. That may sound like a step backwards in the evolution of software delivery. After all, we’re used to doing more and more directly on websites either deployed internally to our organizations or offered as an online service.
Here’s the thing – we’re connecting to databases, which will likely contain sensitive data that is owned by your organisation alone. We don’t want that going anywhere we don’t want to! Additionally, what’s more frustrating than wanting to get started with a solution but having to figure out how to deploy it, maintain it and monitor it before anything else?
G.V() is keeping things simple – it’s a software executable compatible with Windows, MacOS and Linux that you can simply install and get started with right away. The software runs locally on your device and network and is therefore not requiring your databases to be accessible outside of your network. Everything stays in your network and in your organisation without the need to navigate complex deployment scenarios or data privacy concerns.
G.V() is a continuously evolving software – we’ve put the Apache TinkerPop community’s feedback and interests at the centre of our solution’s design to help us shape it into a product that answers YOUR needs. Our aim is to deliver the best possible product to support and enhance the growing ecosystem of Apache TinkerPop Graph Systems. We believe we have the most comprehensive Gremlin IDE to date, and we’re going to keep adding more and more awesome features to help you make the best use of your time working with your graph database.
Whether you’re just getting started or already fully deployed with Amazon Neptune, Azure Cosmos DB, JanusGraph, and the many other graph databases we support, you must give G.V() a try!
We offer a free tier for our product and a no obligation trial for our more advanced features allowing you to get started right away with no overhead or complication. So what are you waiting for? Install G.V() now!
Did you find our article interesting? Have you got any thoughts? Give us a comment below!