
Azure Cosmos DB Data Explorer vs. G.V() : A Side-by-Side Comparison
 : A Side-by-Side Comparison")
When you’re working with a graph database, your DB client and tooling make a big difference.
Database performance matters – and you should always choose the graph database that best meets the needs of your particular application – but how human developers interact with that database is just as important. Poor database tooling costs you time and morale.
Today, I want to take a look at graph database clients for Azure Cosmos DB and highlight the key differences between Azure Cosmos DB Data Explorer and G.V(). My goal is to give you an unbiased tour of what each client does and how they stack up in terms of both similarities and differences.
Let’s dive in.
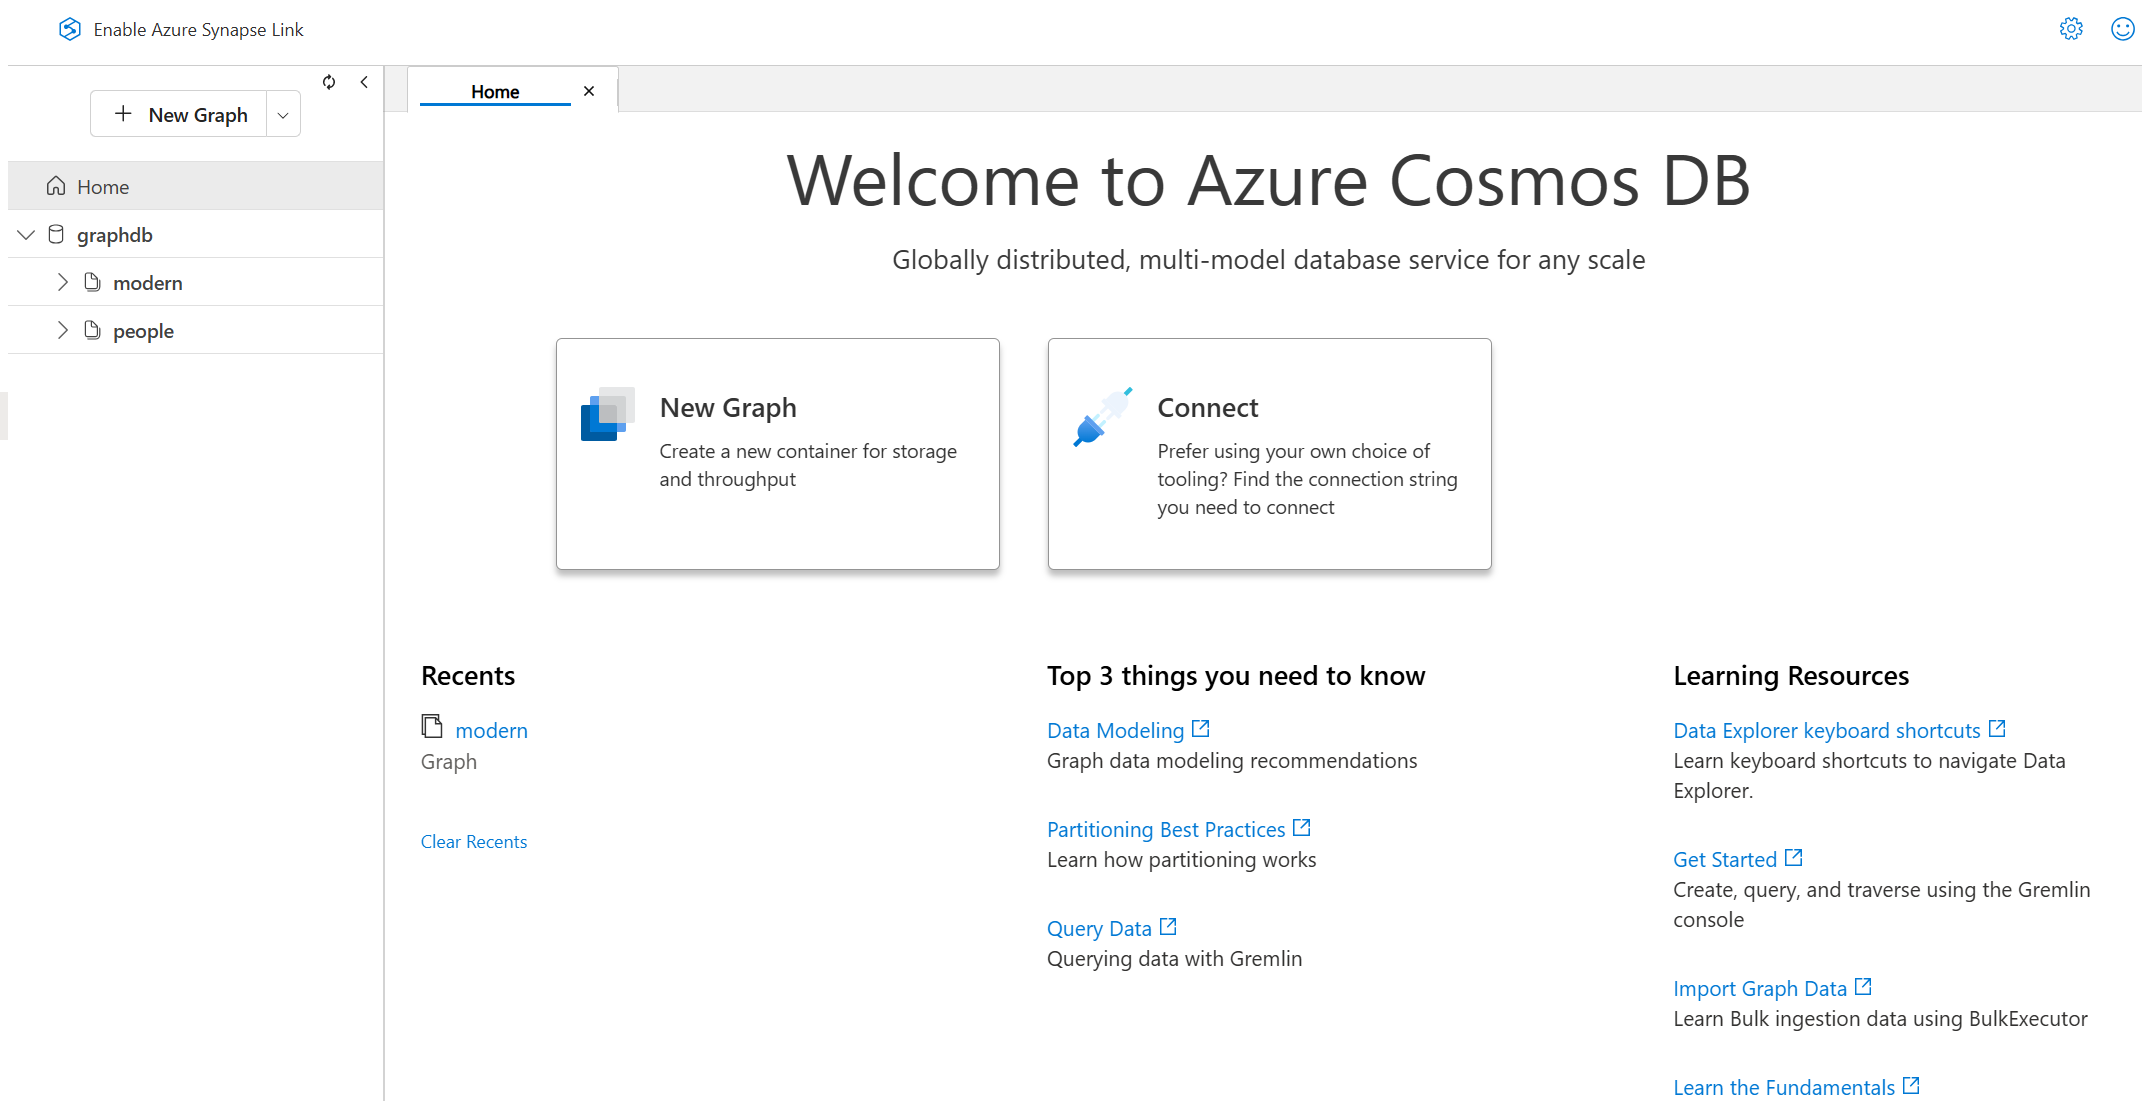
An Overview of Azure Cosmos DB Data Explorer
An Azure Cosmos DB instance is just like an RDBMS instance: you can connect it, you can host your data on it, you can query it, etc. This should mean it’s pretty easy and familiar to work with for most backend developers. Azure Cosmos DB is one of the easiest databases to deploy globally and at scale, offers multi-modal capabilities, and also happens to be used by a “little known” product ChatGPT…
Configuring Your Graph Data in Containers in Data Explorer
When deploying an Azure Cosmos DB instance, you’ll also get access to its proprietary browser-based querying and visualization tool, Azure Cosmos DB Data Explorer. When it comes to its Gremlin API, there’s a few things you can do with Azure Cosmos DB Data Explorer that you can’t do with G.V(). We’ll take a closer look at those below.
The main thing that Data Explorer allows you to do – that G.V() doesn’t – is to configure new graphs or existing ones in containers.
These containers are basically secluded instances of data. This means you can have multiple different graphs, all hosted on a single Azure Cosmos DB account rather than needing one Azure Cosmos DB account per graph that you want to host.
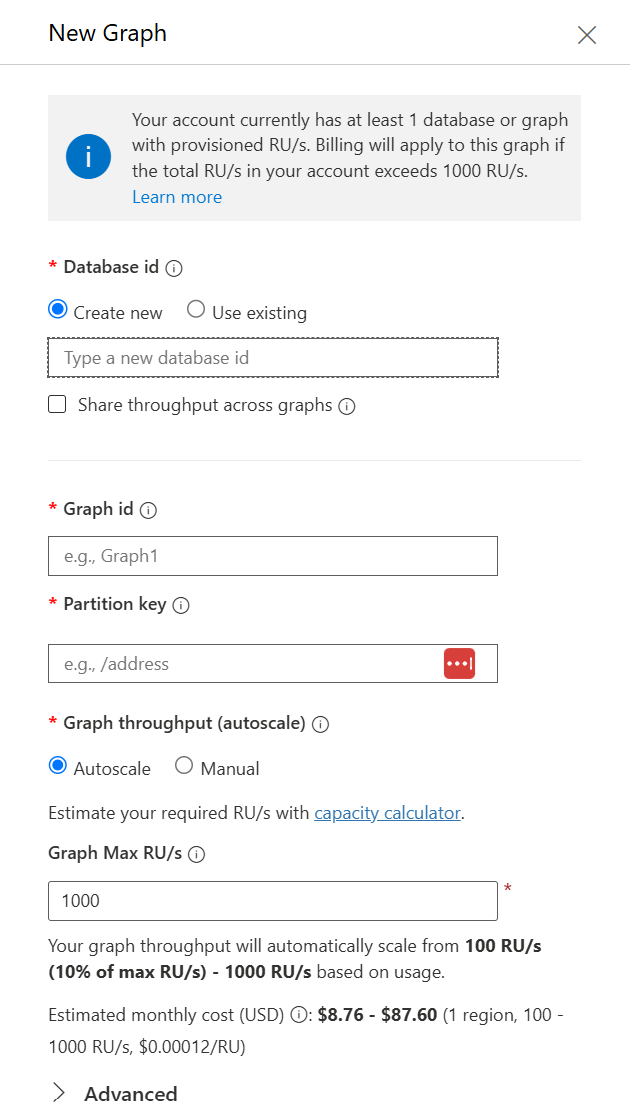
This ability to containerize different graphs is immensely helpful when you need to keep certain datasets private or from influencing one another. I won’t go into too much more detail on the containerization process because it’s not as related to this blog post, but it’s worth pointing out.
The Gremlin Query & Graph Visualization Tools in Data Explorer
Pictured below is where you can write your Gremlin query and see the results in Data Explorer.
To be honest, this query editor is rudimentary. You might notice a few things are missing, including:
- No autocomplete
- No syntax highlighting
- No attached Gremlin documentation
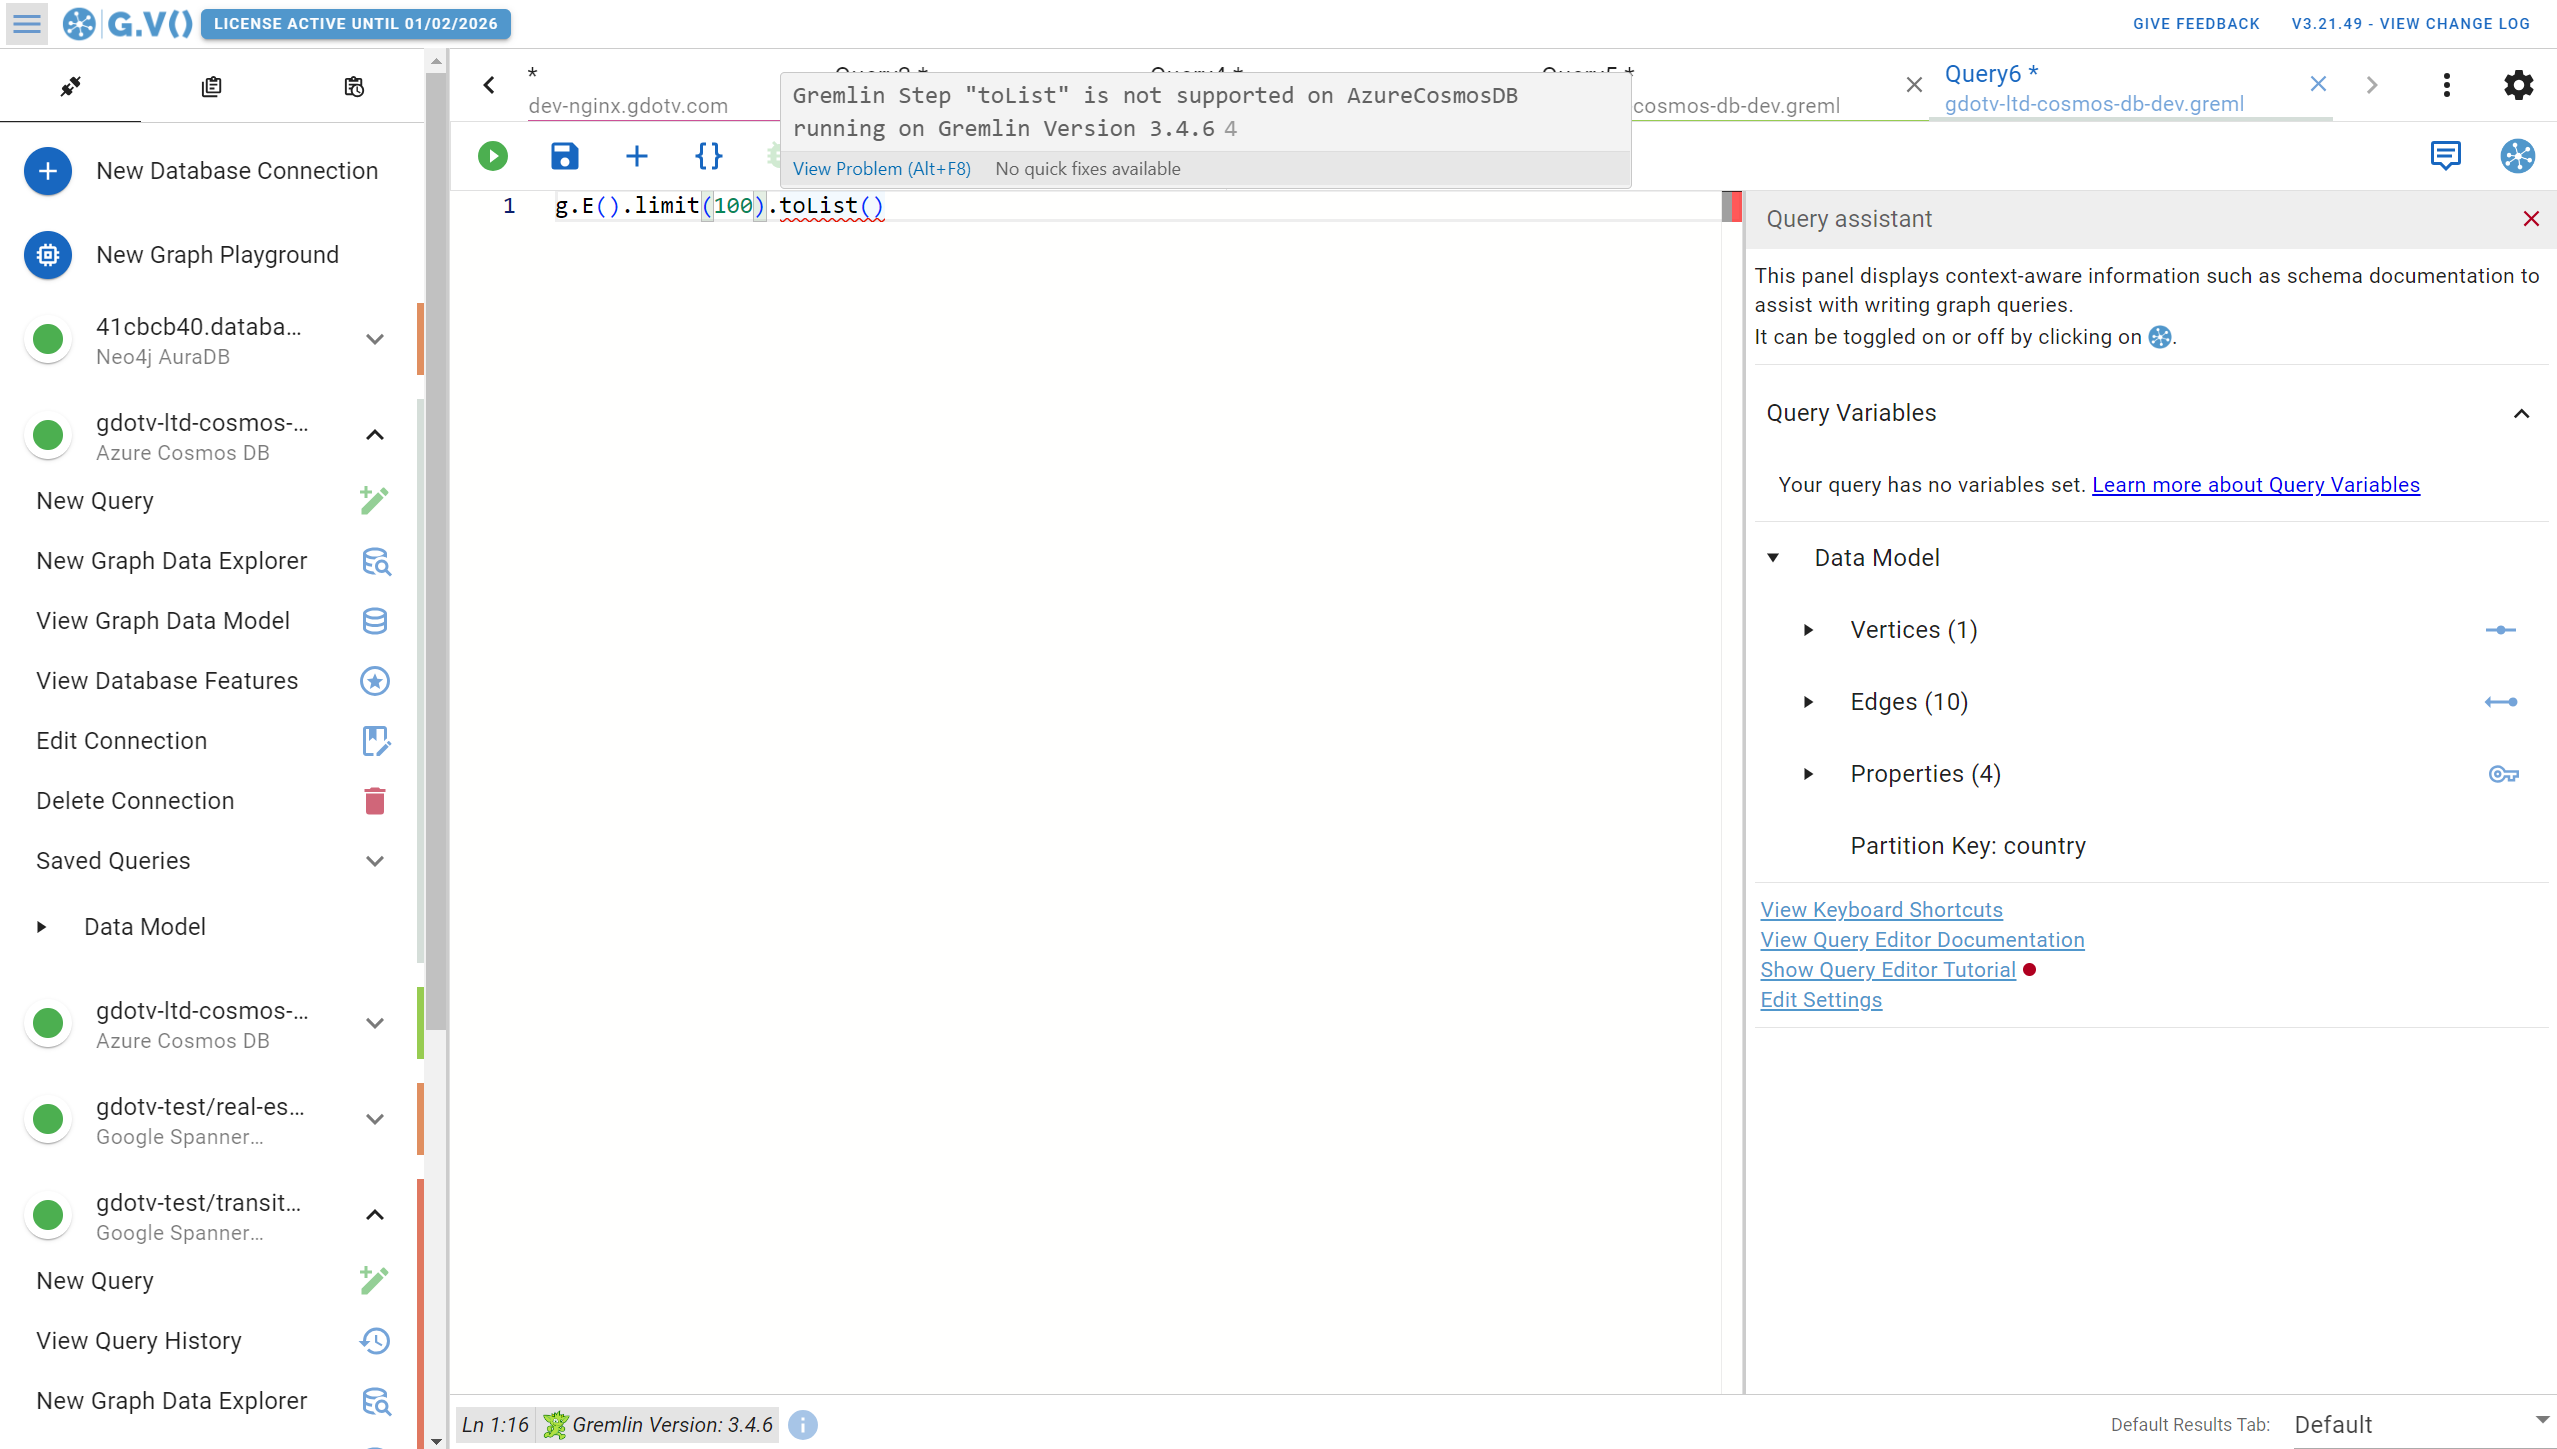
Essentially, you’re expected to write a Gremlin query perfectly (or paste it in from another source) and then you hopefully get the correct result. There’s no debugger or diagnostic tool for query typos. By contrast, G.V() has a lot to offer in terms of Gremlin query testing and debugging.
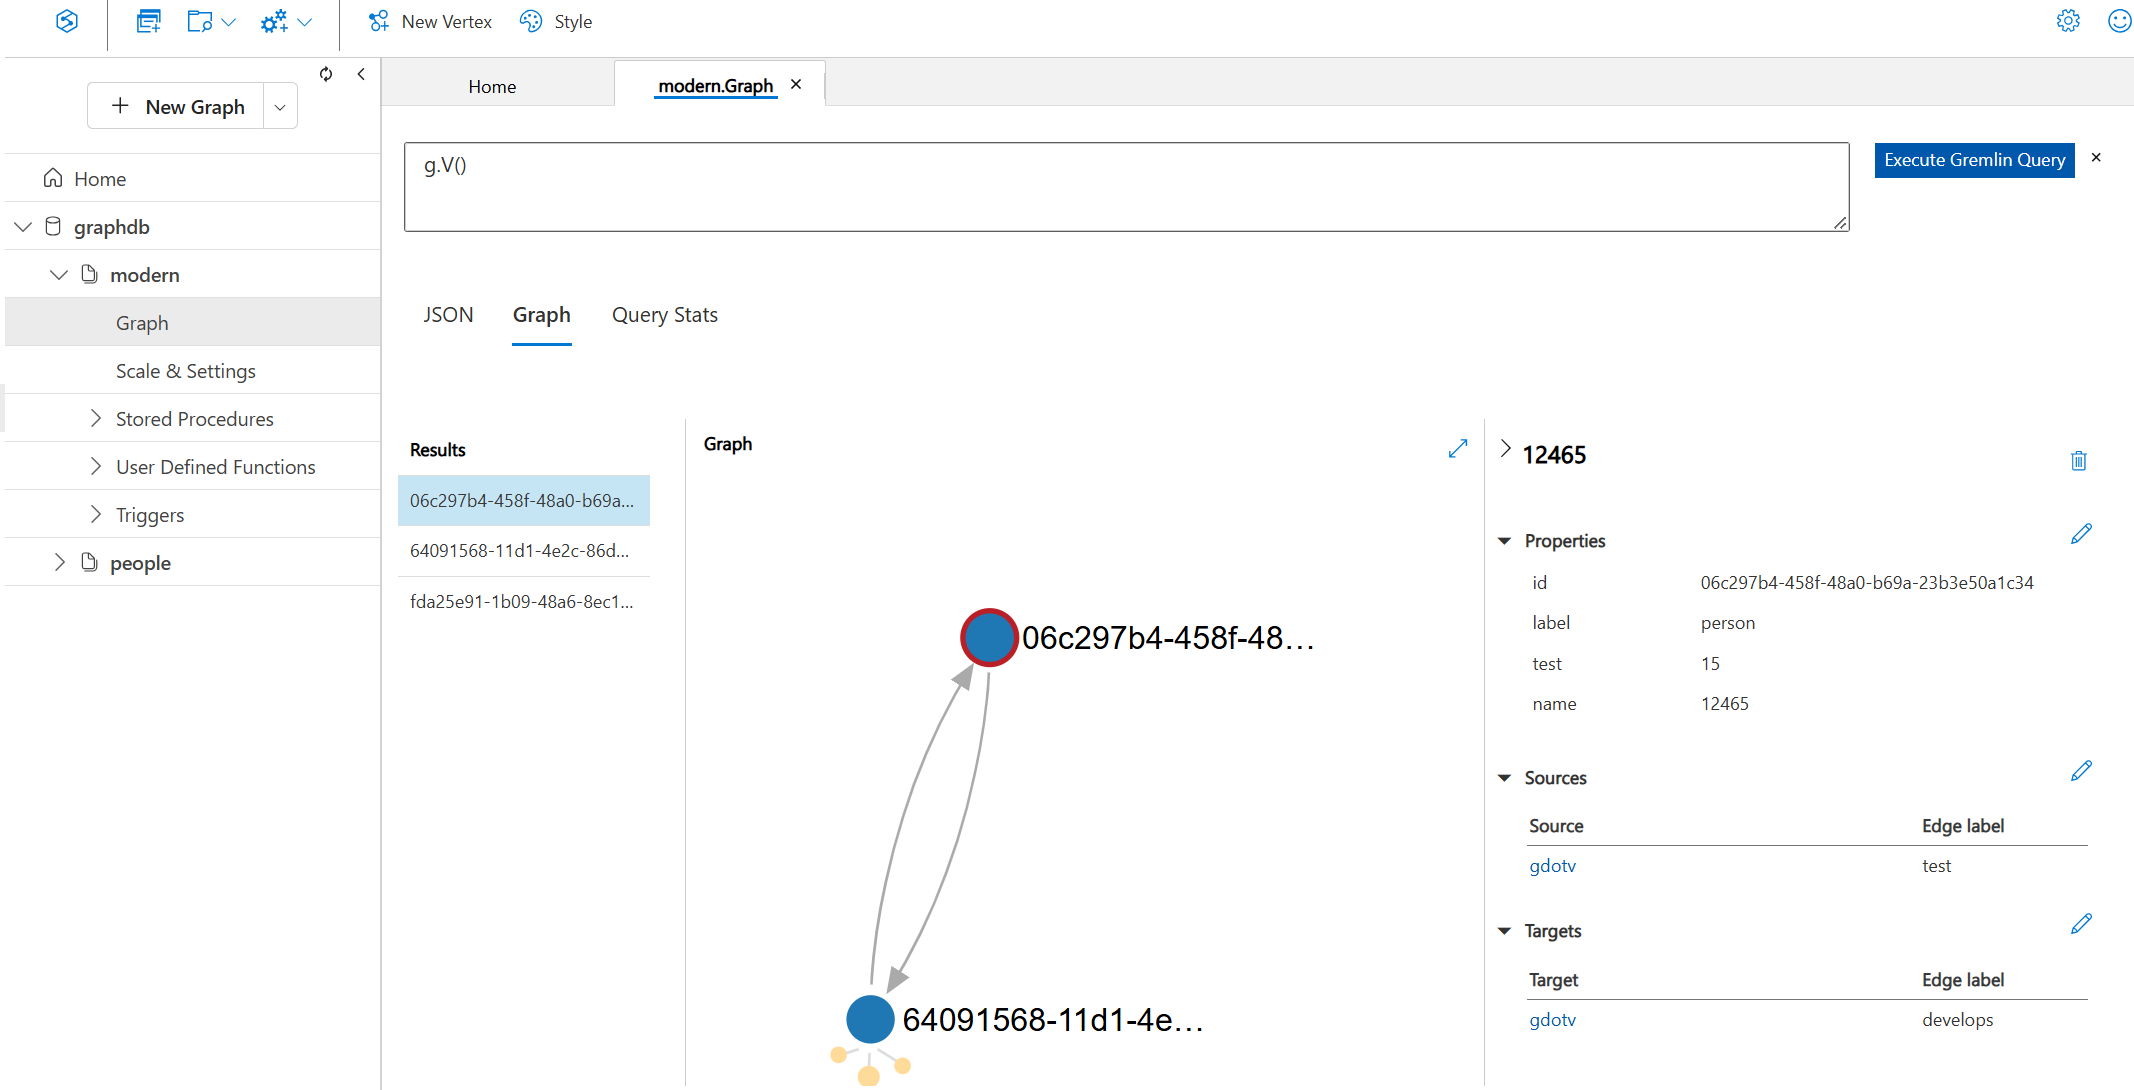
When you run a query on Azure Cosmos DB Data Explorer, the visualization parameters are strict and limited: Unless your database query specifically returns vertices, then you’re not going to get a graph display of your data. This makes Data Explorer a bit challenging to use as a graph visualization tool because just getting to a graph display is not quick or straightforward.
For example, in this Gremlin query below, I’m not returning vertices/edges directly. Instead I’m returning a path which technically contains both.
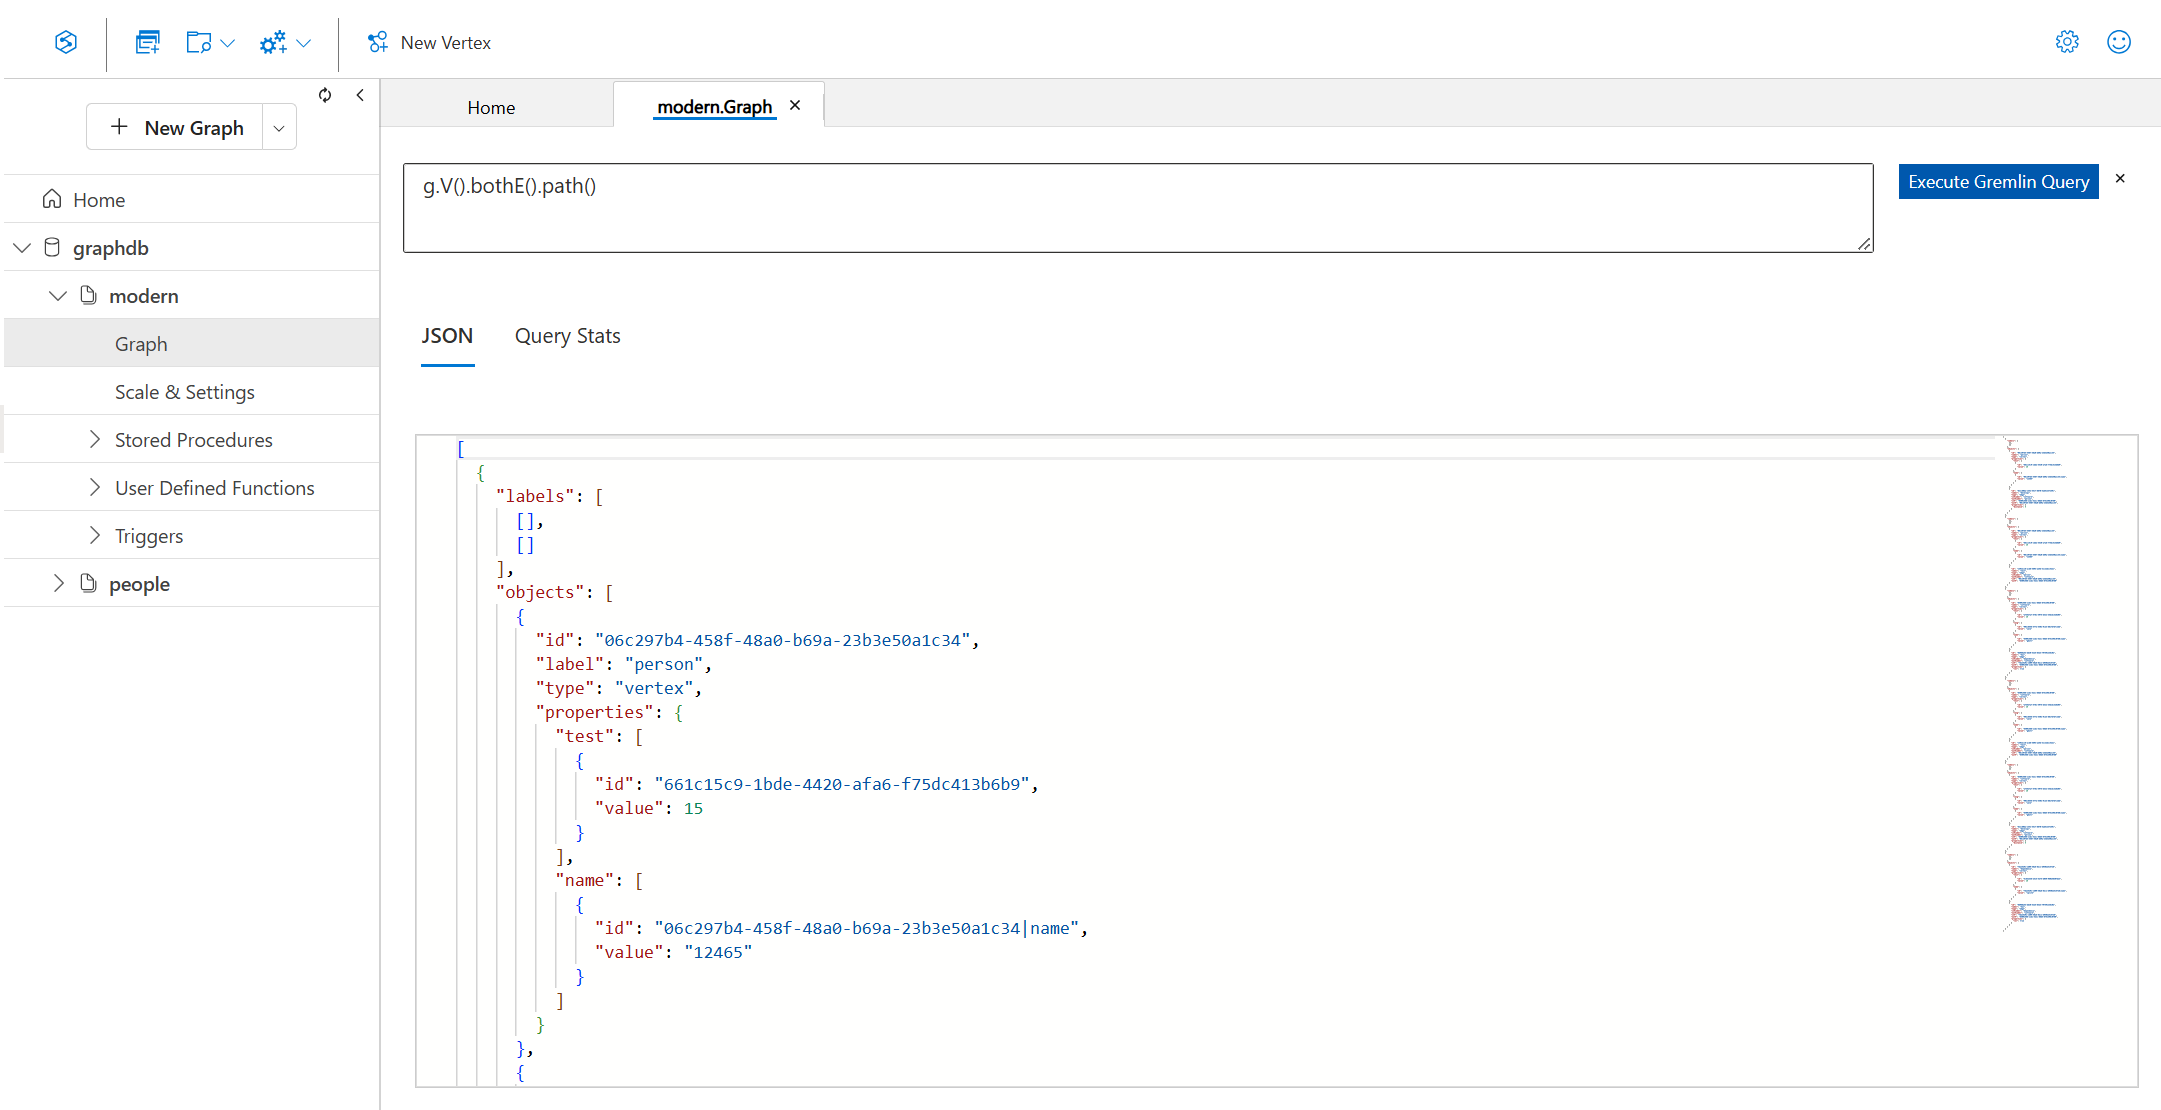
As you can see, Data Explorer is not really capable of turning my Gremlin query into a useful data visualization of my path through the graph.
Moving on, you also have the option to Load Graph which will load some of your graph data into a single viewport. Here’s what our example loaded graph looks like:
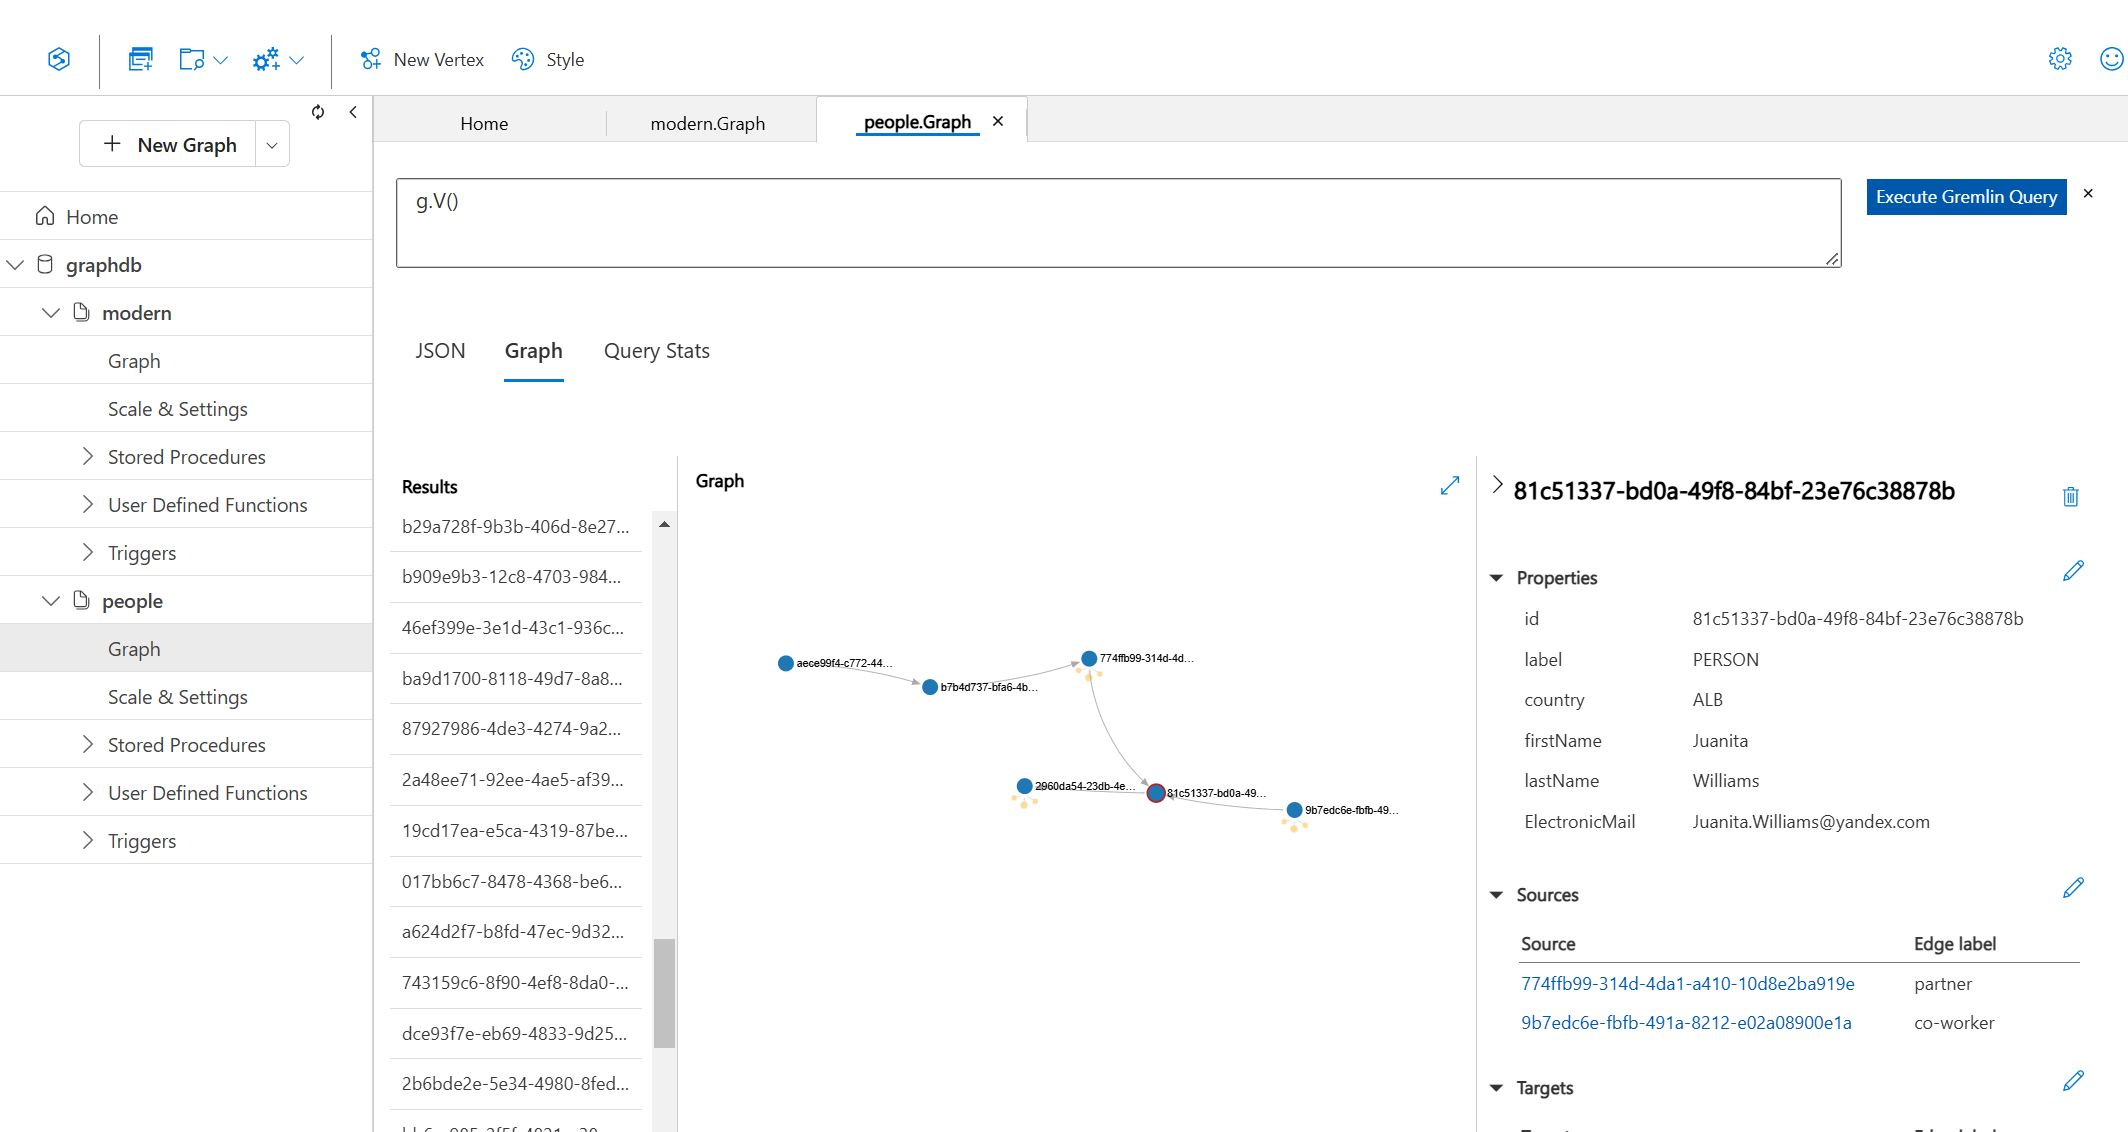
Data Explorer allows you to view your graph and the information pertaining to all the vertices and edges on the graph. For example, if you click on a specific label – like in the screenshot above– you can view the details for that given vertex.
In the sidebar (above), you see all the properties of the selected vertex, as well as all of the edges (both in and out) assigned to that vertex. You can add, edit, and delete these vertex properties directly in Data Explorer. Ditto with creating or updating edges to other elements in your graph.
Unfortunately, there isn’t an option to visualize the layout of your graph besides this basic display shown above. Of course for some use cases, this might be all you need, but if you need more graph visualization capabilities, this isn’t enough. The display itself is very limited, only allowing for a handful of vertices and edges being shown in the viewport.
Other Miscellaneous Features in Data Explorer
A few other nice features of Data Explorer are worth mentioning.
For any given Gremlin query, Data Explorer will show you query stats like the request charge, a metric specific to Azure Cosmos DB that tells you how many processing units the query costs. We’ve included a similar display in G.V() as it’s very important to understand the impact of the queries you design and run on your database.
Another feature worth mentioning is the JSON display. This gives you the raw JSON-formatted information returned by Azure Cosmos DB when performing a query.
There are a few other benefits to Data Explorer that are important to highlight:
- It comes free with Azure Cosmos DB. It’s already part of the package.
- It’s also available on their web interface, so it’s easy to use. You deploy your Azure Cosmos DB account, and you can immediately just get on Data Explorer and start running your queries.
That’s a summary of Azure Cosmos DB Data Explorer. It’s a simple tool with basic features. For the first few minutes interacting with Azure Cosmos DB, that’s more than enough. For most developers however, Data Explorer will quickly show its limits and leave you wanting more.
Let’s switch over to G.V() and see how its features contrast to Data Explorer.
An Overview of G.V() Graph Database Client
G.V() is a desktop graph database client available on Windows, macOS and Linux. It can be downloaded from our main page and takes no more than a minute to install.
Once installed, connecting to your Azure Cosmos DB database is a straightforward process, as shown below:
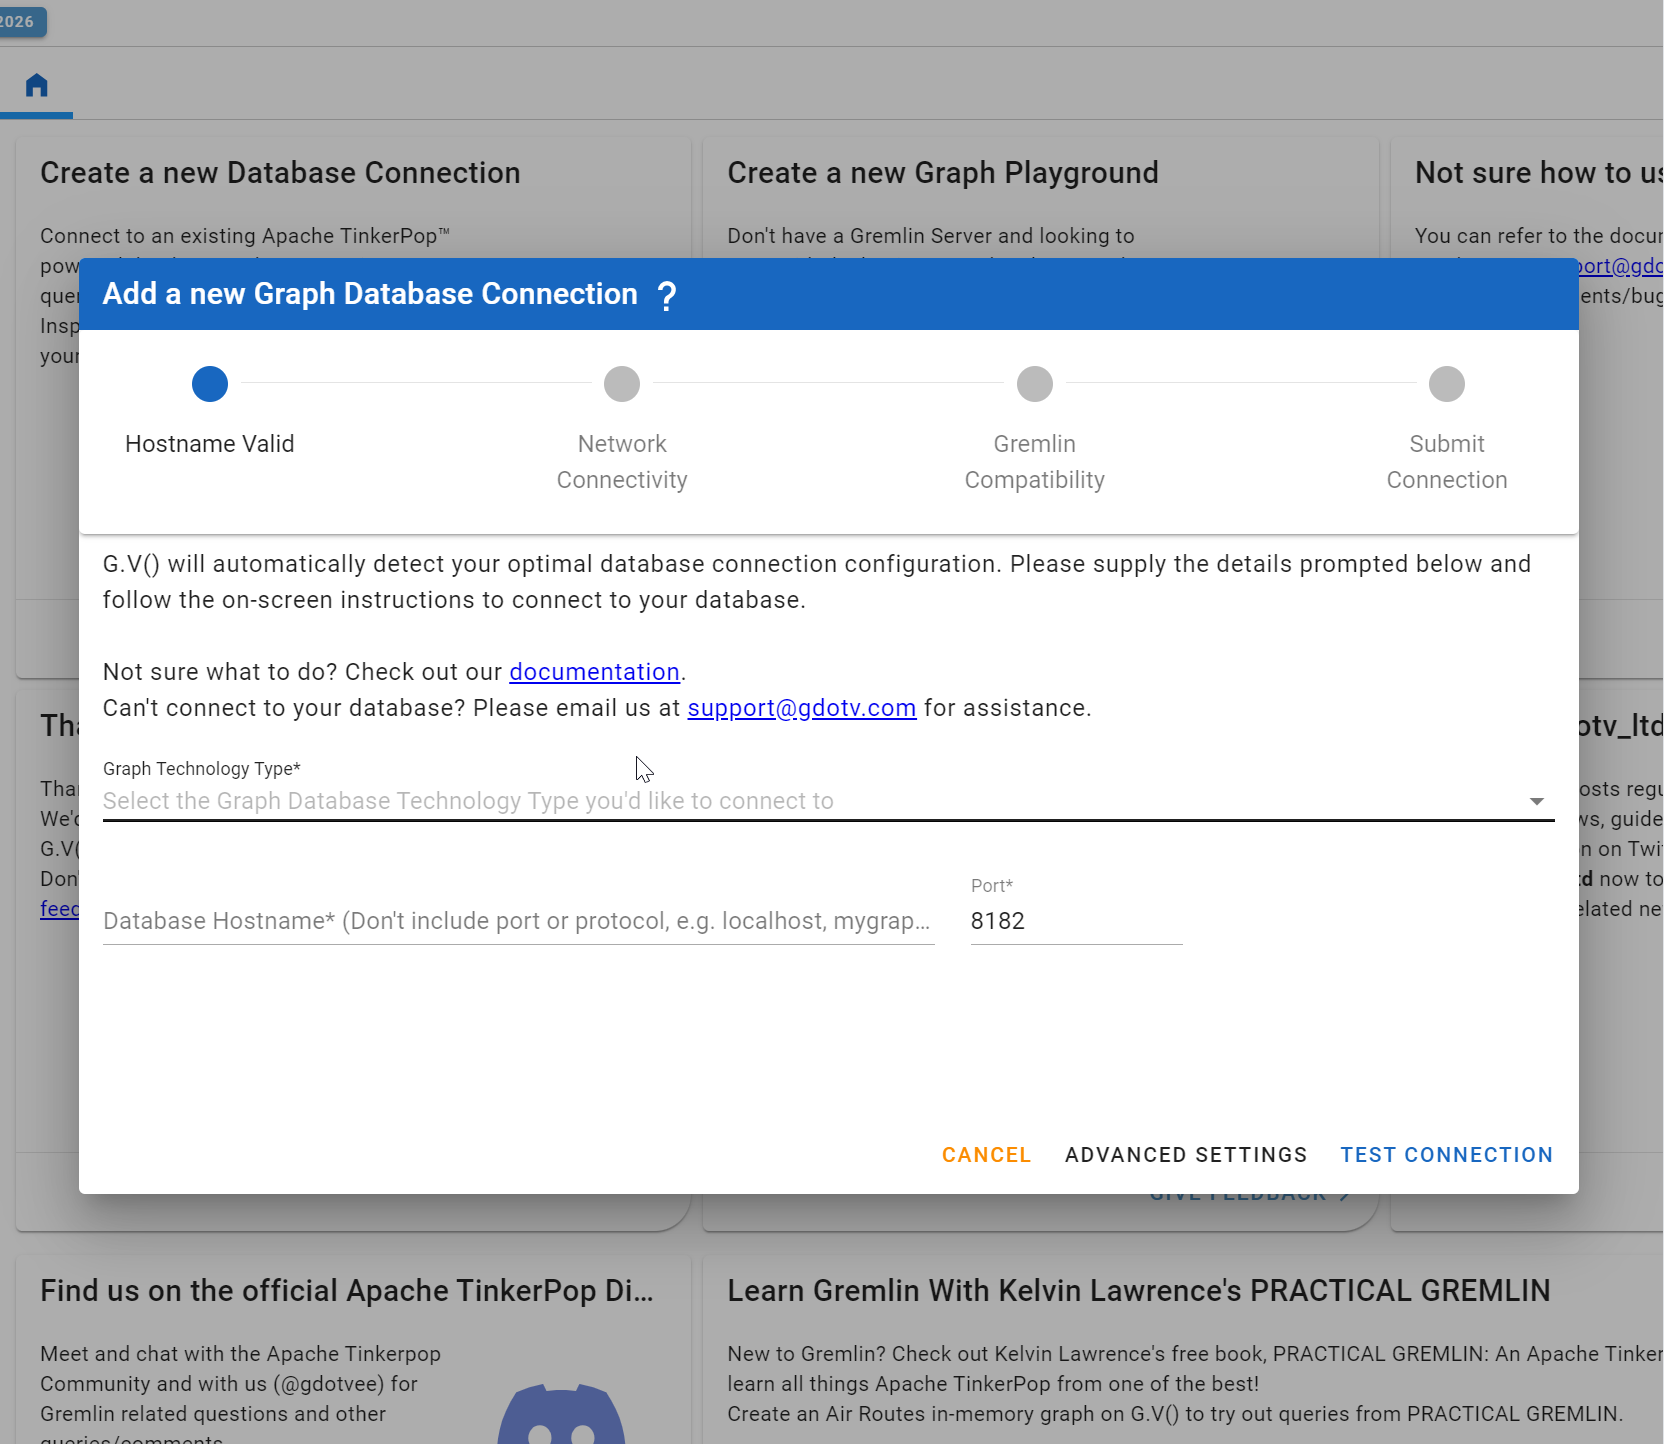
Just to summarize, these are the steps:
Click on New Database Connection, select Azure Cosmos DB. Enter your Gremlin endpoint.
From there, you’ll be prompted to add your Azure Cosmos DB Auth Key and other database details.
After that, you’re good to go. It’s an extra step, but you only need to do it once. Now that you’re set up, it’s time to explore what G.V() offers you as a graph database user. (Hint: It’s a lot.)
The G.V() Query Editor
Let’s start our tour with the G.V() query editor.
Something that the query editors in both Azure Cosmos DB Data Explorer and G.V() offer is the ability to save your database queries to use again later, with the option to organize them into folders. Every backend dev has queries you need to return to frequently, and it just makes sense to be able to save them quickly for later reuse.
But in sharp contrast to the Data Explorer query editor, G.V() has a range of features to help you write and debug your Gremlin queries, starting with autocomplete and context-aware suggestions.
With every suggestion, you’ll get attached documentation from the official Gremlin query language documentation which is really useful if you’re trying to learn the query language or improve your Gremlin knowledge.
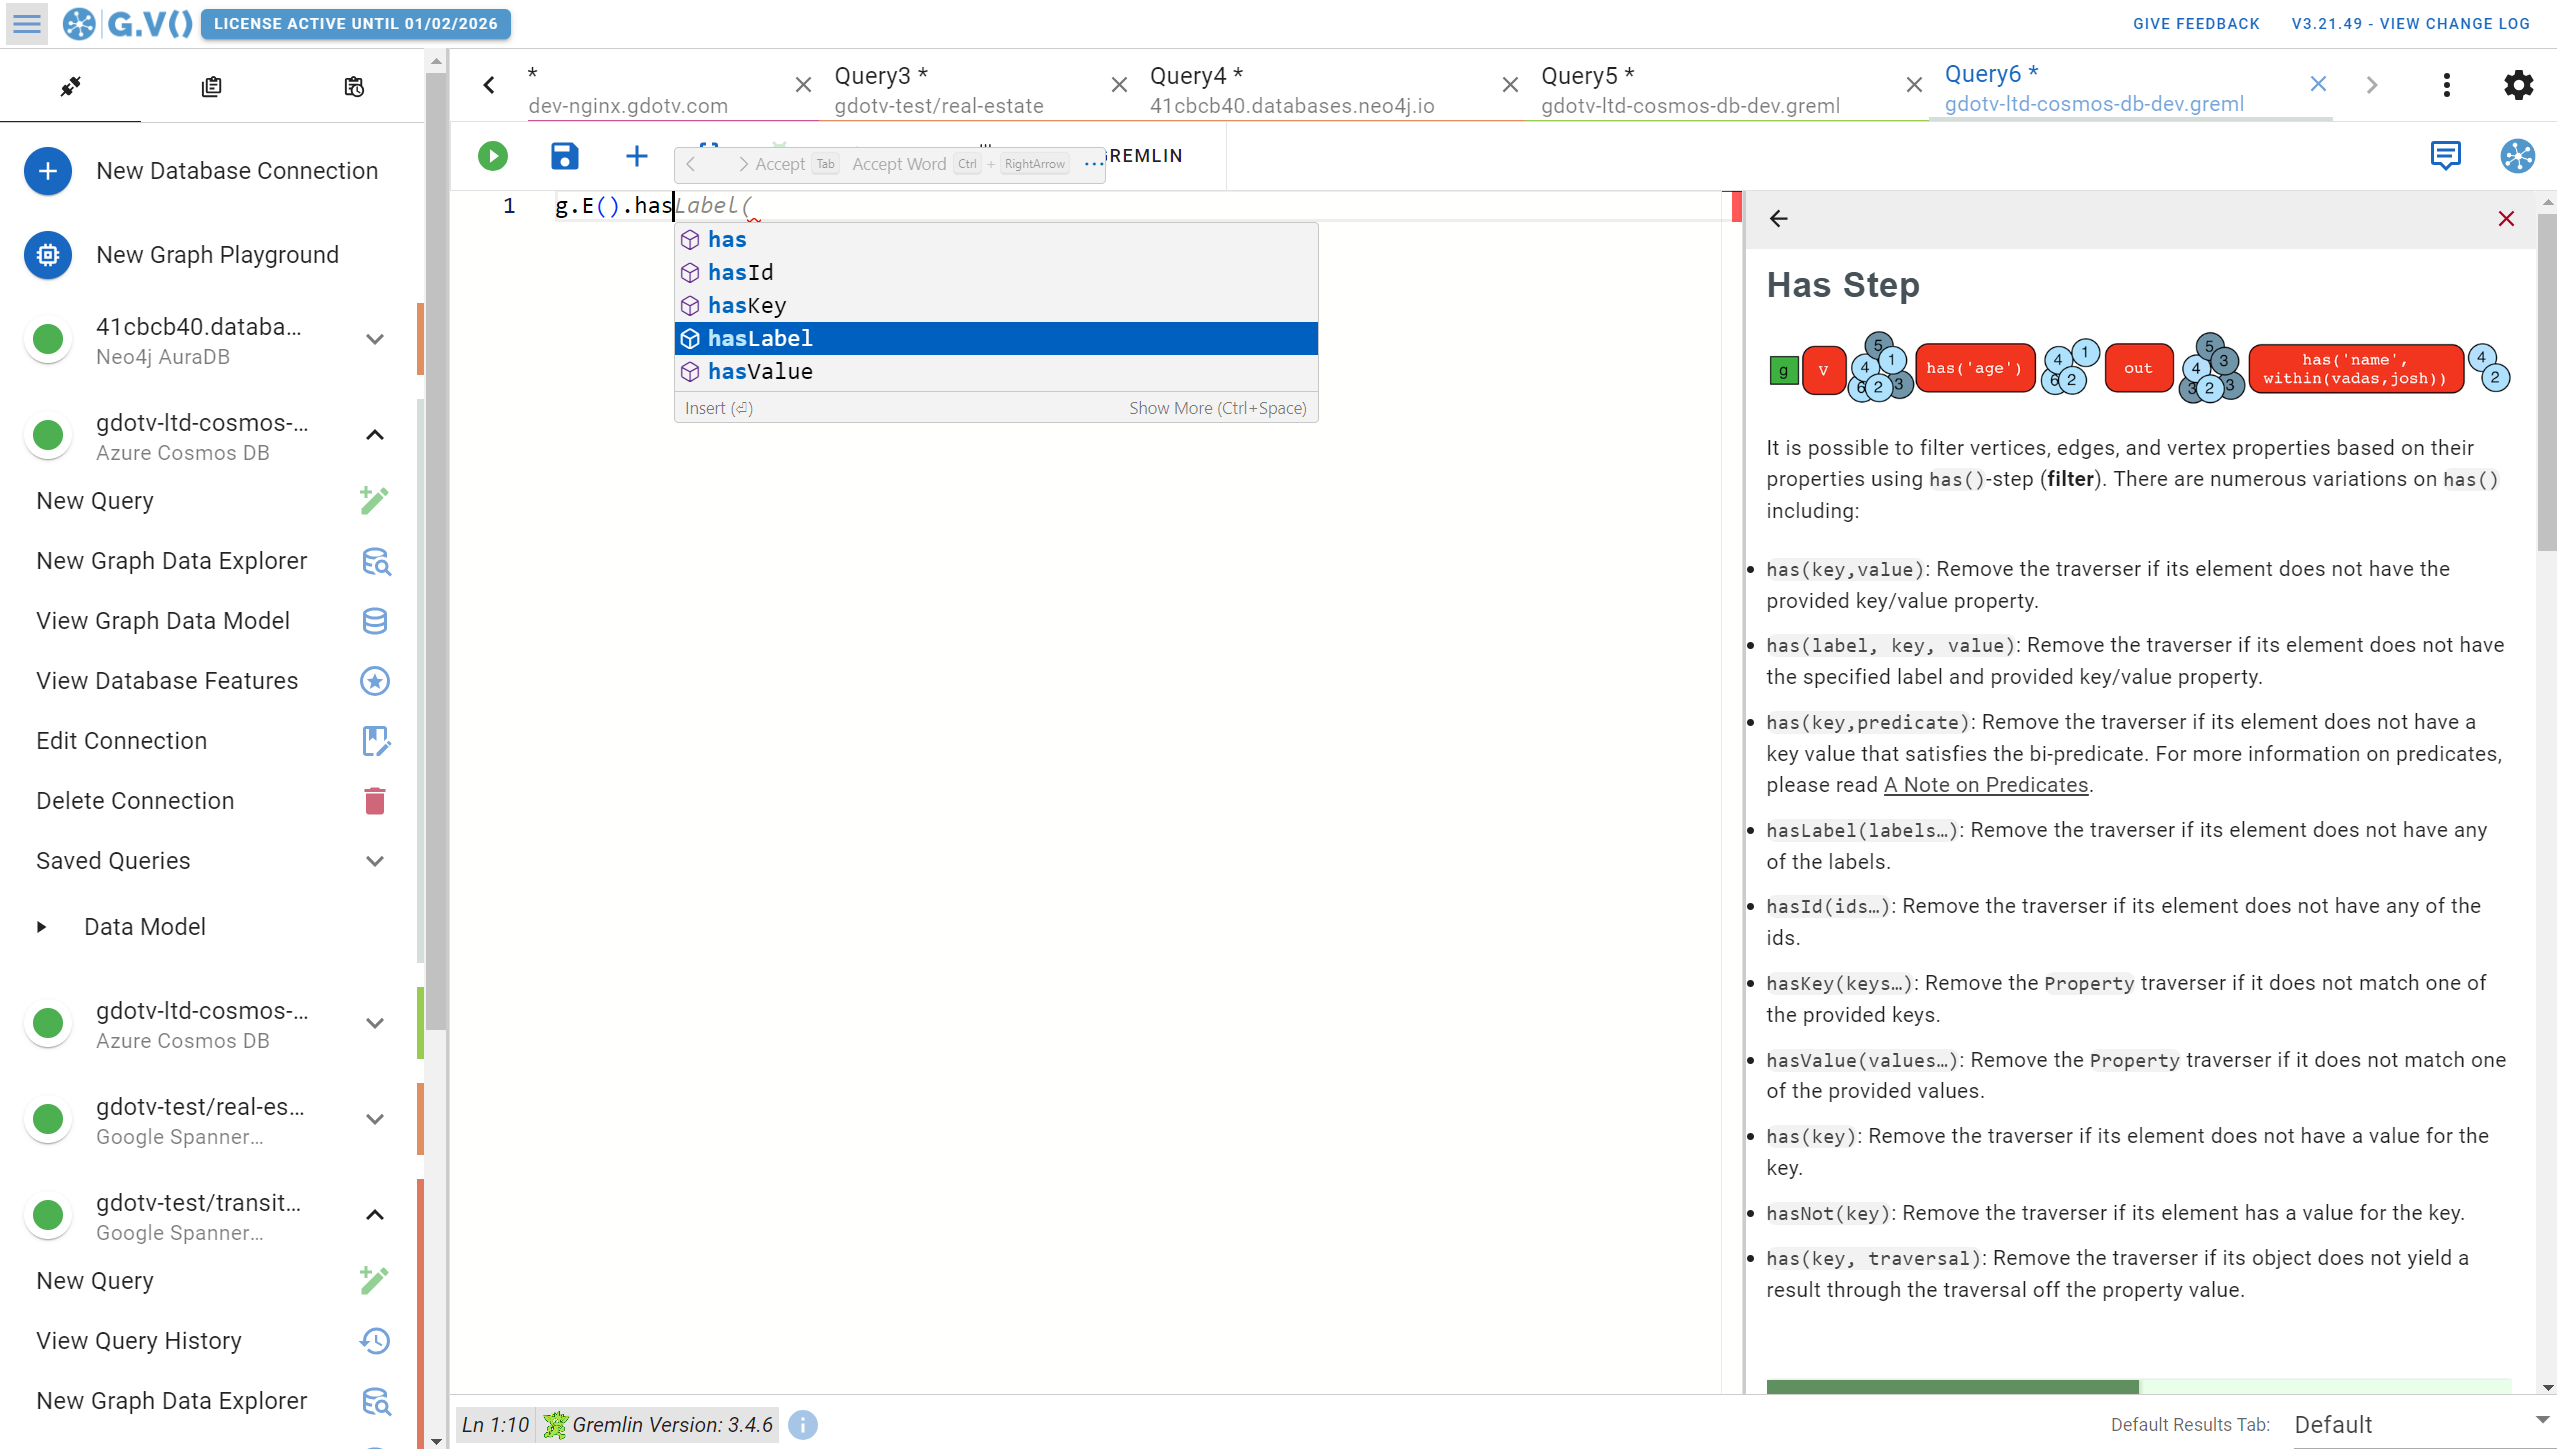
G.V() also gives you context-aware suggestions based on your specific data model. For example, if your query includes edges, G.V() will suggest the edge types that currently exist in your database. Likewise, you’ll receive documentation of those edges, including their properties, their origin vertex, and their destination vertex.
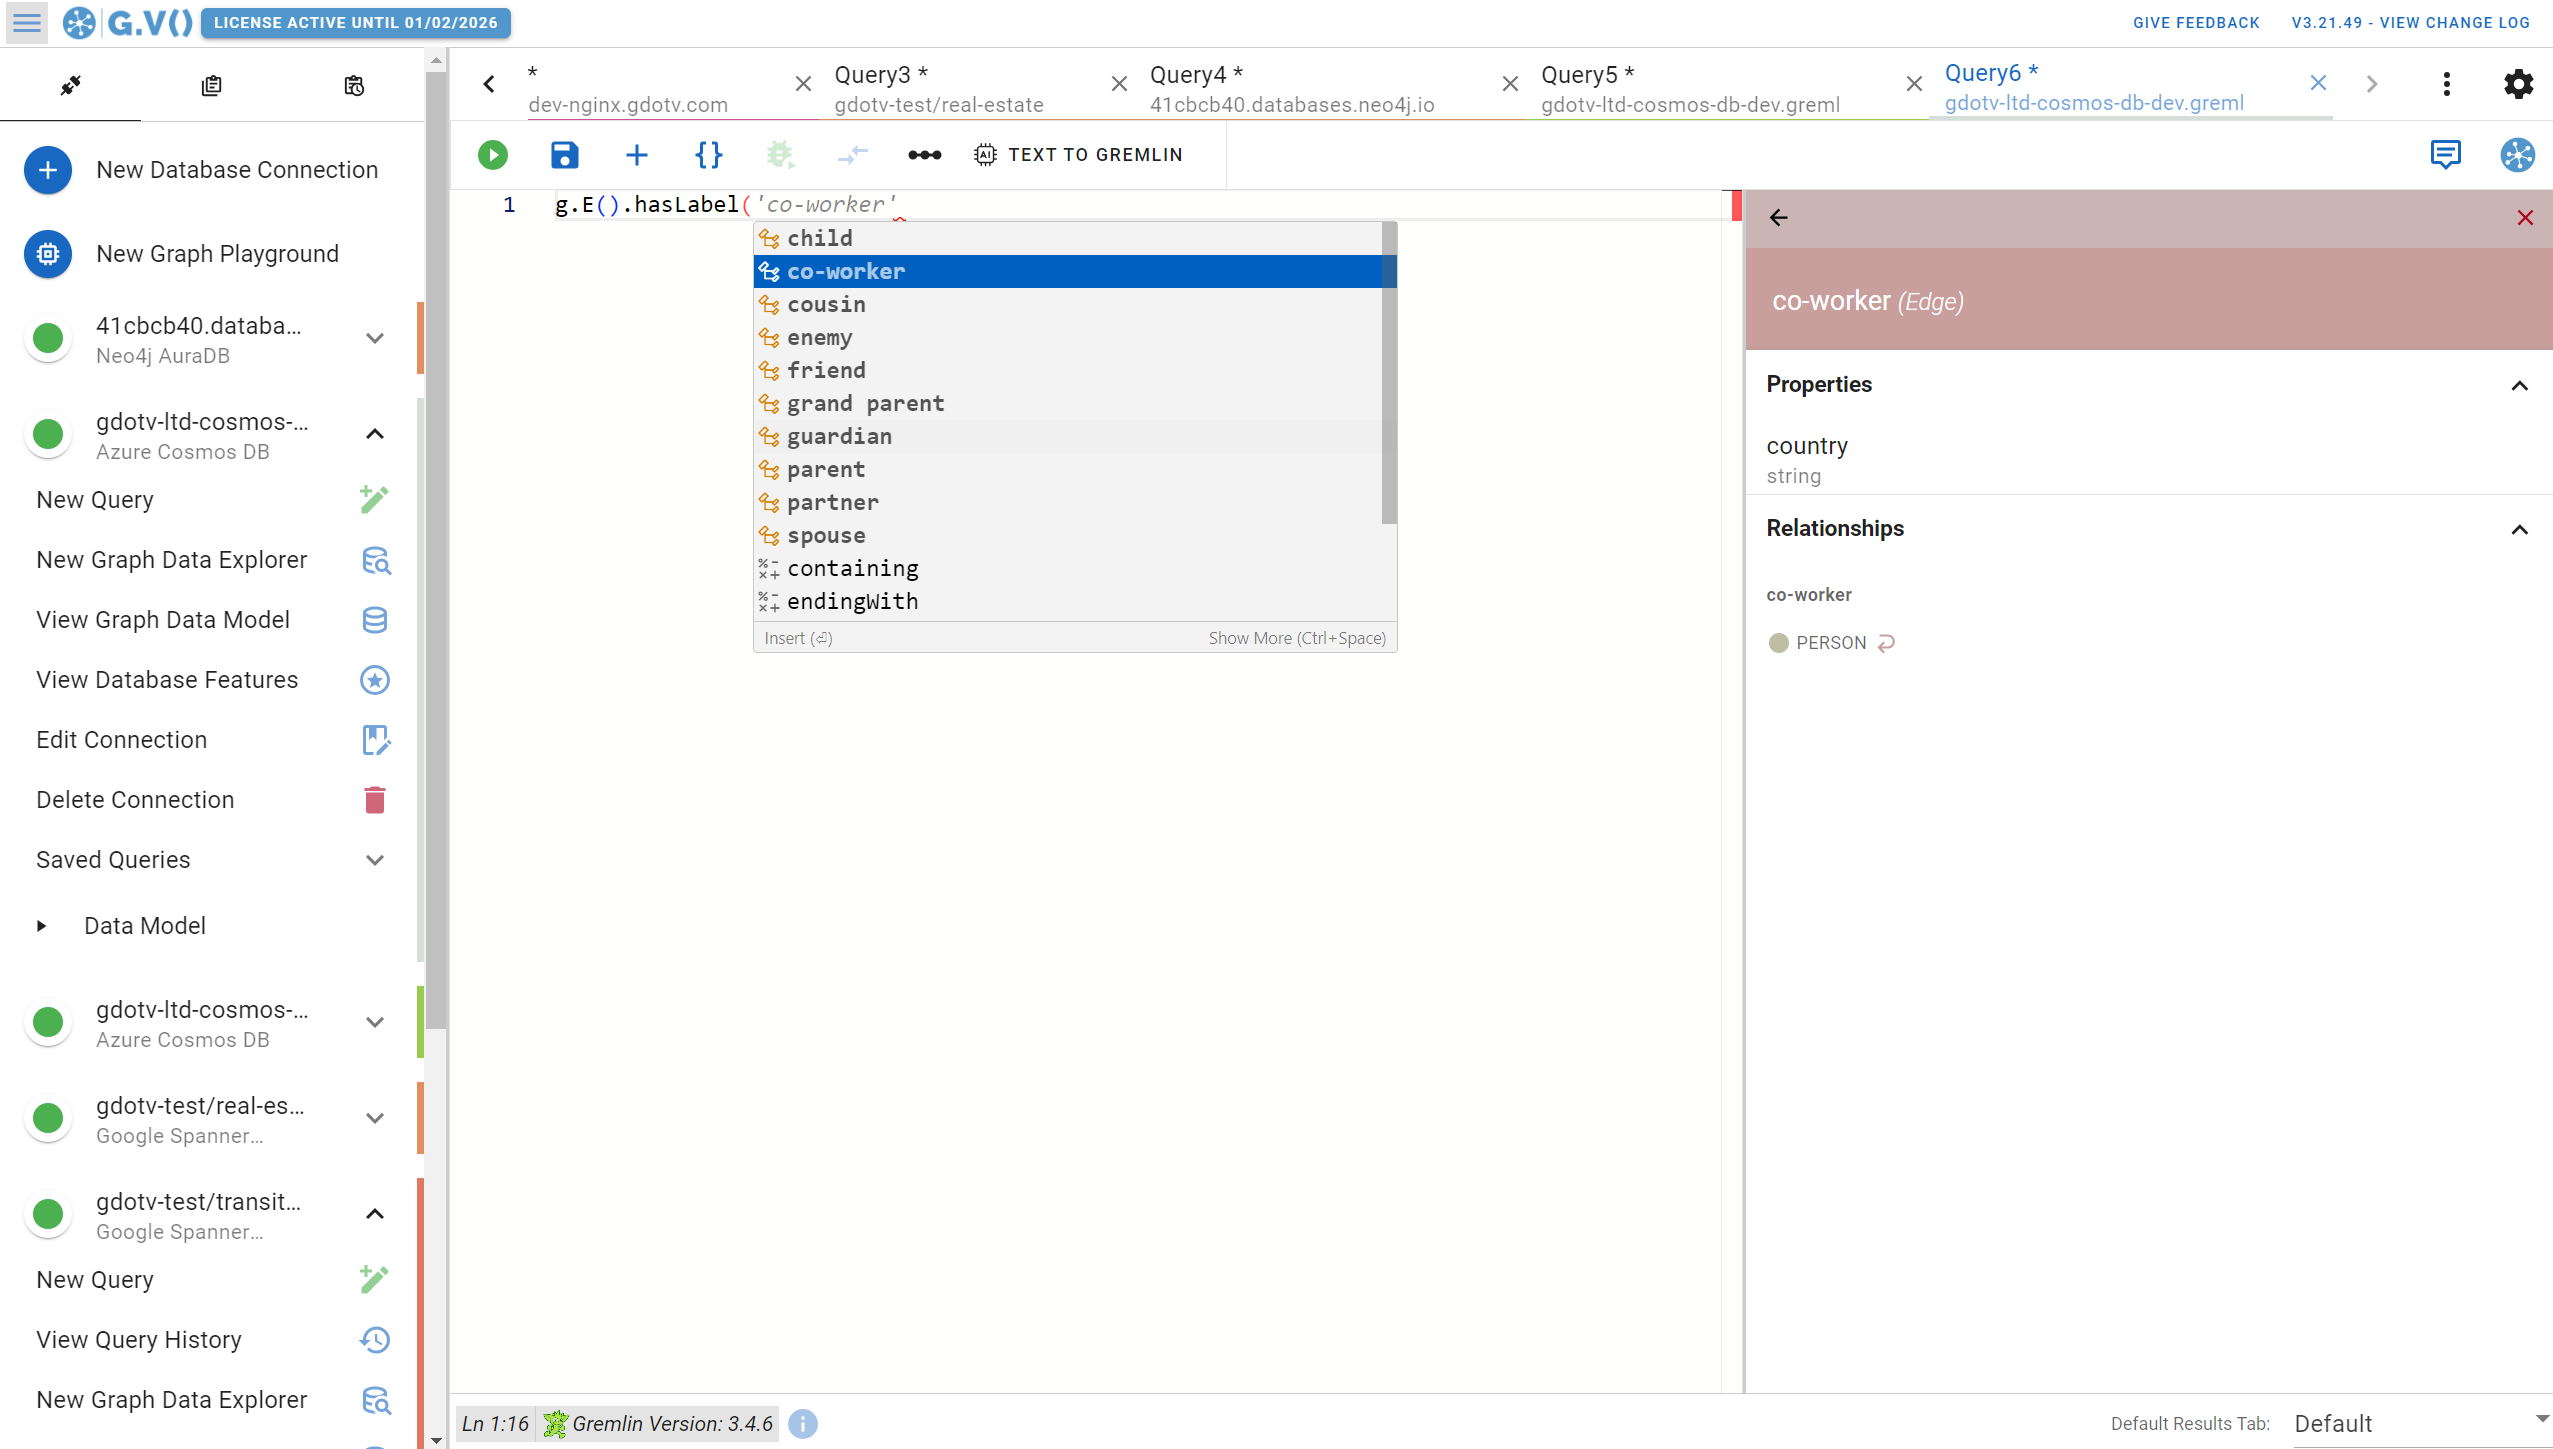
The G.V() query editor also includes syntax highlighting and correction. So if there’s something wrong with your Gremlin query, you’ll be notified that it’s invalid (and in most cases, why). This makes it easier on you as a developer because the query editor is there to help and support your work.
Let’s run an example Gremlin query and explore the resulting graph.
G.V() Graph Visualization & Data Outputs
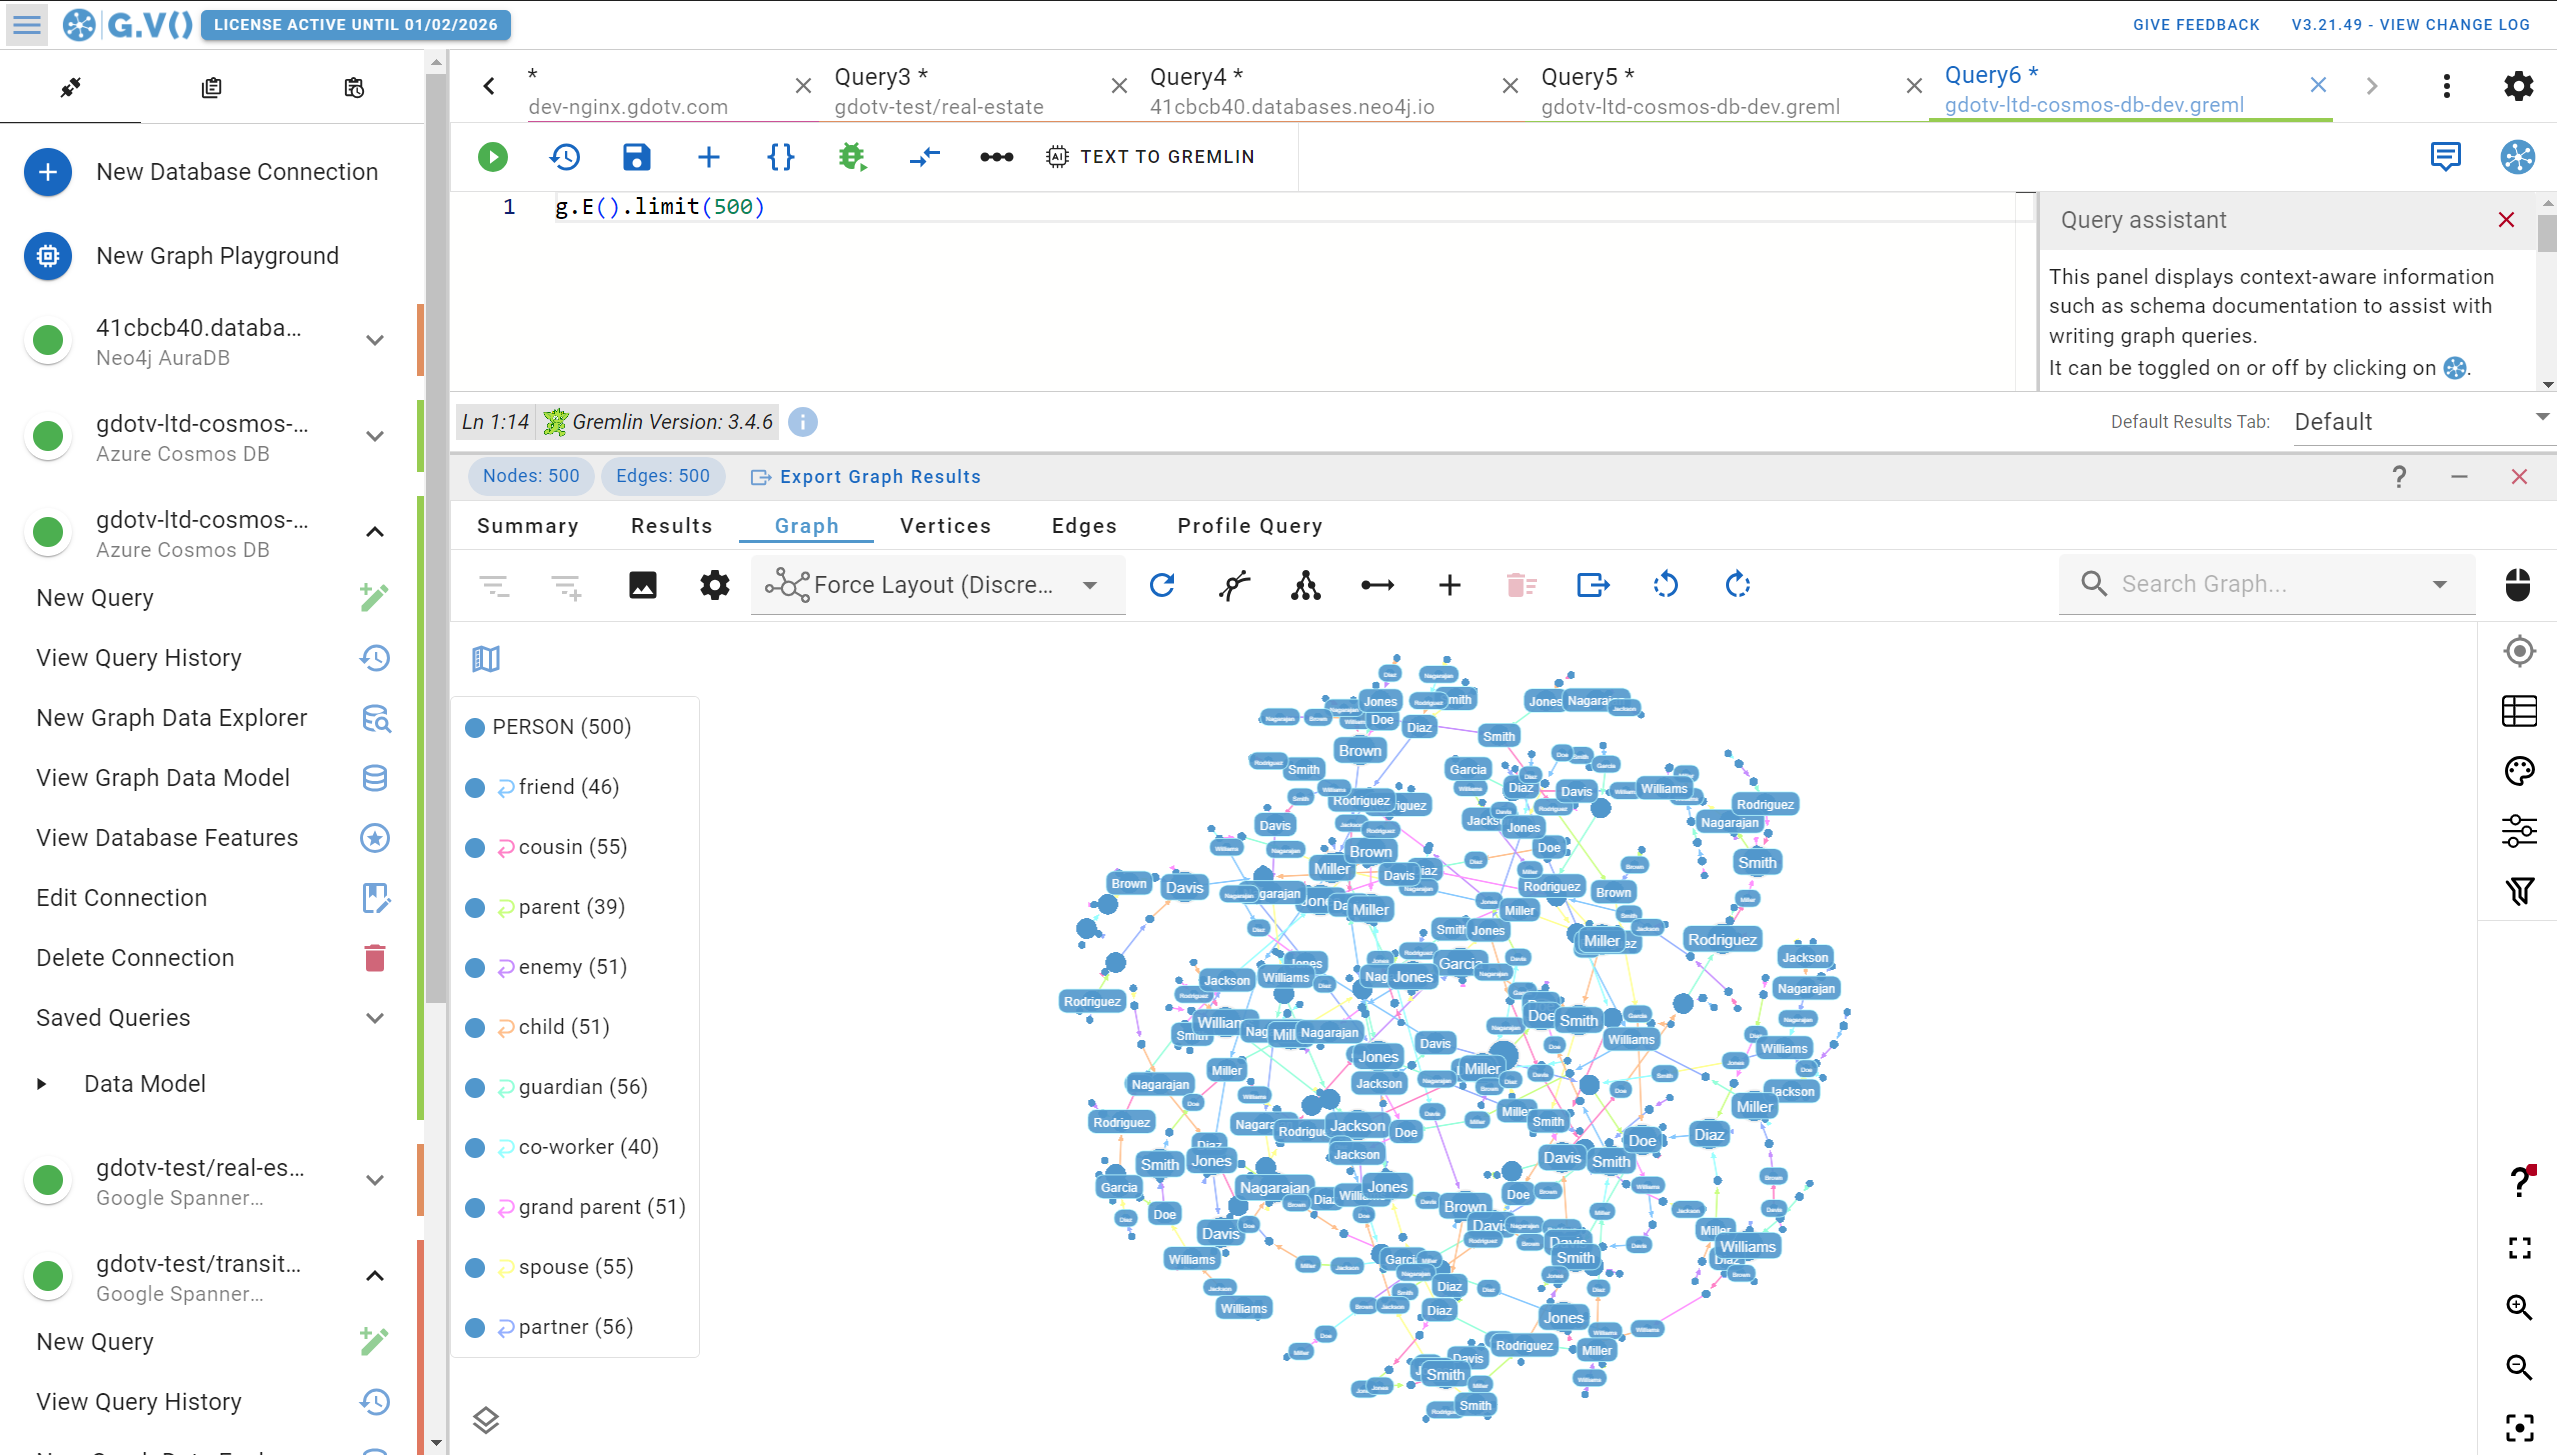
Generally speaking, there’s a lot more to see and do using the G.V() graph view than in Azure Cosmos DB Data Explorer.
To start, there’s a whole host of graph visualization features available in G.V() that you just won’t find in Data Explorer. You have more options for how you want your graph data to be displayed including forced layouts, sizing, and styling your graph visualizations with colors, fonts, and backgrounds. By default, G.V() will generate a nice stylesheet for your graph meaning it takes little to no configuration to get to a graph visualization like this:
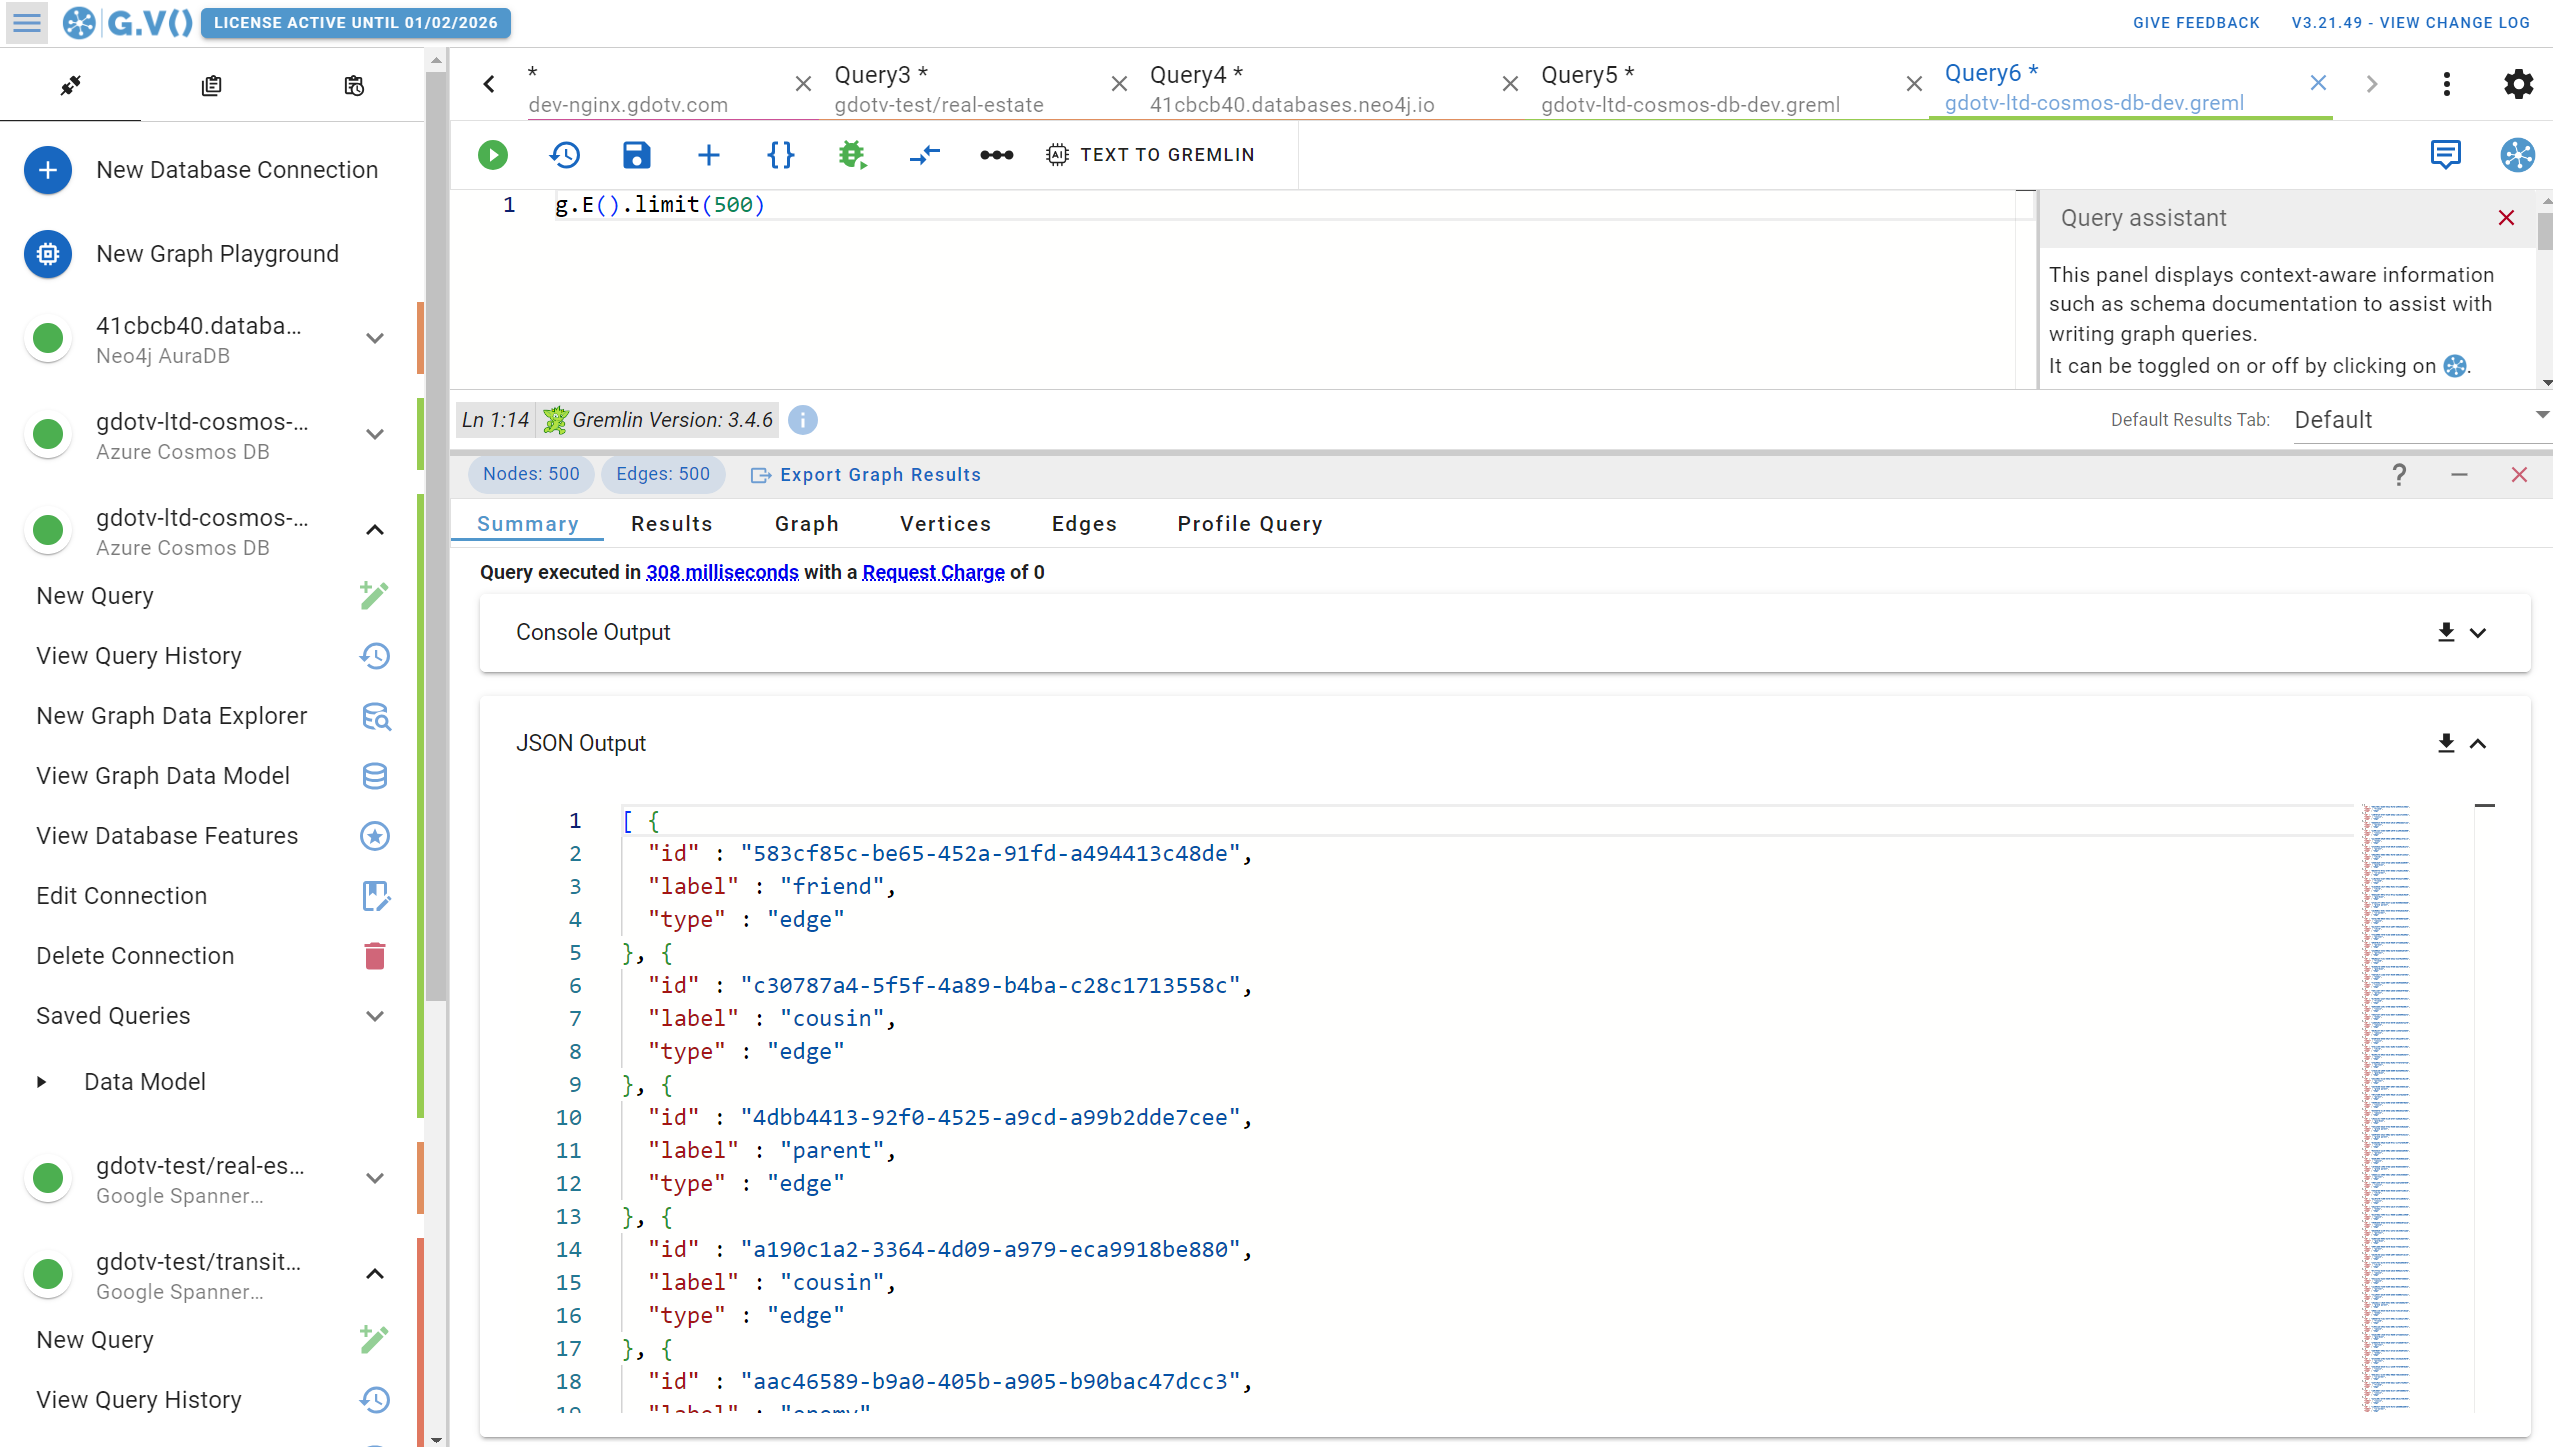
When it comes to other data outputs, you’ve got access to the same type of results summary as you see in Azure Cosmos DB. For instance, if we run our same example query from earlier, we’ll get the exact same JSON formatted output as you get on Data Explorer.
Likewise, you can view your results in a tabular format (shown below) with the option to sort and filter by vertices, labels, and more.

G.V() can also profile your Gremlin queries to show you how it ran, where it encountered errors, and how you can optimize the query in the future. This is a whole topic of its own which we’ll not delve too deep into here, but note that we have lots of advanced debugging, testing and profiling tools available.

View Your Graph Data Model in G.V()
Another important feature of G.V() is the ability to view the structure of your data in the graph database.
A lot of graph databases – including Azure Cosmos DB – don’t restrict what data you load into them. As a result, it quickly becomes difficult to keep accurate track of your database schema.
G.V() gives you an easy way to see your graph data model visually so that you know what’s in your database. Take a look at the example below.

Not only can you see the vertices and edges in your graph database but also the properties assigned to each, all in a concisely packed entity-relationship diagram.
Customize the Appearance & Style of Your Graph Data Visualizations
In addition, G.V() gives you the ability to style and edit the appearance of your graph data directly in the graph visualization. No design or CSS skills required.

You aren’t restricted to just one set of graph styles either: You can create multiple style sheets for different purposes, include images in your visualization, etc.
Edit Your Graph Data Interactively
G.V() isn’t just for exploring or visualizing your graph database – it’s also a powerful and convenient way to directly edit and update your data manually. In G.V(), you can add, edit, and delete all of the properties, vertices, and edges in your graph database.
For example, if you need to create a new edge relationship between two vertices, it’s just a matter of clicking and dragging the new connection into place and then the edge is saved in your database and updated on your graph data model.

And the best part is: G.V() updates all of your edits in real time back to your graph database, so your data is always kept consistent.
No-code Graph Exploration
The final feature we’ll look at for this comparison between G.V() and Azure Cosmos DB is the ability to search the elements of your graph using simple, no-code filters.

Using the Data Explorer in G.V(), you can filter your search based on vertex types, edge types, properties, and labels, refining your results to be broader or narrower based on what you’re looking for. G.V() then provides the resulting graph visualization of your search results.
Conclusion
There you have it: a side-by-side comparison between Azure Cosmos DB Data Explorer and G.V(). There are trade-offs to using each, but might I also add there’s also a clear winner for day-to-day graph visualization and database querying tasks.
If you’re serious about using the Gremlin API on Azure Cosmos DB you will very quickly run into limitations with Data Explorer. G.V() gives you all the tooling you actually need to perform complex operations against your graph database whether it be writing difficult Gremlin queries, profiling your queries, visualizing data, or just exploring and interacting with your graph data. I’ll let those capabilities speak for themselves.
![Announcing SPARQL Query Guardrails, Dashboarding, Query Editor Upgrades, & More [v3.53.111 Release Notes]](https://gdotv.com/wp-content/uploads/2026/03/rdf-sparql-query-guardrails-interactive-graph-dashboarding-gdotv-release.jpg "Announcing SPARQL Query Guardrails, Dashboarding, Query Editor Upgrades, & More [v3.53.111 Release Notes]")
![Cypher SET: Updating Node Properties in Your Graph Database [Byte-Sized Cypher Series]](https://gdotv.com/wp-content/uploads/2026/03/set-clause-byte-sized-cypher-query-langauge-video-series.jpg "Cypher SET: Updating Node Properties in Your Graph Database [Byte-Sized Cypher Series]")
")