Nine new dashboard charts and PuppyGraph 1.x [v3.92.152 Release Notes]

The November release of gdotv is here, which makes it faster and lighter, and keeps our database support up to date. There are new things to try as well, starting with nine new dashboard panel types and reports that open on the result tabs you choose.
The latest version of gdotv also includes:
- Support for PuppyGraph 1.x
- An upgrade to LadybugDB 0.22.1
- Faster startup and lower memory use
Nine new dashboard chart types
Nine new popular chart types have been added to Dashboards: Boxplot, Chord, Funnel, Heatmap, Radar, Scatter, Sunburst, Tree and Treemap.
-
A boxplot shows how a measure spreads within each group, such as node degree per label, so hubs stand out where an average would hide them.
-
A chord diagram shows how strongly groups connect in both directions, such as the relationships between each pair of labels.
-
Tree, Treemap and Sunburst draw hierarchies, and Tree reads the parent and child rows returned by a traversal.
-
A heatmap gives one number for every pair of categories, such as how many relationships of each type start from each label.
-
Scatter plots each row against two measures, such as node degree against PageRank, and can size and color the points by a third.
-
Radar compares a few items across several measures at once, and Funnel shows how a count narrows from one stage to the next.
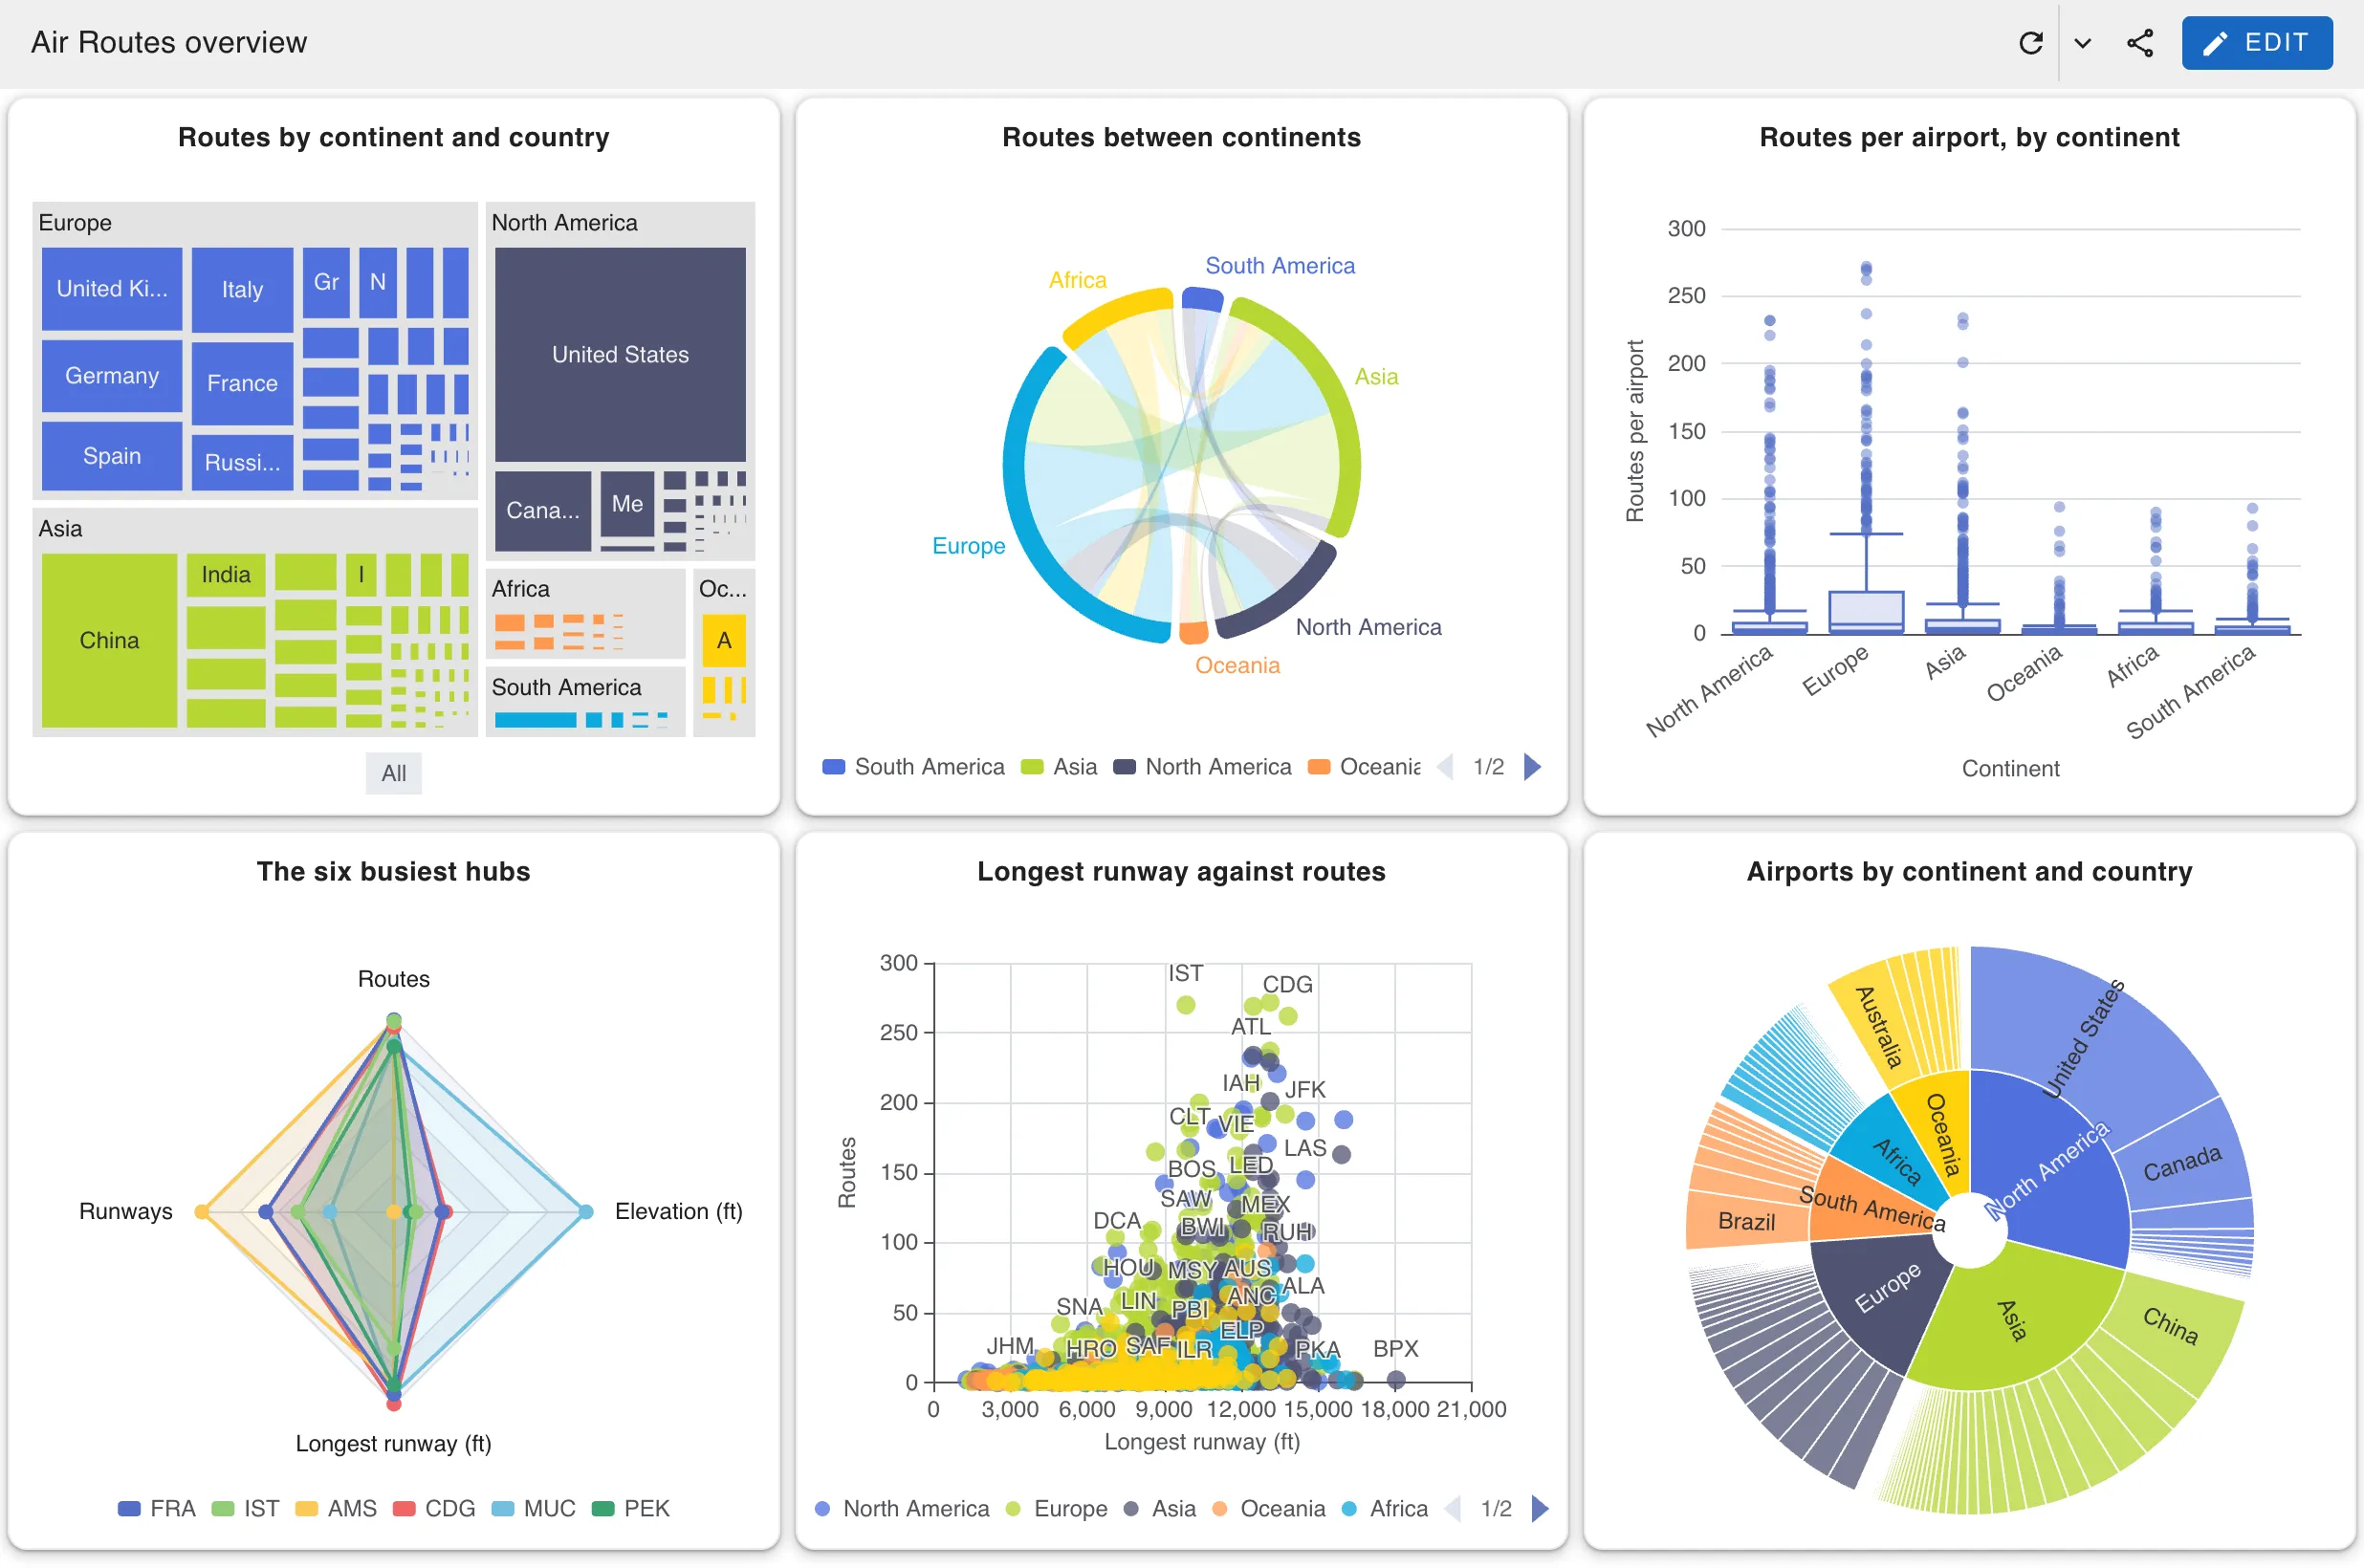
The dashboard documentation describes the results each panel expects. When a result doesn’t fit, the panel now shows a detailed warning instead of rendering nothing.
Choose the result tabs a report shows
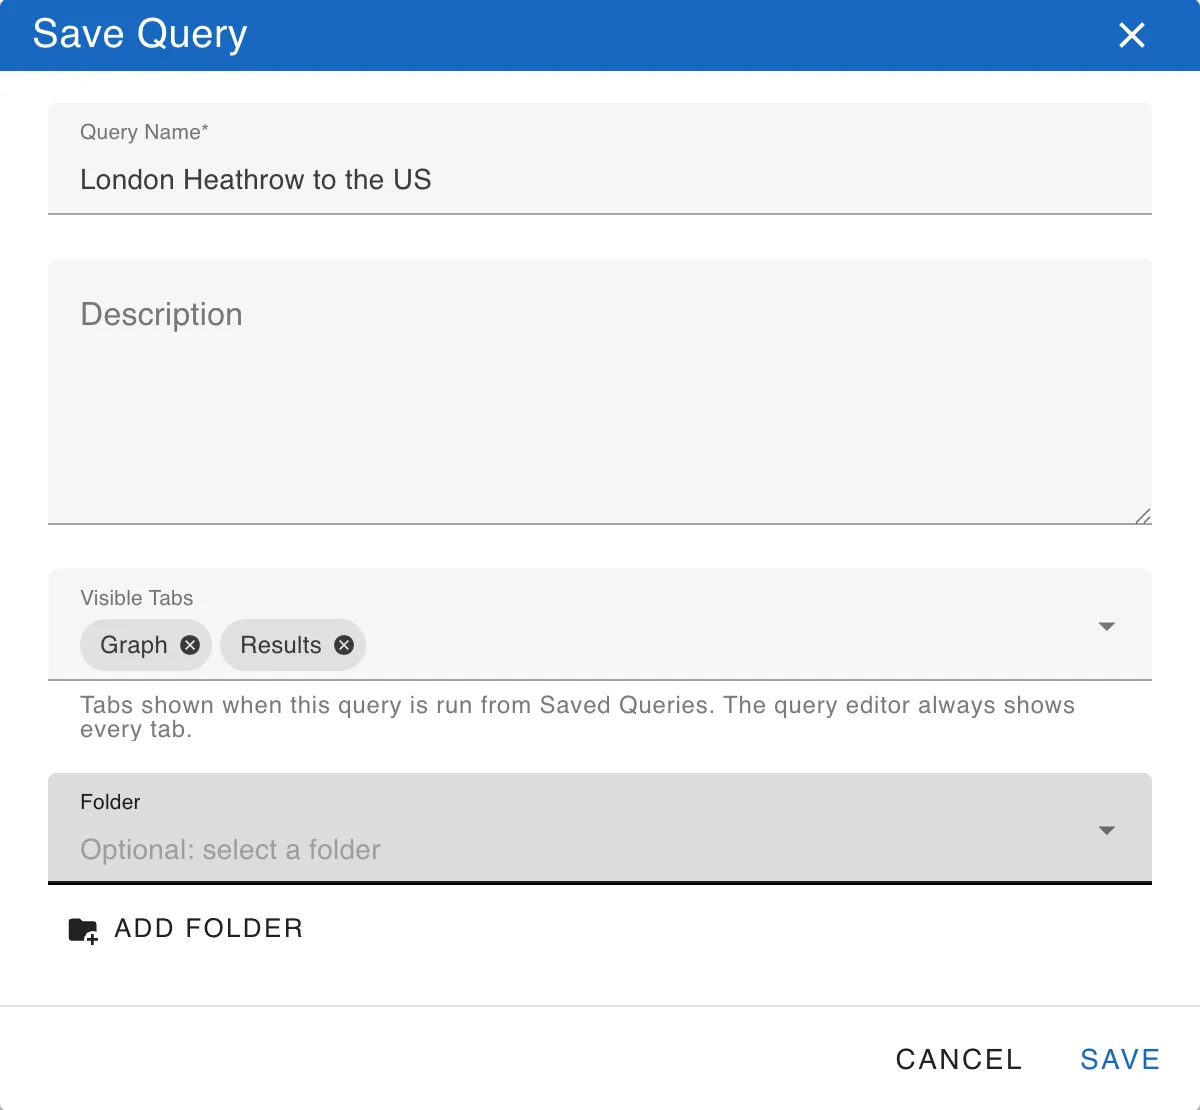
In gdotv Team and Enterprise, you can now choose which result tabs a saved query shows when it runs as a report, so other users on your team see the view that answers their question rather than every tab. To change the tabs, select Edit Details from the saved query’s options. New saved queries show Graph if the query returned nodes, and Results otherwise. The regular query editor still shows them all.
PuppyGraph 1.x
gdotv now supports PuppyGraph 1.x, which changed the format of the PuppyGraph schema, and no longer supports 0.x.
When your schema declares no id for an edge type, PuppyGraph gives those edges a new id on every query. gdotv now identifies them by their two vertices and label, so they no longer appear twice when you expand the graph. gdotv can’t show their properties though, so you’ll need to declare an id for the edge type to see them.
LadybugDB 0.22.1
gdotv now uses LadybugDB 0.22.1. Files from LadybugDB 0.15.0 and later open directly, and LadybugDB upgrades them in place. The upgrade is one-way, so if older tools still use a file, back it up first or connect in read-only mode. Files from 0.14.x and earlier still need an export and reimport.
General improvements
- gdotv starts faster, responds more quickly and uses less memory, and closed query tabs now release their memory.
- Graph analytics and the schema view layout run in the background, so gdotv no longer freezes while they work.
- gdotv learns the graph schema and default styles from every query, including those from dashboards, reports and MCP clients.
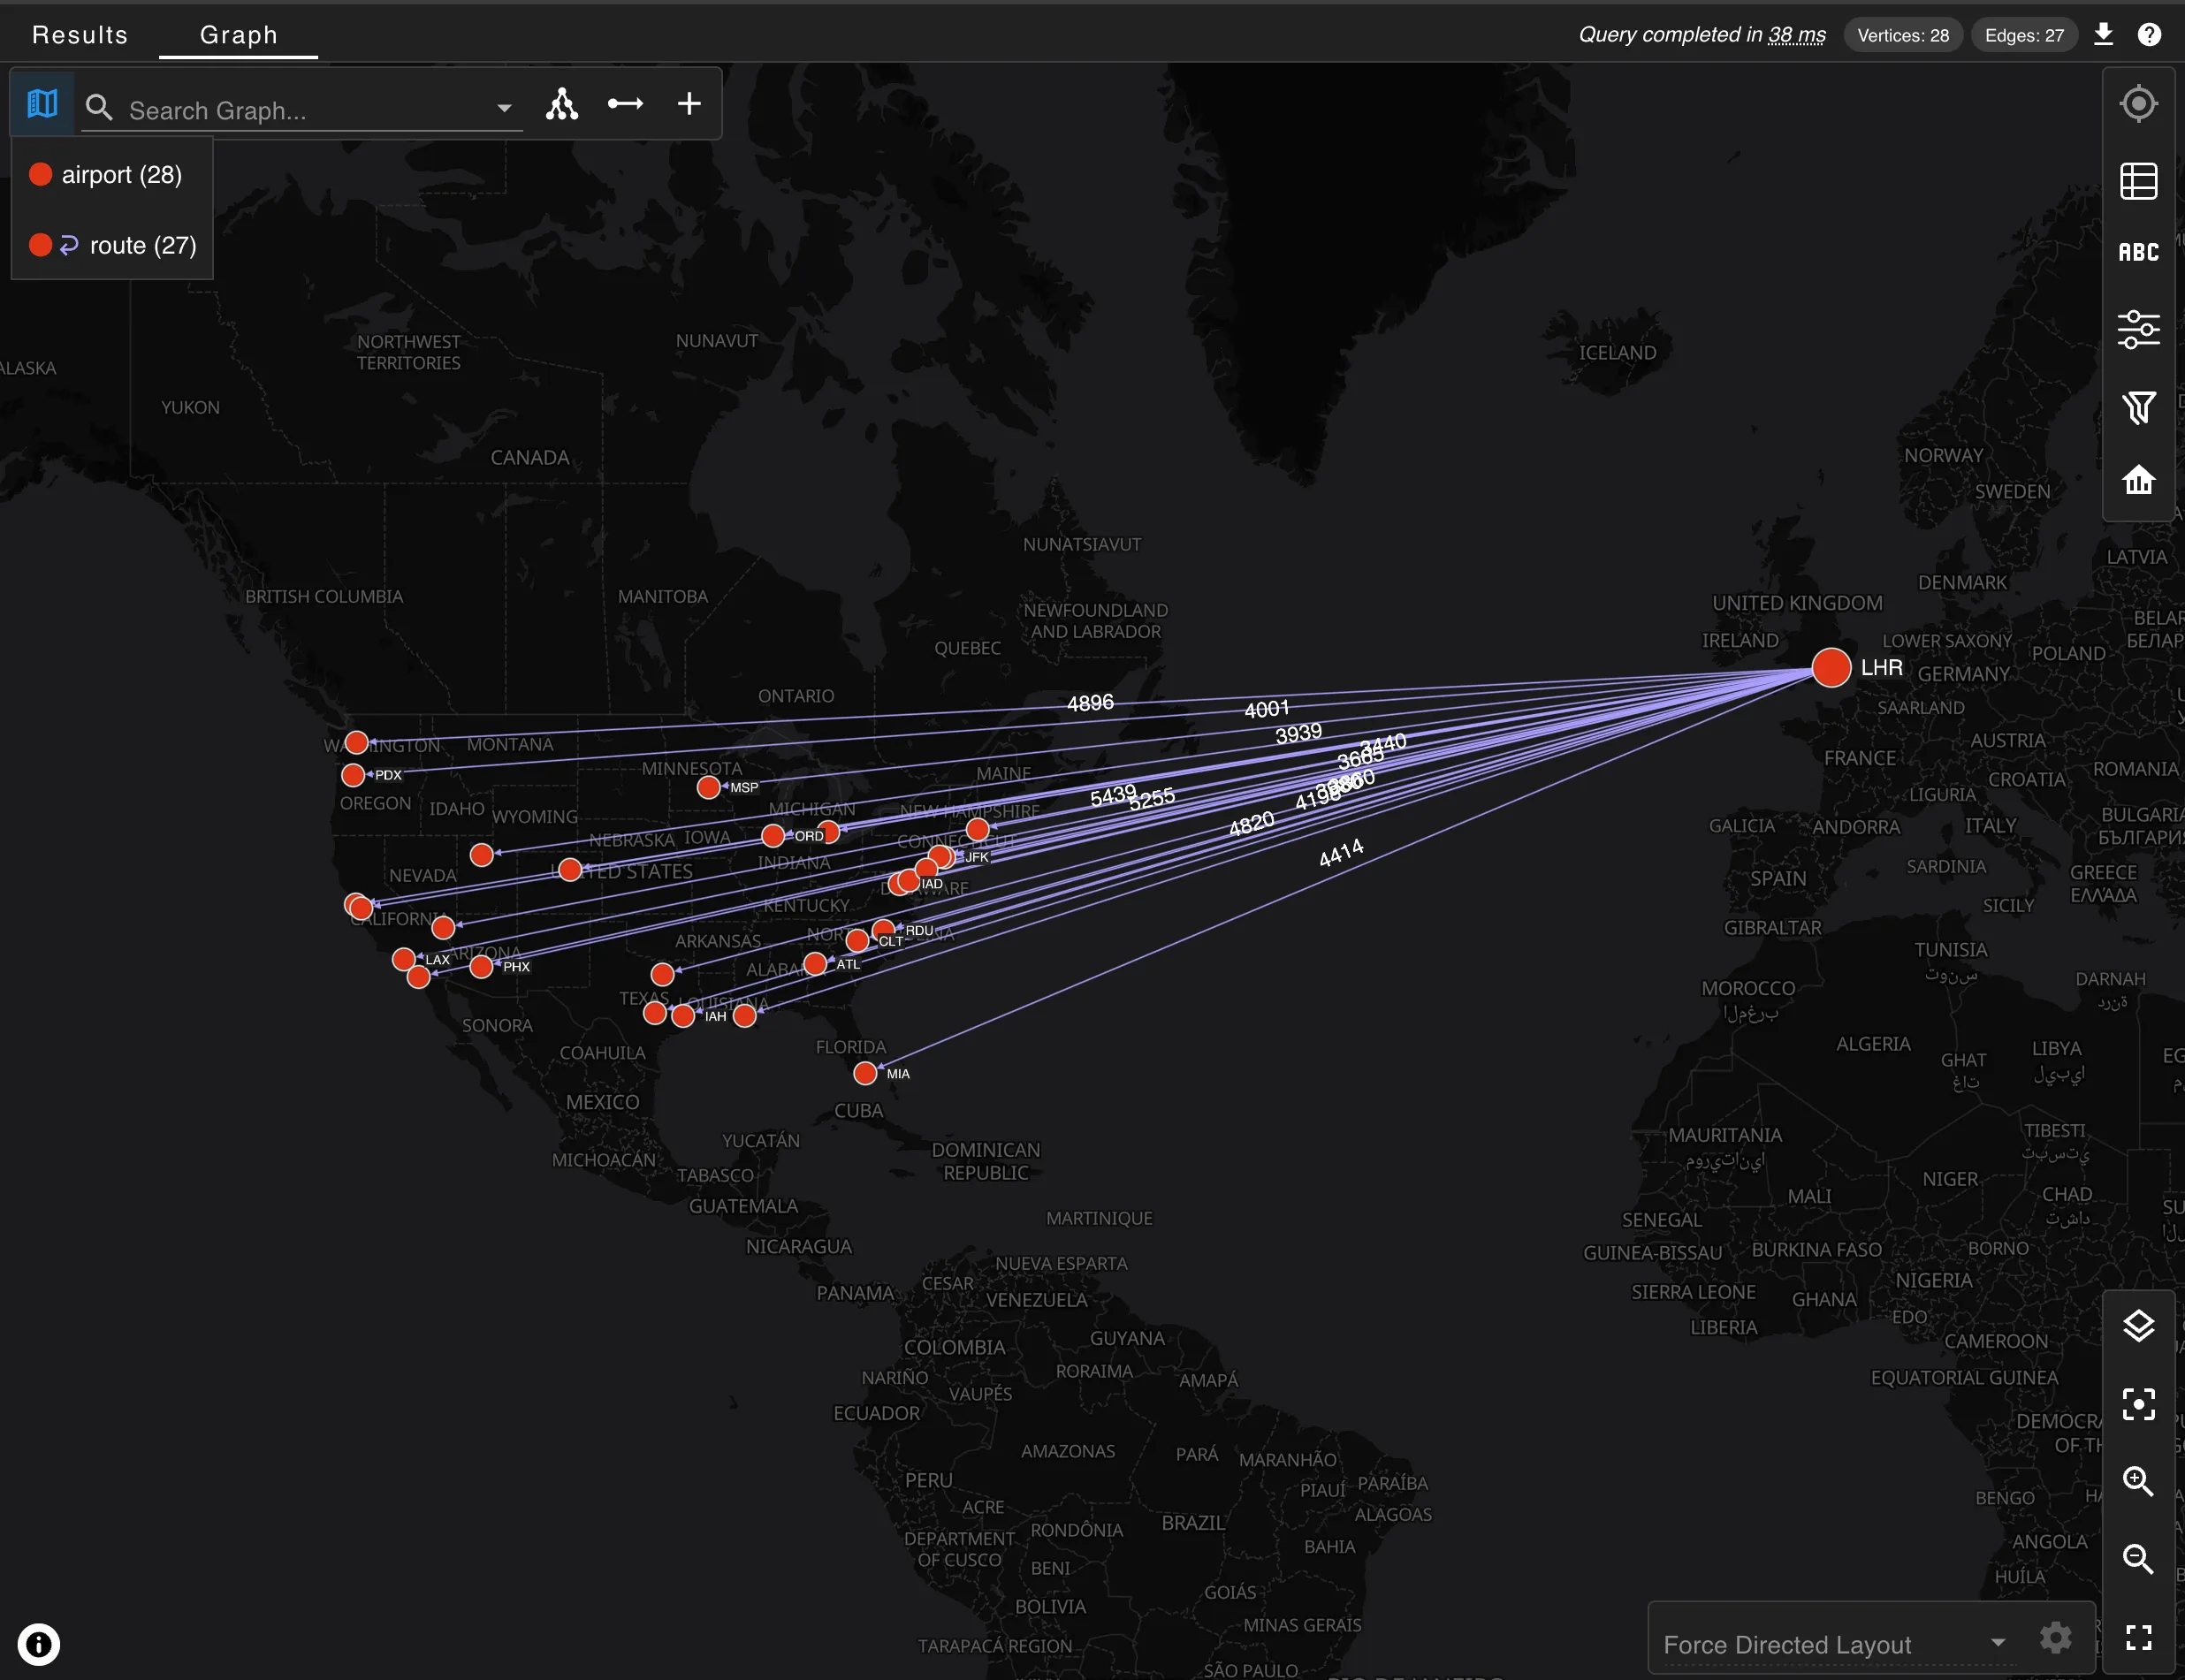
- The graph view’s map layer now uses OpenFreeMap basemaps.
- Read-only users can run procedures that the database declares read-only in Neo4j, Memgraph, FalkorDB and Amazon Neptune.
- gdotv Enterprise can run in cluster mode, with several replicas behind a load balancer.
Conclusion
gdotv should now feel quicker, and your dashboards have more ways to analyze your graph. Update to the latest version of gdotv to try the new panels, and let us know if there’s anything you’d like us to add next.
About the author

Joe Stainke
Developer
Hey! I'm Joe Stainke, one of the gdotv development team members! As a newcomer to the graph database industry, I bring fresh perspectives on how we can improve adoption of graph technology for the masses.