gdotv MCP server and graph data science [v3.88.151 Release Notes]

October is here, and so is another release of gdotv. This is one of our biggest yet, packed with goodies.
The first major addition is the gdotv MCP server. With the MCP server, you can connect gdotv to your preferred MCP client, such as Claude Code, Cursor or ChatGPT. This means you can operate most gdotv functions with plain-language prompts. This includes ordinary querying functionality, as well as gdotv’s report and dashboard features. This release also adds a Graph Data Science panel to the graph visualization, which runs various community detection and centrality algorithms on the graph you have on screen. Finally, we have reworked dashboards: adding a new layout grid, private drafts and more capable parameters.
The latest version of gdotv also includes:
- A preview of the Data Explorer’s generated query
- Upgraded compatibility with LadybugDB 0.21.2
- Better performance, especially when you have many tabs open
- An adjustment to SPARQL query guardrail highlighting
Let’s take a look at each of these in turn.
The gdotv MCP server
MCP (Model Context Protocol) is an open standard for connecting applications built from large language models (LLMs) to external tools and data. Applications with MCP support, such as Claude Code, Cursor and ChatGPT, are called MCP clients. An MCP server is a program with tools for those clients to use. Once a client is connected to a server, the client can call the server’s tools to retrieve information and run operations.
gdotv now includes its own MCP server. When you connect an MCP client to gdotv, the client can query every database connected to gdotv, using your connections, credentials and permissions. As a result, you can type a question about your data in natural language, the LLM generates a query from the question, and the client runs the query through gdotv.
What your MCP client can do through gdotv
The gdotv MCP server offers 32 tools. Together, these tools let an MCP client:
- List your connections and read the schema
- Generate queries using the schema
- Validate a query and retrieve the database’s query plan before running the query
- Run queries and return a summary of the result
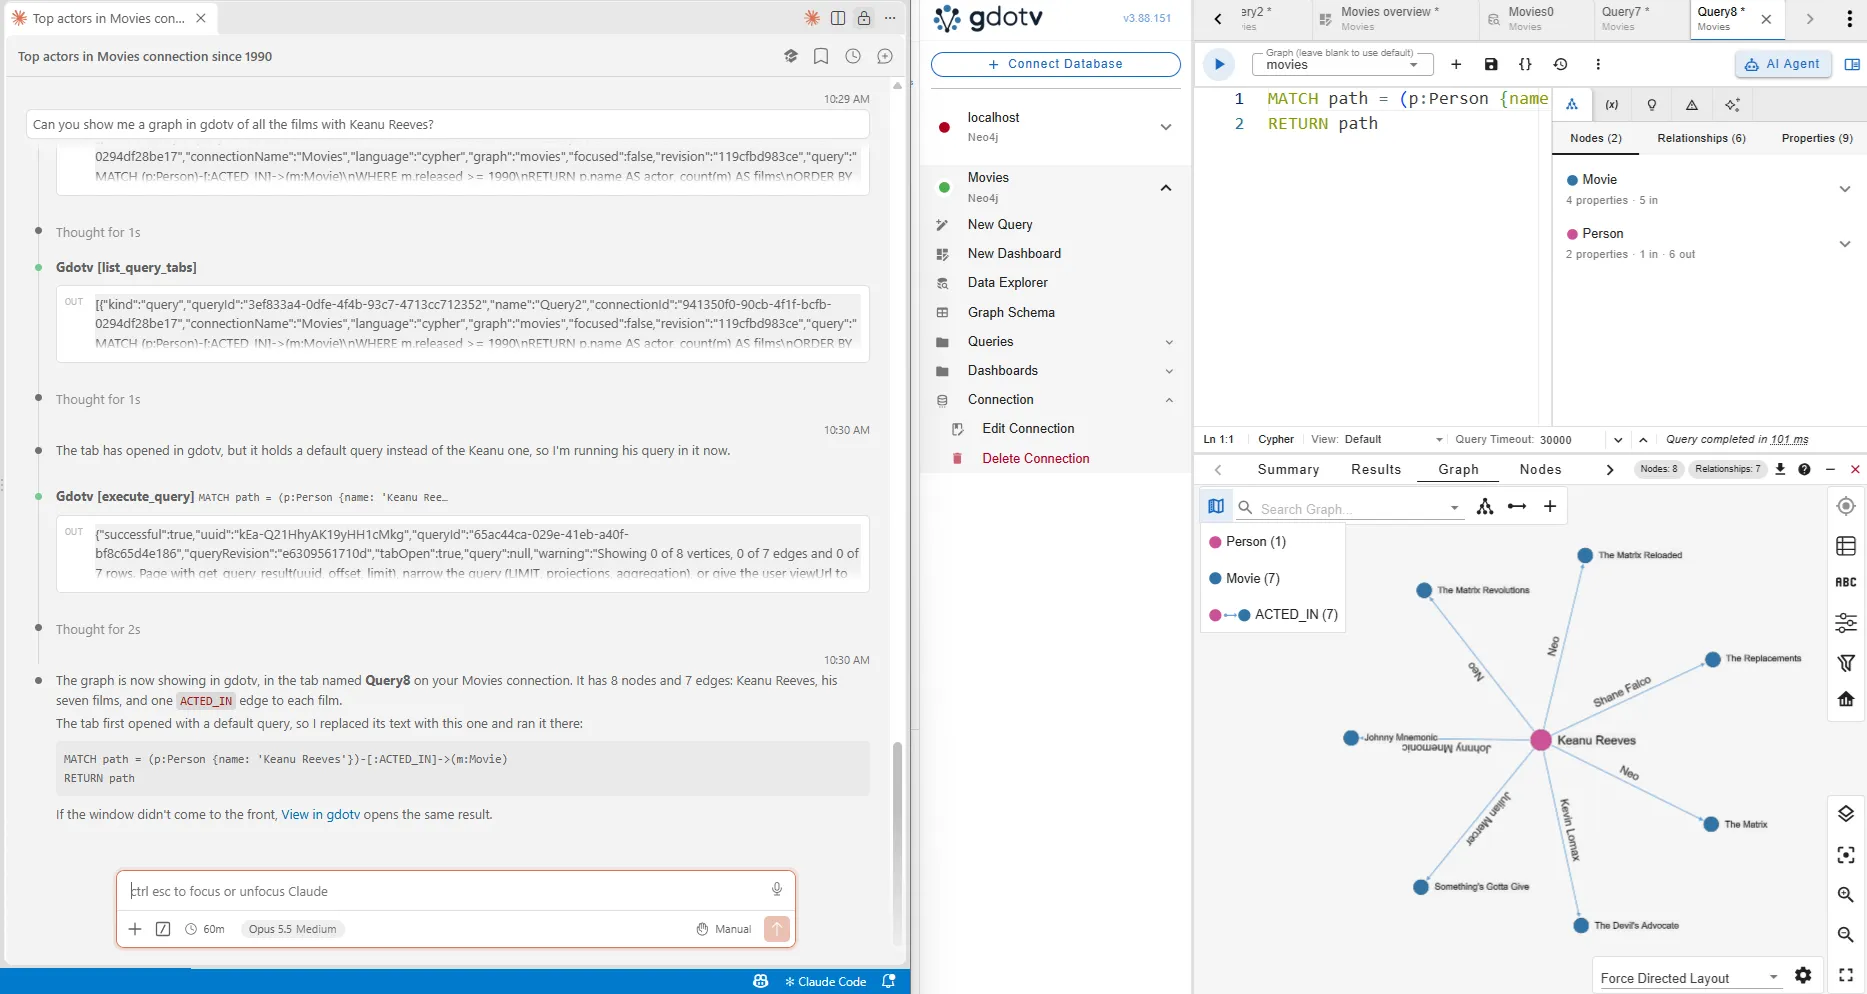
- Provide a View in gdotv link to the complete result in gdotv
- Edit and run the query in your open query tab in gdotv
- Create and edit reports and dashboards
- Add new database connections
So, for example, you could type a request into your MCP client, such as “In my Movies connection, which 10 actors appear in the most films released since 1990? Show a table.” The client retrieves the schema of the Movies connection from gdotv, the LLM generates a Cypher query from the schema and your request, and the client validates and runs the query through gdotv. The client then displays a summary of the result with a link to the full result in gdotv.
Reports and dashboards, created as drafts
You can also create a report or dashboard from your MCP client. In gdotv, a report is a saved query with parameters: people run the report by filling in values such as a date range or a name, without writing a query themselves.
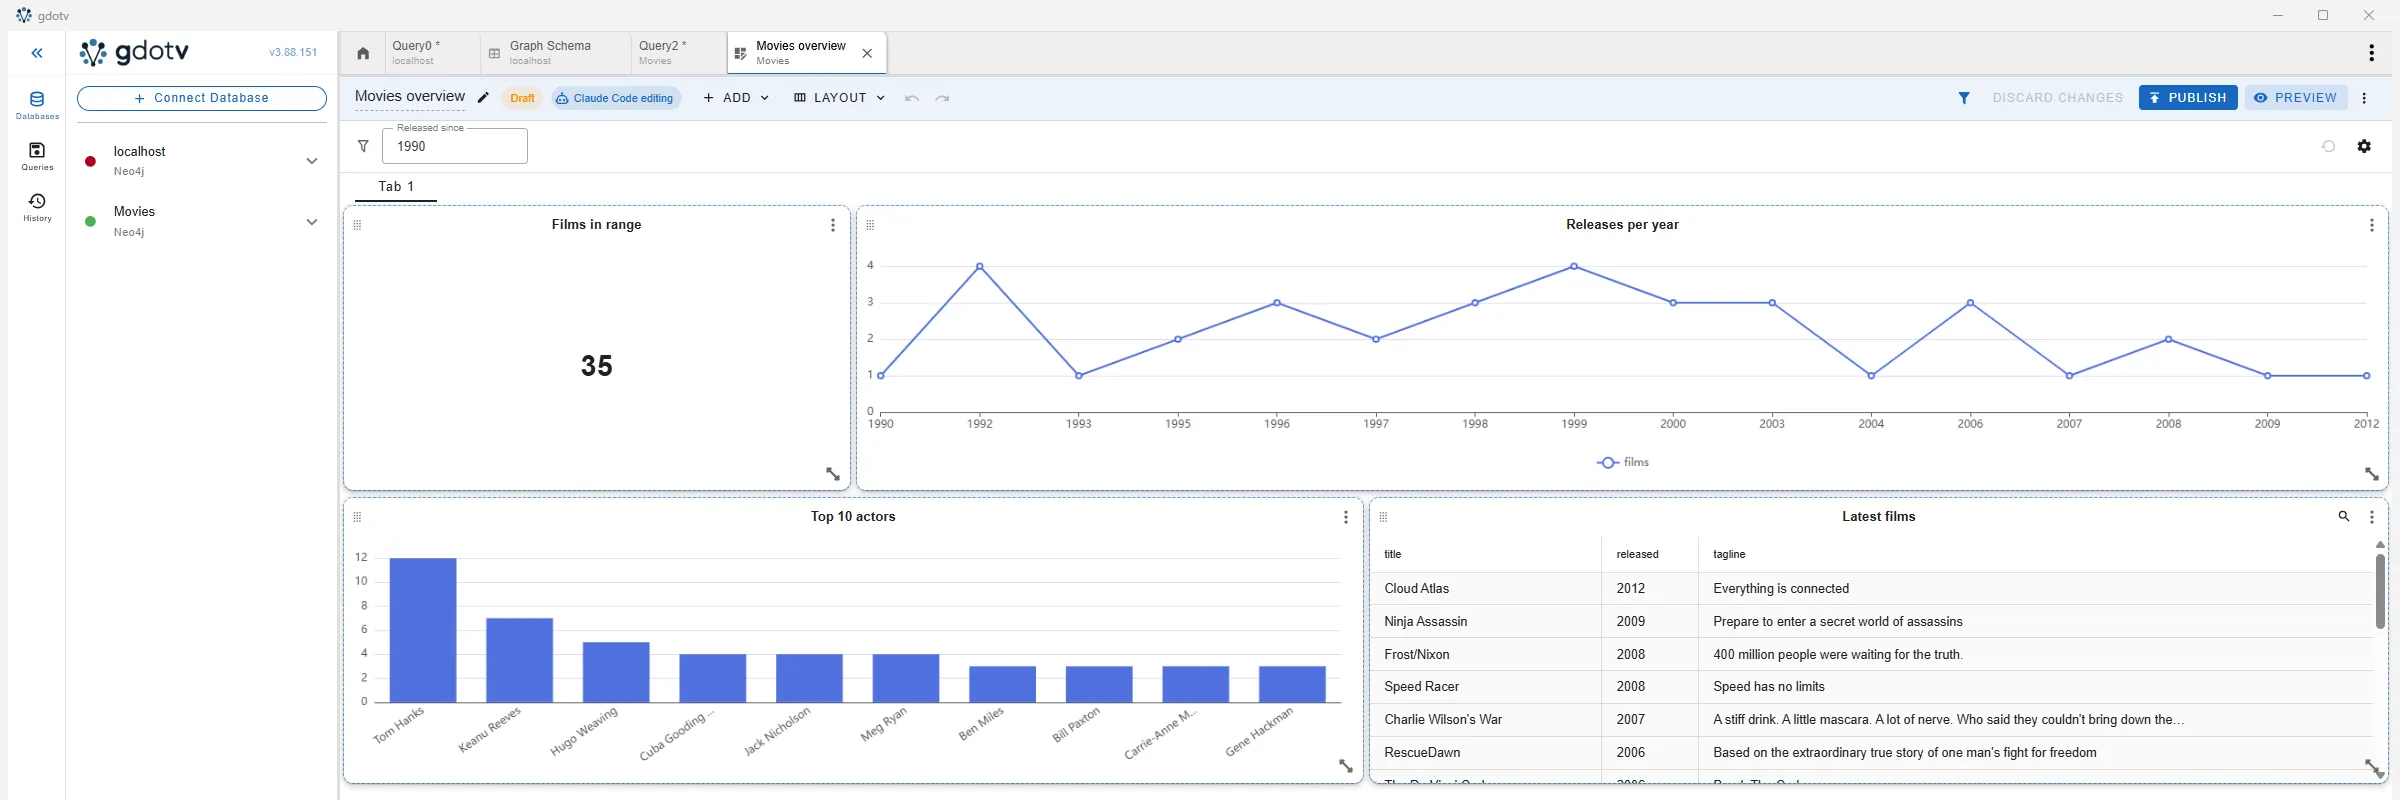
When you create a report via MCP client, you could, for example, type: “Create a dashboard for the Movies connection: releases per year as a line chart, the top 10 actors as a bar chart, and a table of the latest films. Let me filter all dashboards by year.”
The MCP server saves reports and dashboards as private drafts, visible only to you. The client displays a link to the draft, which you can open in gdotv. When you are happy with the result, you can click Publish in gdotv, or publish via your MCP client. Publishing makes the report or dashboard available to every user of that connection, so that other members of your team can see it. If an MCP client changes an already published dashboard, the MCP server saves the changes in a draft, and the published version stays unchanged until you publish the draft.
MCP safety features
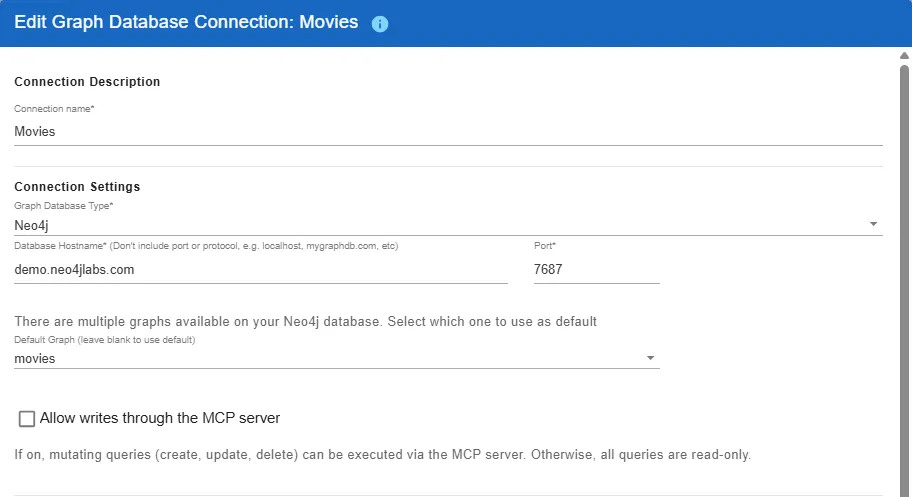
An MCP client connected to gdotv can only read data unless you decide otherwise. Every connection has a new setting, Allow writes through the MCP server, which is off by default. While this setting is off, gdotv parses each query from the MCP server before running the query. If gdotv cannot confirm that the query only reads data, gdotv rejects the query. This ensures a write operation can never run without your permission.
Other safeguards include:
- The MCP server does not delete published reports or dashboards. Published work can only be deleted in gdotv itself.
- Discarding a draft through the MCP server requires an explicit confirmation flag, and the server’s instructions to the LLM require your approval first.
We do still recommend that you keep your client’s tool confirmations switched on.
Connecting your MCP client
You can connect an MCP client from Settings › MCP Server, or from the new connection button on the Welcome tab. The way a client signs in depends on your edition of gdotv:
| gdotv edition | How the client signs in | Supported clients |
|---|---|---|
| gdotv Desktop | With an access token from Settings › MCP Server | Coding tools on the same machine, such as Claude Code, Cursor, VS Code, Codex and Windsurf |
| gdotv Team & Enterprise | With your gdotv account, through OAuth. The first time the client connects, the client opens your browser so that you can sign in. | Coding tools, plus claude.ai and ChatGPT if your gdotv server is reachable from the internet |
On gdotv Desktop, gdotv detects the supported clients installed on your machine and shows a Configure button for each client. One click on Configure adds the gdotv server to that client’s settings. On both editions, the settings page also provides manual instructions for each supported client, as well as a setup prompt for your coding tool. Pasting the setup prompt into the tool configures the connection.
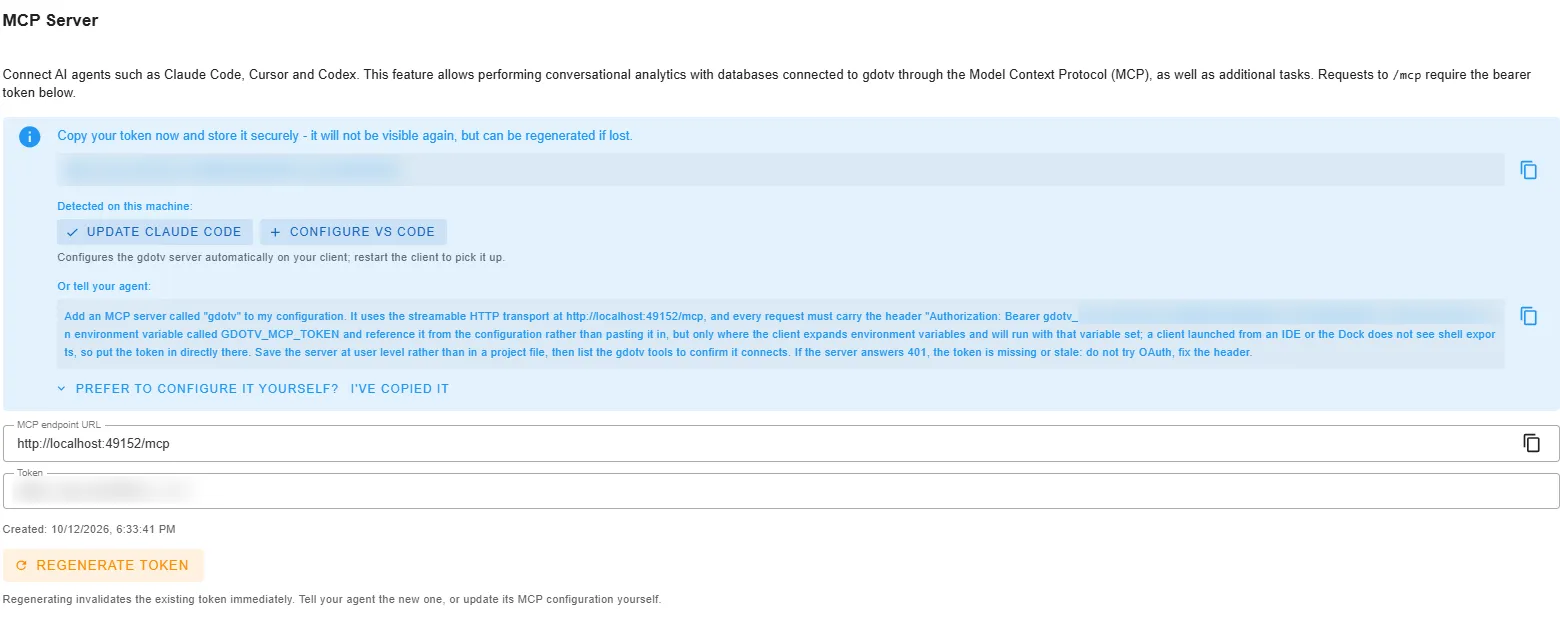
Most MCP tools require a gdotv license or a free trial. For the full list of tools and more example prompts, see the MCP server documentation and the MCP workflows guide.
Graph Data Science on the graph visualization
Graph algorithms calculate properties of a graph from the pattern of connections between its nodes. This release brings two common families of graph algorithm into gdotv: centrality and community detection.
- Centrality algorithms give each node an importance score, based on the node’s position in the graph. Each centrality algorithm defines importance differently.
- Community detection algorithms divide the nodes into groups, called communities. The nodes in each community have more connections to each other than to nodes outside the community.
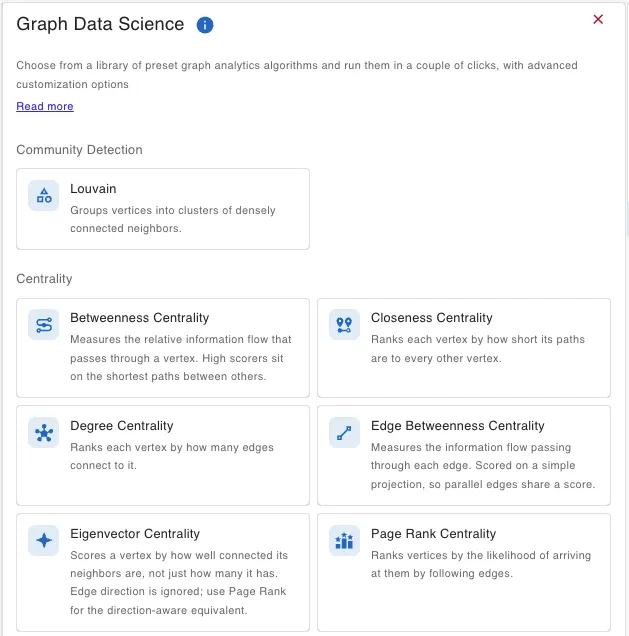
You can run these graph analytics algorithms from the new Graph Data Science panel. To open the panel, click the Graph Data Science icon in the sidebar of the graph visualization. Pick an algorithm from the list, adjust the configuration if you want to, and click Run algorithm.
The graph analytics algorithms
The panel offers one community detection algorithm and six centrality algorithms:
| Algorithm | What the score measures |
|---|---|
| Louvain (community detection) | Groups nodes into communities by maximizing modularity, a measure of how much denser the connections inside each group are than you would expect if the edges were placed at random. |
| Degree Centrality | The number of edges connected to a node. |
| Betweenness Centrality | How often a node lies on the shortest path between two other nodes. Nodes with high betweenness act as bridges between different parts of the graph. |
| Closeness Centrality | How close a node is to every other node, based on the average length of the shortest paths from that node. |
| Eigenvector Centrality | How well connected a node’s neighbors are. A node scores highly when it is connected to other high-scoring nodes. |
| Page Rank Centrality | A direction-aware variant of eigenvector centrality. Google originally developed PageRank to rank web pages by their incoming links. |
| Edge Betweenness Centrality | How often an edge lies on the shortest path between two nodes. This algorithm scores edges instead of nodes. |
Configuring an analysis
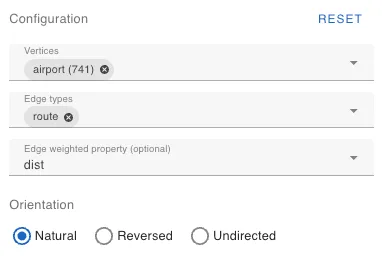
Each analysis has a Configuration section with the following settings:
- Vertices and Edge types limit the analysis to particular labels. By default, the analysis includes every label.
- Edge weighted property selects a numeric property to use as the weight of each edge. Betweenness centrality treats the weight as a distance, so a heavily weighted edge counts as a longer connection. PageRank and eigenvector centrality treat the weight as a strength, so a heavily weighted edge counts as a stronger connection. Closeness and degree centrality do not use weights.
- Orientation sets how the algorithm treats edge direction. Natural follows each edge in its stored direction, Reversed follows each edge in the opposite direction, and Undirected ignores direction.
The labels in the panel follow the terminology of your database, so a Cypher connection shows “nodes” and “relationships” rather than “vertices” and “edges”.
Viewing the results
gdotv shows the results of an analysis directly on the graph visualization. You can choose how to display each analysis from the Result display method setting:
- Centrality results can scale the size of each node or edge by its score, color each node or edge on a yellow-to-red gradient, or draw a heatmap behind the graph.
- Louvain results can color each community with a heatmap or with outlines, or rearrange the graph so that each community forms a separate cluster.
Each analysis also has a Results table. For centrality, the table ranks the nodes or edges by score. Scores are relative to the run’s highest score, 100, and you can hover over a score to see the raw value. For Louvain, the table lists each community with its size and its share of the graph, and you can expand a community to see its members. Hovering over a row in the table highlights the matching element on the graph.
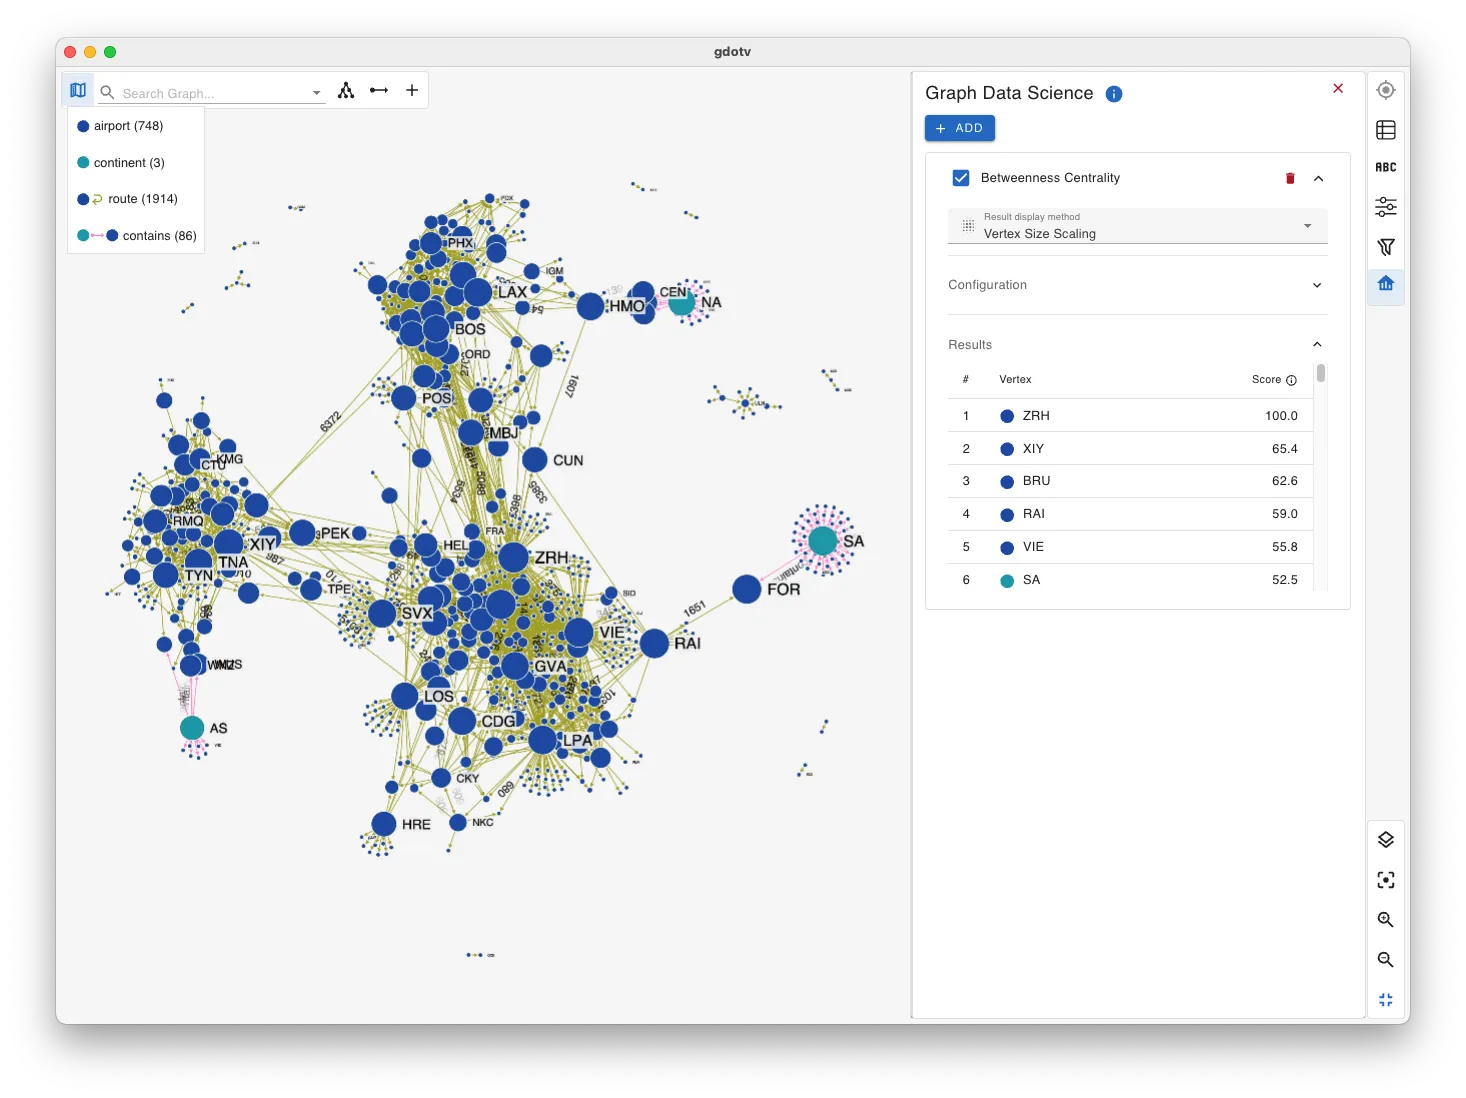
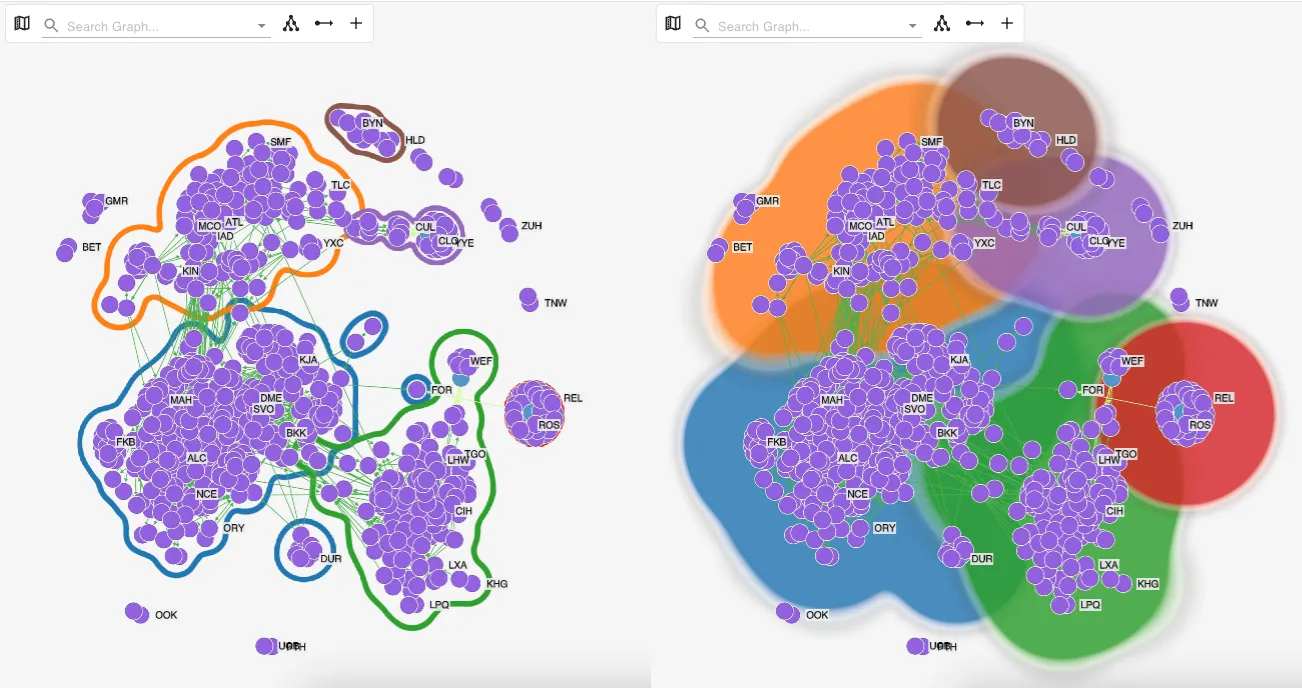
You can add several analyses to the panel and display their results at the same time, as long as each analysis uses a different display method. For example, you could size nodes by PageRank and color the same nodes by betweenness.
Note that the algorithms run inside gdotv, on the currently displayed graph, not on your entire database. gdotv does not write the results back to your database or into your stylesheet. If the graph changes after you run an analysis, for example because you expanded a node’s neighbors, gdotv marks the results as out of date and shows a refresh button so that you can run the analysis again. Results are not saved between sessions.
For more detail on each algorithm and display method, see the Graph Data Science documentation.
Dashboard improvements
We introduced dashboards back in March. A dashboard is a collection of panels. Each panel displays the result of one query as a chart, table, graph or other visualization. This release reworks how dashboards are laid out, saved and filtered.
A new look and layout
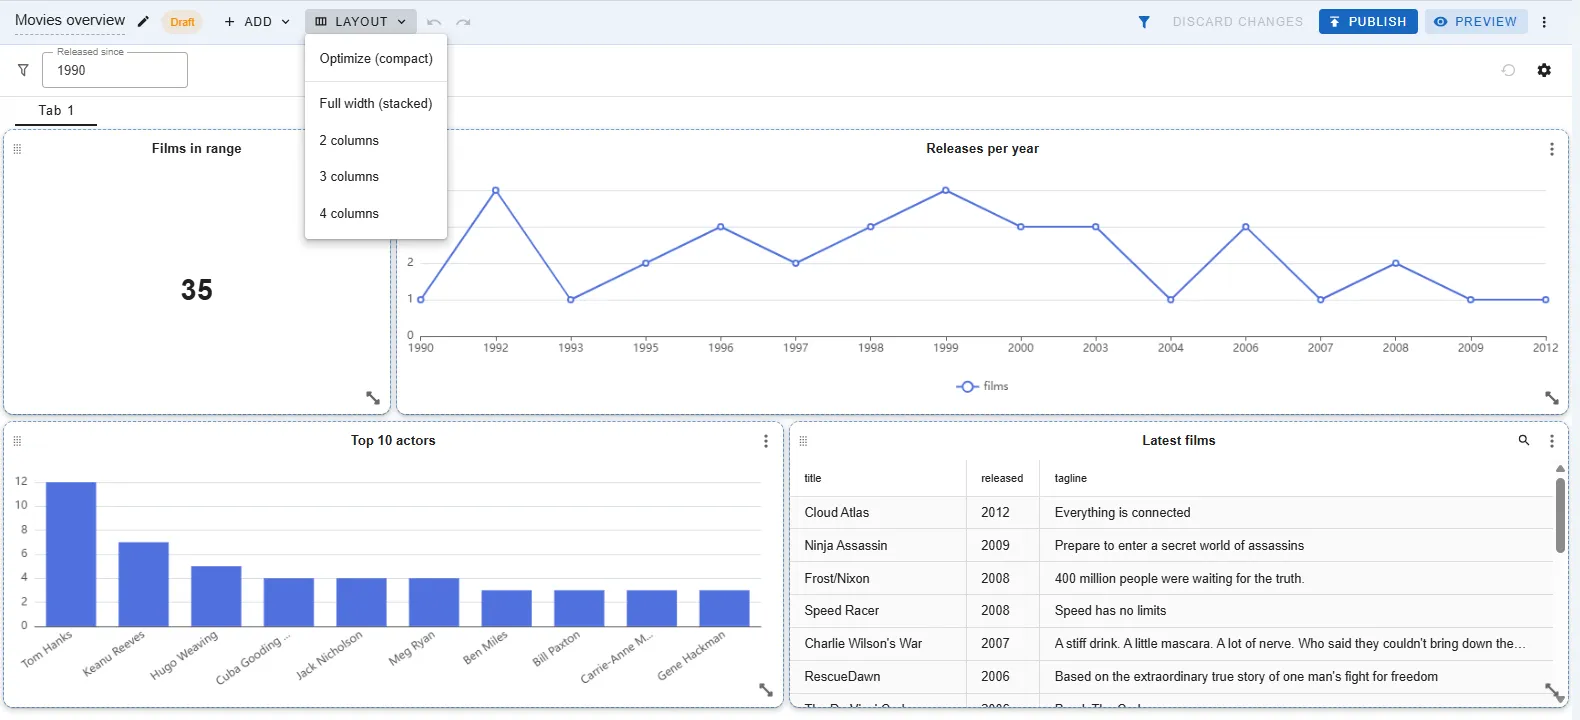
Dashboards now use a 12-column grid. Panels move upwards to fill empty space, and you can drag a panel by its header and resize the panel from its edges. While you drag or resize a panel, gdotv shows the panel’s width and height in grid units. If you make a mistake, you can undo and redo layout changes with Ctrl+Z and Shift+Ctrl+Z (Cmd on macOS).
In edit mode, the toolbar has a new Add menu for panels, Markdown text and tabs, and a new Layout menu. The Layout menu arranges every panel into a compact layout, a single stacked column, or two, three or four columns. In view mode, you can set panels to refresh automatically at an interval between 15 seconds and 15 minutes.
Private drafts
Editing a dashboard now creates a private draft. Your changes stay in the draft, and other users continue to see the published version until you click Save and publish or Publish. You can use Preview to see how the dashboard will look before publishing. You can also duplicate a dashboard from the sidebar. The MCP server uses the same draft system for dashboards from MCP clients.
Advanced parameters with autocompletable values
Parameters (also called query variables) are placeholders in a query, such as $country in Cypher. The user supplies a value for each parameter at run time. Parameters let one query answer many similar questions. Parameters have been the biggest focus of this rework.
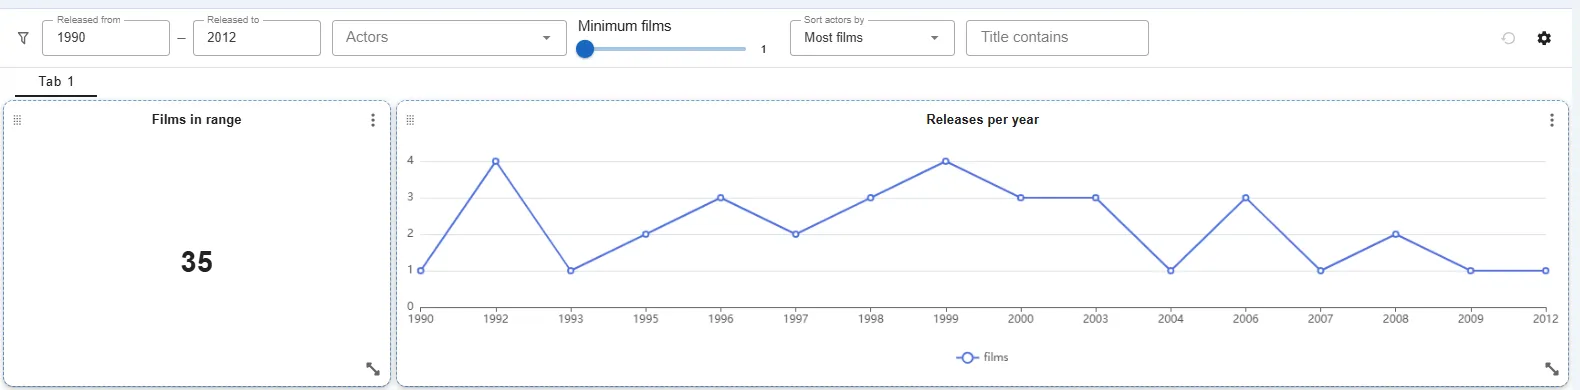
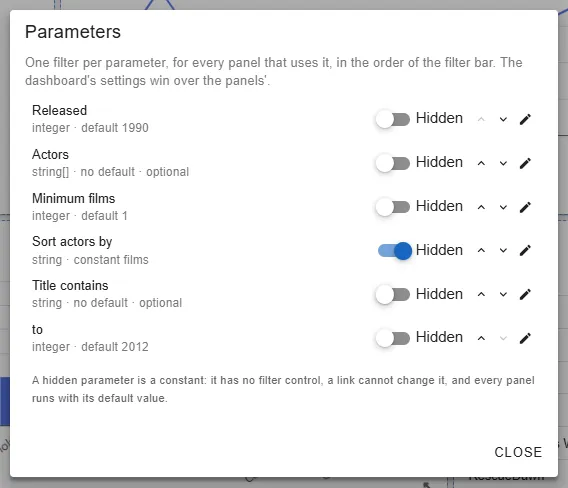
On dashboards, a filter bar across the top of the dashboard replaces the old full-screen form before each run. The filter bar shows one control for each parameter, and changing a value re-runs every panel with that parameter. You can set the filter bar to apply each change instantly, or to wait for a click on Apply. Waiting for Apply is useful for changing several filters at once. Any change from a default value is added to the dashboard’s URL, so you can share a link to the dashboard with your filters already applied.
Each parameter now has its own advanced settings:
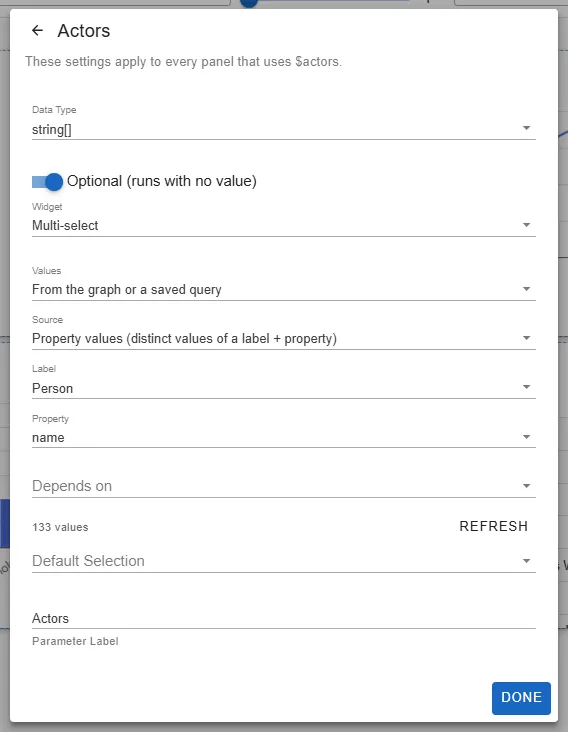
- More data types. Parameters can now be dates, IRIs (the identifiers used in RDF), or lists of strings or numbers, in addition to the existing types.
- Input widgets. You can choose how each parameter is entered: as text, a number, a slider, a dropdown, a multi-select, a switch, a date picker, or a date or number range for setting two parameters at once.
- Optional parameters. An optional parameter can be left empty, and the query then runs with a null value.
- Limits. Numeric parameters can have a minimum, a maximum and a step size.
- Relative dates. Date parameters accept relative values such as
today,now-7dorstartOfMonth. gdotv recalculates a relative value on every run of the query.
The biggest change is that parameter values can now be autocompleted. A parameter’s list of values can come from one of three sources:
- Free text
- A static list of options. You can give each option a display label, so that writing
US=United Statesshows “United States” in the dropdown and sendsUSto the query. - Values from your graph. gdotv can fill the list with the distinct values of a property on a particular label, or with the first column of a saved query’s results.
A parameter can also depend on another parameter. For example, a Countries list can show only the countries of the current choice in a Continent list.
gdotv now also checks every parameter value on the server before the query reaches your database. If a value has the wrong type or falls outside its limits, the panel shows an error, such as “Variable minRunways is 9, above the maximum 6”.
On a dashboard, a new Parameters dialog lets you reorder the filters, edit each parameter’s settings in one place, and hide a parameter to turn it into a fixed constant. Individual panels can also override the dashboard’s values with their own.
These parameter settings apply to reports too. When someone runs a report, the form uses the same widgets, value lists and validation.
View the Data Explorer’s generated query
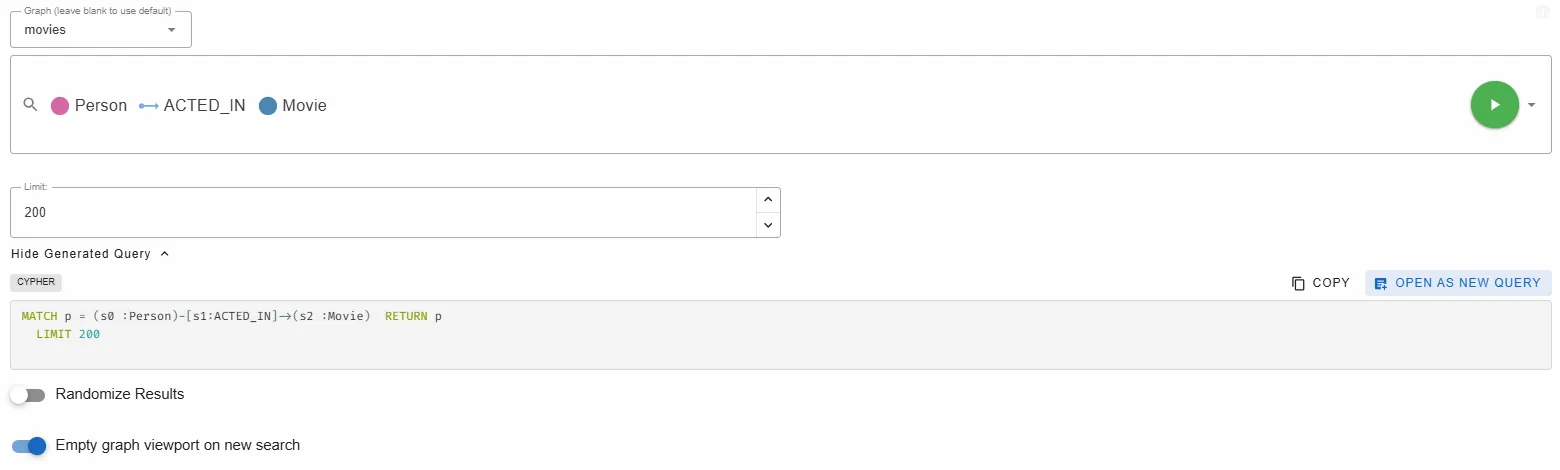
The Data Explorer lets you build a query without writing one, by choosing a path of labels and filters. You can now see gdotv’s generated query for your path. Click View Generated Query under the Limit field to show the query. The preview updates with every change to the path and includes your filter values. You can copy the query, or click Open as New Query to continue working on the query in the query editor.
Upgrade to LadybugDB 0.21.2
gdotv now supports LadybugDB 0.21.2, the latest release of the embedded graph database.
Note that LadybugDB upgrades older database files to the new format when gdotv opens them in read-write mode. If you share a database file with tools on an older version of LadybugDB, keep a backup of the file first.
Performance with many tabs open
gdotv now stays responsive when you have many tabs open. When more than five tabs are open, gdotv keeps the active tab and the five most recently used tabs fully loaded. Dashboards in hidden tabs stop refreshing automatically. Graph visualizations in tabs hidden for 15 seconds or longer release their rendering resources, but keep their layout and camera position, so the graph appears as you left it when you return to the tab.
Fixes
- SPARQL query guardrail warnings are now highlighted in the query editor again. Overlapping hints on the same part of a query are now merged into one marker.
- Keyboard shortcuts typed in the query editor no longer trigger shortcuts in the graph view.
- Gremlin path searches in the Data Explorer now filter by edge label.
Conclusion
This release changes how you can work with gdotv. With the MCP server, you can query your graph data in plain language from your MCP client, and create reports and dashboards from the same place, all within your existing gdotv permissions. The Graph Data Science panel brings centrality and community detection to the graph visualization, and the dashboard rework makes dashboards easier to lay out, safer to edit and more flexible to filter.
We would love to hear about your work with these new features, and especially about your prompts for your MCP client. Update to the latest version of gdotv to try the new features, and send us your requests for the next release.
About the author

Dr. Amber Lennox
Developer Relations Engineer
Amber manages developer relations at gdotv and (when not deep-diving into documentation) can be found wild swimming in questionable weather and working on personal programming projects like developing software for language learning. With a PhD in Astrophysics, Amber is particularly drawn to the mathematical and scientific aspects of graph theory and analytics.