Learning Graph Databases with gdotv & Practical Gremlin (2nd Edition) by Kelvin Lawrence & Stephen Mallette
 by Kelvin Lawrence & Stephen Mallette")
Back in the early days of gdotv, we had written a guide on learning graph databases with gdotv.
The guide built on Kelvin Lawrence’s brilliant free book Practical Gremlin: An Apache TinkerPop Tutorial by showing how the data and queries within it could be visualized and explored further in our all-in-one graph database client.
While the original book received periodic updates up until May 2022, the Gremlin query language has now changed so much that co-author Stephen Mallette has taken on the project of publishing a completely revised second edition. There’s plenty of new examples and refinements, but as Stephen puts it, “the core goal remains the same: to help you build an intuitive understanding of how Gremlin works.”
gdotv has also been constantly evolving since then, to the point where the examples and screenshots in the original post are almost unrecognizable now (even to us!). So we thought, what better time to publish a revised version of our graph database guide?
At the time of writing our original blog post in 2023, TinkerPop was in version 3.7, already one version ahead of the final draft of Practical Gremlin’s 1st edition. In 2025, version 3.8 was released, which “established a wide mix of features and improvements to Gremlin semantics designed to enhance language consistency”.
One significant change on the gdotv side has been the rebrand from G.V() to gdotv. Well, it’s less the name change and more the reason behind it that makes it significant. In its humble beginnings, gdotv was essentially an IDE for the Gremlin graph programming language, hence the name being akin to a common Gremlin query.
Since then, we’ve added support for several more languages, such as SPARQL (for RDF support) and Cypher, and dozens of other graph databases and graph query engines. Therefore, it was making less and less sense to have our name aligned so closely with just one of those languages.
Now, let’s dive into the newly revised and updated guide on learning graph databases with gdotv and Practical Gremlin (2nd edition).
First Steps with Apache TinkerPop & Gremlin
Kelvin Lawrence’s Practical Gremlin has long been the go-to free resource for anyone finding their feet with TinkerPop and Gremlin, and the second edition (co-authored by Kelvin Lawrence and Stephen Mallette) brings it fully up to date.
The book walks through the TinkerPop framework and Gremlin query language using real data and genuine use cases, the kind of grounded approach that makes abstract concepts click much faster.
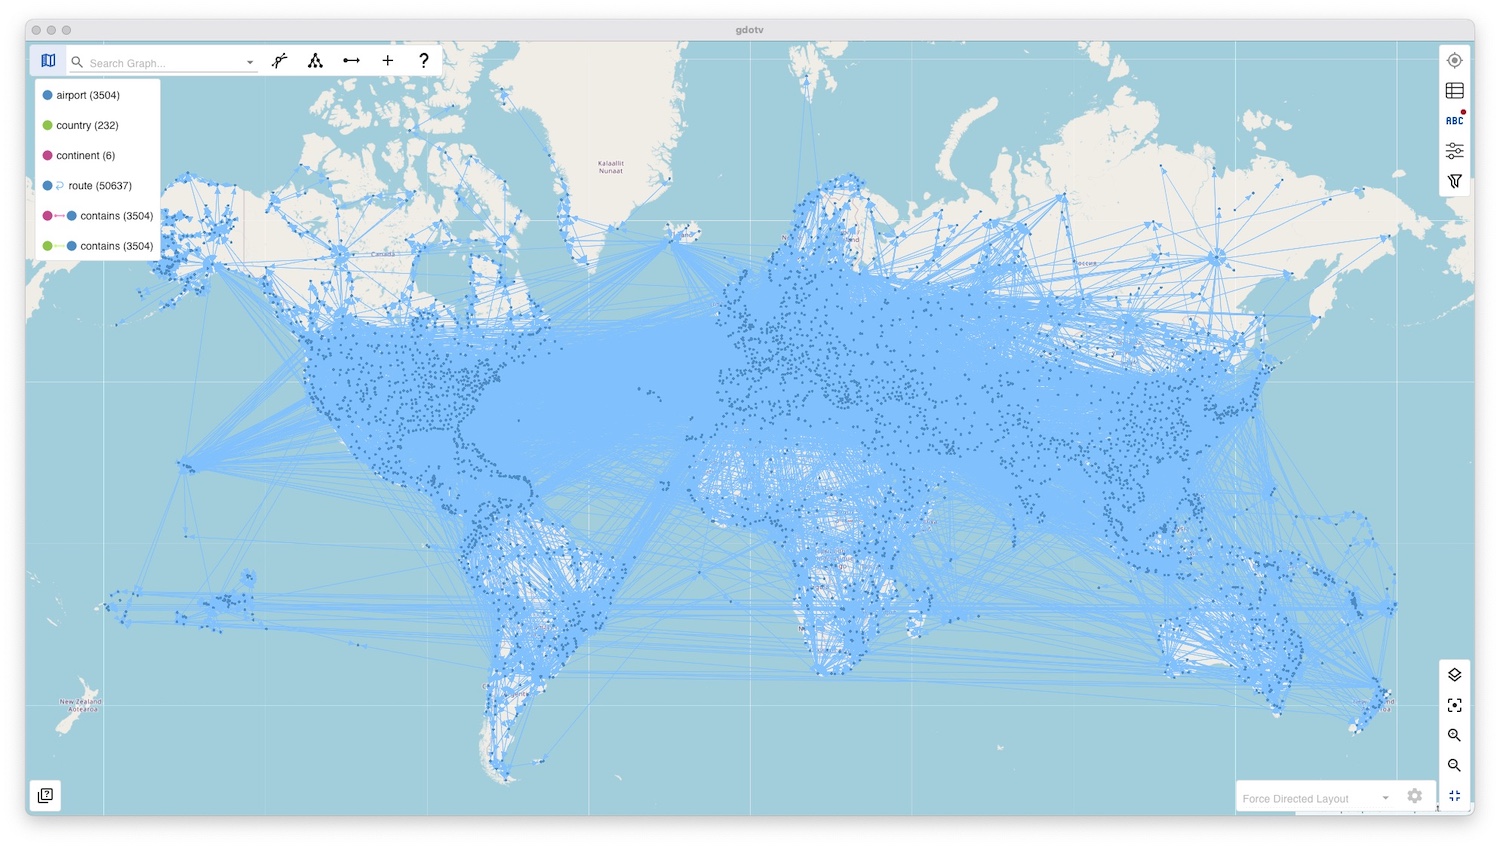
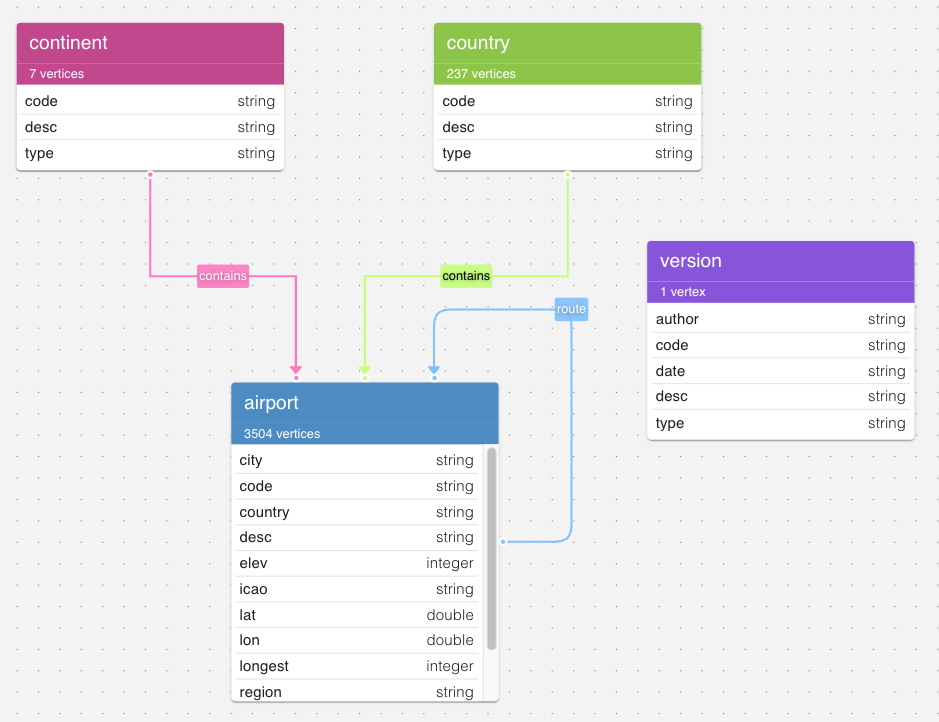
In this guide, we’ll work with the Air Routes dataset that portrays the relationship between airports, countries, and continents. Continents contain countries, and countries contain airports which have routes between them, connecting cities and countries all over the world. This can be represented visually as an Entity-Relationship diagram using gdotv’s Graph Schema tool. Here’s what that looks like:
Getting Started with gdotv
To begin, you’ll need to download and install gdotv. It’s free and will only take you five minutes (or likely less).
After launching gdotv, you’ll see the new welcome screen. To create an in-memory TinkerGraph instance with the updated Air Routes dataset pre-loaded, simply click on ‘Air Routes’ under ‘Sample Graphs’. It couldn’t be easier!
A new query tab will open and automatically run the following query:
g.E().limit(100)
This Gremlin query is basically saying, “fetch me the first 100 edges (sometimes called ‘arcs’ or ‘relationships’) in the database”, which lets gdotv produce an initial bite-sized graph visualization.
The query itself doesn’t return any vertices (sometimes called ‘nodes’), but gdotv uses the source and target vertex ID’s from the edge objects that do get returned to fill in the gaps, so to speak. The “pure” Gremlin response can be viewed in the Summary tab as both Console and JSON output.
If you’d like to replicate the world map view from earlier in this blog post, here’s how: Open ‘Map Layer Settings’ on the bottom right toolbar, select ‘lat’ and ‘lon’ for the keys, as shown in the image below.
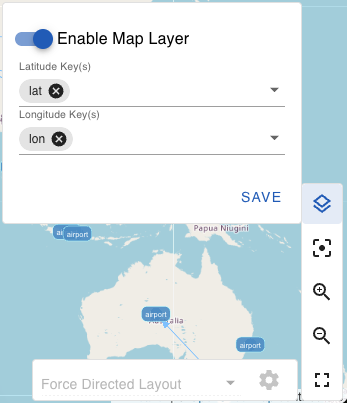
After that, the airport vertices will all fall into place. Changing the query to g.E() will show the entire graph, however it might take a while to load depending on your machine.
Congrats on visualizing your first Gremlin query with gdotv! Of course, there’s a lot more you can do with it. gdotv has evolved far beyond its initial function as a Gremlin IDE, but it still reliably serves that purpose. This blog post will only scratch the surface of its full capabilities, and the Practical Gremlin book can mostly be followed by running the queries inside this newly opened query tab.
Click on the other result tabs (Results, Vertices, Edges) for some helpful context about what’s being displayed, and to gain a fuller picture. You can also click on any element on the graph to view its full details and modify its properties.
There’s a few useful things you can do via the left navigation pane (pictured below).
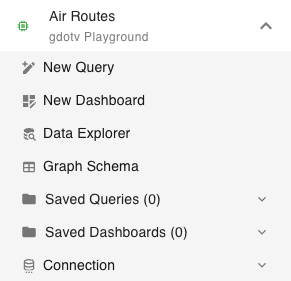
To view your graph’s data model as an entity-relationship (ER) diagram, click on ‘Graph Schema’. The ‘Data Explorer’ section allows you to explore paths within your graph without having to write any Gremlin queries. Clicking on ‘New Query’ will open another query tab – you can have as many of these open as you want, and even display them side by side to easily compare.
If you’ve followed along up to this point, you’ll be ready to crack on with the Practical Gremlin book, but feel free to play around as much as you like!
Since we’ve already loaded Air Routes in a gdotv in-memory graph, there’s no need to follow sections 2.5 and 2.6 of the book, but we do recommend giving them a read for context and trying them out at some point. Sections 3 through 5 are where you’ll find the Gremlin queries to try out, and later sections will help you with some more advanced activities like developing your own graph application, deploying a graph database, and where you can go from there.
When trying out the queries in the book, we highly recommend typing them manually in gdotv to see the smart autocomplete and reference panel in action!
Graph Visualization Options
Here are some advanced configuration options you can set in gdotv to enhance your graph visualization. The Labels and Styles side panel will open inside the graph view when your first query is run:
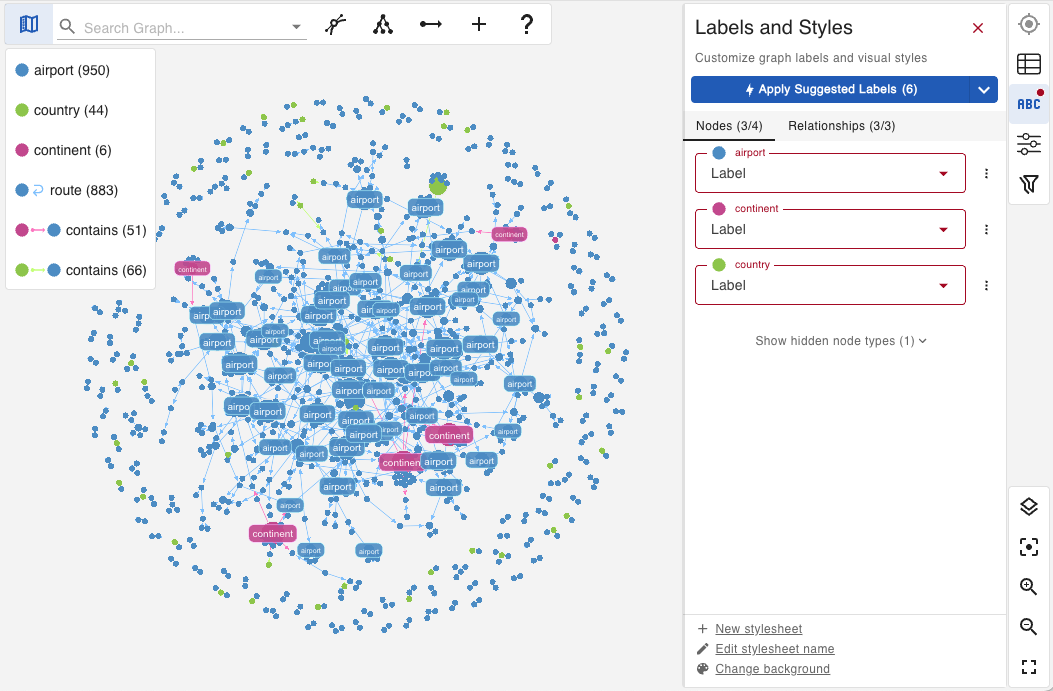
Possibly the most valuable feature here is being able to select what text to display on vertex and edge labels. This allows you to quickly and efficiently get a visual of your graph data.
There’s a new ‘Apply Suggested Labels’ feature in gdotv which makes an educated guess as to what would be the most useful text to display for each vertex and edge label. It’s very handy for making a quick start with more complex datasets, and you can always tweak it to your liking later.
You don’t have to stick to the suggested labels though! Feel free to change them to whatever you like, and the graph visualization will update in real time. You can also create multiple stylesheets and swap between them.
There’s too many options to get fully into here, but an exciting new one is being able to set a custom template string as the display label, combining properties with text. For edges, this even includes the properties of their in and out vertices.
The gdotv team has also further refined the available graph layout algorithms and added some configuration settings. The usefulness of each layout depends highly on your type of data, which is a lesson for another time!
Everything Else
As mentioned before, gdotv has grown well beyond a Gremlin IDE. A couple of things worth knowing that aren’t specific to this tutorial:
Multi-language support: Alongside Gremlin, gdotv now supports many other graph query languages such as Cypher, GoogleSQL, GQL, and SPARQL, so if you find yourself working with RDF data or a Neo4j-style graph database later, you won’t need a different tool.
Dashboards: Query results can be pinned to dashboards in a range of display types. Can be used in a way such that developers can set up the queries, so less technical users only need to run them. Useful for monitoring or sharing graph insights between teams.
For the full picture, the gdotv documentation is the best place to start. Be sure to keep an eye on LinkedIn and the blog as well, covering new features as they ship.
Conclusion
Graph databases reward curiosity, and once you start seeing your data as a network of relationships rather than rows and columns, it’s hard to go back.
Practical Gremlin, 2nd edition, is the best free starting point available, and the Air Routes dataset is great for making abstract concepts relatively straightforward.
What’s changed since the original version of this post is that both the book and gdotv have matured considerably. TinkerPop 3.8 brought meaningful language improvements, which are all reflected in Stephen’s revisions, and gdotv is now a multi-language graph database client rather than a Gremlin-only IDE. In that sense, this is a brilliant time to be getting started.
Other resources worth bookmarking: Apache TinkerPop’s own Getting Started guide and the TinkerPop documentation for when you’re ready to go deeper. And when you’re ready to move beyond a local in-memory graph, gdotv supports a wide range of hosted and self-managed graph technology systems: AWS Neptune, JanusGraph, Azure Cosmos DB, and many more.
What are you waiting for? Download gdotv and test out visualizing your Gremlin queries and exploring your graph data.


