Tag
Graph visualization
How to turn connected data into graphs people can actually read, with practical guides and expert insights from the team at gdotv.
78 posts
Building a Property Graph Pipeline from the TEG Benchmark: Part 4 – A Critical Examination of Text-Enriched Graphs
Read our critical analysis of TEG-DB: seven empirical findings on edge text quality, semantic entropy, and evaluation design gaps in text-enriched graph benchmarks.
How does gdotv compare to Apache AGE Viewer?
How does gdotv compare against Apache AGE Viewer? Follow along with this deep-dive as we explore the various features of each framework.
Building a Property Graph Pipeline from the TEG Benchmark: Part 3 – Exploring with gdotv
Explore four queries in gdotv against TEG-DB show what edge text enables: sentiment polarity, citation chains, and contradictions invisible to graph topology.
Building a Property Graph Pipeline from the TEG Benchmark: Part 2 – Populating the AWS Neptune Graph
Load TEG-DB CSV files into Amazon Neptune via the bulk loader API, connect gdotv with IAM auth, and verify the loaded graph with Gremlin.
Building a Property Graph Pipeline from the TEG Benchmark: Part 1 – From HuggingFace to Structured CSV
Find out how to build a property graph pipeline converting the TEG-DB graph benchmark from PyTorch Geometric pickles into AWS Neptune import-ready CSV files.
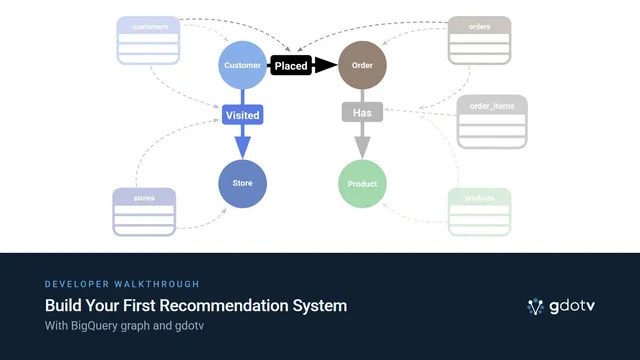
Build Your First Recommendation System with BigQuery Graph
Learn how to build and construct recommendation systems using graphs by following this Google BigQuery demo with gdotv.
Introducing AI Query Generation and Cypher Dialect specific autocomplete [gdotv v3.61.129 Release Notes]
Explore the latest release of gdotv, featuring a brand new LLM chat interface, dialect aware Cypher autocomplete, and more!
Visualizing Apache AGE: Connecting gdotv and Exploring the Air Routes Graph
Connect gdotv to Apache AGE and explore your graph visually: schema view, Cypher and SQL editor, graph visualization, no-code explorer, WYSIWYG editing.
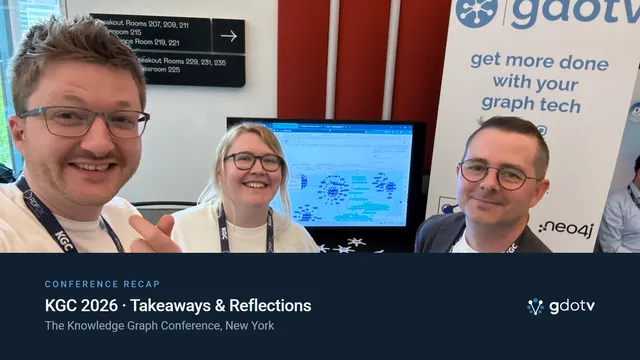
Our Favorite Talks & Memories from the Knowledge Graph Conference 2026
Catch up on everything that happened at the Knowledge Graph Conference 2026 with highlights from the gdotv team, including top workshops and must-see talks.
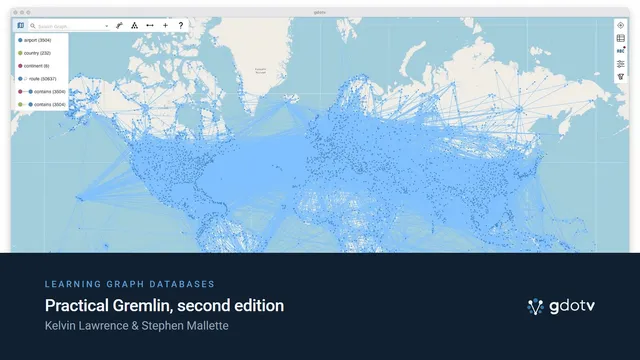
Learning Graph Databases with gdotv & Practical Gremlin (2nd Edition) by Kelvin Lawrence & Stephen Mallette
Dive into the world of graph databases with this dev guide using Practical Gremlin (2nd ed.) and gdotv with updated code and data visualization examples.
Who Needs a Chart When You Can Just Chat? [feat. Data Day Texas 2026]
Watch (or read) this presentation by Christian Miles on the future of graph data visualization in the world of LLMs – inspired by his talk at Data Day Texas.
The Weekly Edge: BigQuery Graph Goes Big, RDF 1.2 Advances, TinkerPop Hatches 3 New Gremlins, & more
Catch up on what’s new in graph tech this week, including BigQuery Graph’s debut, another RDF 1.2 milestone, TinkerPop 4.0, a graph viz home run, and more.
Our solutions
Whether you're an individual or part of a larger team, there's a version of gdotv that's right for you.
gdotv Desktop
The ultimate graph database IDE.
Install and connect your first graph database in 2 minutes.
gdotv Team
The unified workbench for graph data teams.
Deploy to your team in under 15 minutes. Marketplace or self-hosted.
gdotv Enterprise
The universal graph intelligence platform.
For organization-wide deployments. Bring graph data directly to your analysts.